
Analysis
Top 10 Economic Models for Developing Nations to Adopt and Succeed as the Biggest Economy
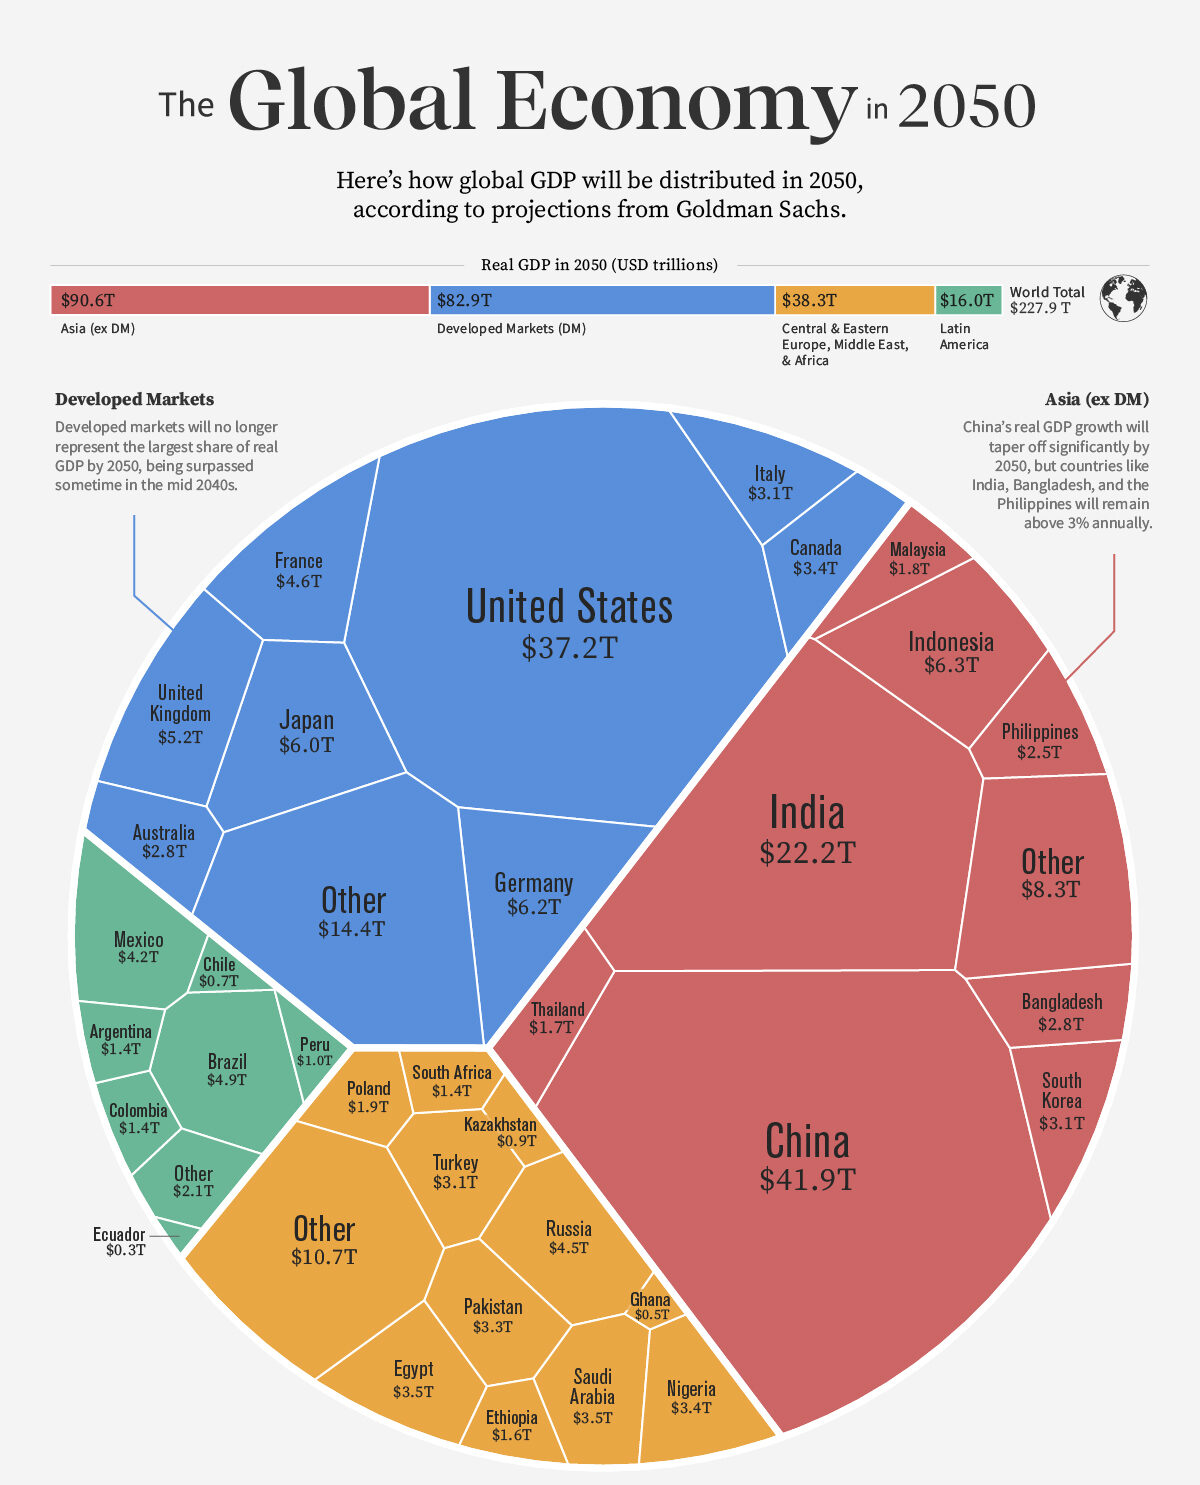
The $100 Trillion Question: Who Will Own the Next Era of Global Economic Power?
The numbers are no longer a forecast—they are a verdict. According to the IMF’s World Economic Outlook (April 2025), emerging and developing economies now account for approximately 59% of global GDP measured in purchasing-power-parity terms, a tectonic shift from 44% in 2000. Yet the spoils of this growth remain grotesquely uneven. A handful of nations are sprinting toward genuine economic superpower status, while dozens of others remain mired in the structural traps—commodity dependence, institutional fragility, capital flight, and the middle-income ceiling—that have historically foreclosed their ambitions.
The question facing every finance minister, central banker, and development economist today is brutally direct: which blueprint do you choose? History has proven there is no universal panacea. The Washington Consensus—that rigid cocktail of privatization, deregulation, and fiscal austerity—generated growth in some contexts and catastrophe in others. The state-led developmental model of East Asia created economic miracles but also sovereign debt crises. Green industrialization looks compelling on paper until grid reliability becomes a crisis.
What follows is a rigorous, data-driven examination of the ten most powerful economic development models available to policymakers today. Each is assessed through the lens of real-world implementation, empirical outcomes, geopolitical viability, and long-run sustainability. The conclusion, reinforced by the evidence, is unambiguous: the nations that will ascend to the apex of the global economy in the 21st century will not be those that followed a single doctrine—they will be those that mastered the art of intelligent hybridization.
| 📊 Key Insight: Nations that reached upper-middle income status fastest between 2000–2024 averaged 3.2 more institutional reforms per decade than their peers, per World Bank Governance Indicators data. |
| MODEL 01 OF 10 · CORE FRAMEWORK: INDUSTRIAL POLICY & EXPORT-LED GROWTH |
1. The East Asian Export-Industrialization Engine: Manufacturing Supremacy Through Deliberate State Choreography
Core Thesis
No development model has generated wealth faster, at greater scale, or more reproducibly than export-led industrialization. The fundamental logic is elegant: rather than producing exclusively for a small domestic market constrained by low incomes, a nation leverages its comparative advantages—abundant labour, strategic location, undervalued currency—to integrate into global value chains and capture foreign demand. The state does not merely step aside; it actively choreographs industrial champions, negotiates market access, directs credit, and manages the exchange rate with surgical precision. The emerging market economic strategy here is not laissez-faire—it is disciplined mercantilism in a globalized wrapper.
Real-World Exemplar: South Korea & Vietnam
South Korea’s trajectory from a per-capita GDP of roughly $1,200 in 1965 to over $33,000 today is one of the most studied developmental arcs in modern economics. The World Bank’s Korea Development Overview documents how successive Five-Year Plans coordinated between the state and the chaebol conglomerates—Samsung, Hyundai, LG—compressed industrial transitions that took Europe and America a century into three decades. Vietnam has since replicated this playbook in miniature: World Bank Vietnam data shows exports grew from 46% of GDP in 2000 to over 93% in 2023, propelling manufacturing-led growth averaging 6.4% annually.
The Evidence
| Dimension | Detail | Key Metric |
| Model | Export-Led Industrialization | East Asian Development State |
| Case Country | Vietnam (2000–2023) | South Korea (1965–1995) |
| GDP Growth CAGR | ~6.4% annually | ~8.1% annually |
| Poverty Reduction | 72% → 4.8% headcount | 80%+ → sub-5% headcount |
| Export / GDP Ratio | 93% (2023) | Grew from 3% to 40% |
| Key Enabler | FDI + SEZs + Education | State-directed credit + POSCO |
| Source | World Bank Open Data | IMF Working Papers |
| MODEL 02 OF 10 · CORE FRAMEWORK: LEAPFROG ECONOMICS & DIGITAL-FIRST DEVELOPMENT |
2. Leapfrog Economics: How Digital Infrastructure Lets Developing Nations Skip Entire Industrial Eras
Core Thesis
Leapfrog economics posits that developing nations are not condemned to recapitulate every stage of industrial evolution that wealthy nations traversed. A country need not build copper telephone networks if it can deploy LTE and 5G directly. It need not construct coal-fired baseline power if solar microgrids can deliver electricity to rural households at lower levelized cost. The strategic implication is transformative: rather than playing catch-up, a nation can arrive at the technological frontier first, unburdened by legacy infrastructure or incumbent lobbying. This is arguably the most exciting—and underutilized—sustainable growth model for developing nations in the current decade.
Real-World Exemplar: Rwanda & Kenya
Rwanda’s Vision 2050 explicitly deploys leapfrog theory as national strategy. The IMF Rwanda Article IV Consultation (2024) notes that ICT now contributes approximately 3.5% of GDP and growing, while mobile money penetration exceeds 40% of adults—bypassing the need for traditional bank branch networks. Kenya’s M-Pesa story is perhaps the paradigmatic leapfrog case: over 65% of Kenya’s GDP flows through the platform annually, according to GSMA Intelligence data, creating financial inclusion at a velocity no conventional banking expansion could have achieved.
| Dimension | Detail | Key Metric |
| Dimension | Detail | Key Metric |
| Model | Leapfrog / Digital-First | Mobile-led financial inclusion |
| Case Country | Kenya / Rwanda | 2010–2024 |
| GDP Impact (Digital ICT) | +3.5% of GDP (Rwanda) | McKinsey: +$300B SSA potential |
| Mobile Money Penetration | 65%+ GDP via M-Pesa (Kenya) | GSMA 2024 |
| Cost vs. Traditional Banks | 60–80% cheaper delivery | CGAP / World Bank 2023 |
| Source | IMF, McKinsey Global Institute | GSMA Intelligence |
| MODEL 03 OF 10 · CORE FRAMEWORK: NATURAL RESOURCE SOVEREIGN WEALTH CONVERSION |
3. The Resource Curse Antidote: Sovereign Wealth Fund Architecture and the Norwegian / Gulf Pivot
Core Thesis
For resource-rich developing nations, the greatest economic threat is not scarcity but abundance. The ‘resource curse’—the paradox whereby commodity wealth correlates with slower growth, weaker institutions, and greater inequality—is empirically documented across dozens of cases, from Nigeria to Venezuela. The corrective model is institutional: create a sovereign wealth fund that sequesters commodity revenues, insulates the domestic economy from Dutch Disease currency appreciation, and invests proceeds in diversified global assets that generate perpetual returns after the resource is exhausted. The BRICS economic trajectory increasingly incorporates this framework as member states seek to convert finite natural capital into enduring financial capital.
Real-World Exemplar: Norway & Botswana
Norway’s Government Pension Fund Global—managed by Norges Bank Investment Management—surpassed $1.7 trillion in assets under management in 2024, equivalent to approximately $325,000 per Norwegian citizen. The Norges Bank Investment Management Annual Report 2024 shows that the fund’s equity portfolio alone generated a 16.1% return in 2023. Botswana offers the developing-nation proof-of-concept: the Pula Fund, established in 1994, channeled diamond revenues into diversified reserves, enabling counter-cyclical fiscal policy and maintaining investment-grade credit ratings across commodity cycles—a rare achievement in Sub-Saharan Africa, per IMF Botswana Article IV 2024.
| Dimension | Detail | Key Metric |
| Dimension | Detail | Key Metric |
| Fund | Norway GPFG | Botswana Pula Fund |
| AUM (2024) | $1.7 trillion | ~$5.5 billion |
| Per-Capita Value | ~$325,000 / citizen | ~$2,200 / citizen |
| 2023 Return | 16.1% | Diversified portfolio return |
| Credit Rating Preserved? | AAA | Investment Grade |
| Source | NBIM Annual Report 2024 | IMF, Bank of Botswana |
| MODEL 04 OF 10 · CORE FRAMEWORK: SERVICES-LED GROWTH & KNOWLEDGE ECONOMY |
4. The Services Leapfrog: From Agricultural Subsistence to a Knowledge Economy Without a Manufacturing Middle
Core Thesis
India’s development trajectory has confounded classical economists who assumed manufacturing must precede services. India essentially skipped the textile-and-steel phase that defined British and American industrialization, catapulting directly into high-value software, business process outsourcing, and—most recently—global capability centres and AI engineering hubs. Services-led growth is now a credible emerging market economic strategy precisely because digital services are tradeable at scale, require relatively modest physical capital investment, and can generate high-wage employment disproportionately concentrated among educated urban populations.
Real-World Exemplar: India & the Philippines
India’s technology and services exports surpassed $290 billion in fiscal year 2023-24, according to NASSCOM Strategic Review 2024. The IMF’s India Article IV Consultation 2024 projects India as the world’s third-largest economy by 2027, propelled heavily by services sector productivity growth averaging 8.2% annually over the preceding decade. The Philippines, meanwhile, demonstrates that BPO-led services growth can generate 1.3 million high-skill jobs and $38 billion in annual remittances-equivalent service receipts.
| Dimension | Detail | Key Metric |
| Dimension | Detail | Key Metric |
| Model | Services & Knowledge Economy | India / Philippines 2000–2024 |
| Tech/Services Exports | $290B+ (India FY24) | NASSCOM 2024 |
| Services GDP Share | ~55% of India’s GDP | World Bank 2024 |
| Wage Premium | IT jobs: 4–8× median wage | ILO Labour Statistics |
| Projected GDP Rank | #3 globally by 2027 | IMF WEO April 2025 |
| Source | IMF, NASSCOM, Goldman Sachs | Global Investment Research 2024 |
| MODEL 05 OF 10 · CORE FRAMEWORK: GREEN INDUSTRIALIZATION & CLIMATE ECONOMY |
5. Green Industrialization: Turning the Climate Crisis Into the Greatest Development Opportunity of the 21st Century
Core Thesis
For nations that have not yet built their energy infrastructure, the climate crisis is not merely a threat—it is a once-in-a-century development opportunity. The economics of renewable energy have undergone a structural transformation since 2015 that is nothing short of revolutionary: the levelized cost of solar PV has declined approximately 90% over the past decade, according to the International Renewable Energy Agency (IRENA). Nations that build their industrial base on cheap, abundant renewable energy will enjoy structural competitive advantages in energy-intensive manufacturing for generations. Moreover, the emerging global carbon border adjustment mechanism—particularly the EU’s CBAM—effectively penalizes high-carbon production, creating a first-mover advantage for nations that industrialize green from the outset.
Real-World Exemplar: Morocco & Chile
Morocco’s Noor Ouarzazate complex—at 580MW one of the world’s largest concentrated solar power installations—is the cornerstone of an industrial strategy that targets 52% renewable electricity by 2030, per IRENA’s Africa Renewable Energy Outlook 2023. Morocco now exports clean electricity to Europe via sub-sea cable and is positioning itself as a green hydrogen exporter—a market the IEA Global Hydrogen Review 2024 values at potentially $200 billion annually by 2030. Chile, with the Atacama Desert’s irradiation levels producing solar electricity at under $20/MWh, has become a natural laboratory for green copper smelting—critical for the EV supply chain.
| Dimension | Detail | Key Metric |
| Dimension | Detail | Key Metric |
| Model | Green Industrialization | Morocco / Chile 2015–2030 |
| Solar Cost Decline | ~90% since 2015 | IRENA 2024 |
| Morocco Renewable Target | 52% by 2030 | Ministry of Energy Morocco |
| Green H₂ Market Value | $200B/yr by 2030 (potential) | IEA Hydrogen Review 2024 |
| Chile Solar LCOE | <$20/MWh (Atacama) | BNEF Clean Energy Index |
| EU CBAM Impact | 15–35% tariff on high-carbon goods | European Commission 2024 |
| Source | IRENA, IEA, BNEF | European Commission |
| MODEL 06 OF 10 · CORE FRAMEWORK: SPECIAL ECONOMIC ZONES & INSTITUTIONAL EXPERIMENTATION |
6. Special Economic Zones as Laboratories of Capitalism: China’s SEZ Blueprint for the Developing World
Core Thesis
One of the most powerful tools in the developmental state’s arsenal is the Special Economic Zone—a geographically bounded area where a nation effectively runs a different, more market-friendly regulatory regime than the broader domestic economy. SEZs allow governments to attract FDI, build export capacity, and test institutional reforms without requiring political consensus for nationwide liberalization. The evidence base is extensive. The World Bank’s 2024 report on SEZs globally documented over 5,400 active zones across 147 countries, generating combined exports exceeding $3.5 trillion annually.
Real-World Exemplar: China’s Shenzhen & Rwanda’s Kigali SEZ
Shenzhen’s transformation from a fishing village of 30,000 people in 1979 to a metropolitan economy of 13 million generating GDP equivalent to a mid-sized European nation within a single generation is the most dramatic example of deliberate institutional engineering in modern history. The Brookings Institution’s analysis of China’s SEZ model attributes Shenzhen’s success to the unique combination of preferential tax regimes, streamlined customs, and—critically—de facto property rights protections that did not exist in the rest of China at the time. Rwanda’s Kigali SEZ, while embryonic by comparison, has attracted 30+ international firms since 2011 and is deliberately modelled on Singapore’s Jurong Industrial Estate.
| Dimension | Detail | Key Metric |
| Dimension | Detail | Key Metric |
| Model | Special Economic Zones (SEZs) | China / Rwanda |
| Global SEZ Count | 5,400+ active zones | World Bank 2024 |
| Global SEZ Exports | $3.5 trillion annually | World Bank SEZ Report 2024 |
| Shenzhen GDP Growth | From $0.3B (1980) to $490B+ (2023) | CEIC / China NBS |
| Kigali SEZ Investment | 30+ multinationals attracted | Rwanda Development Board |
| Source | World Bank, Brookings | CEIC, Rwanda Dev. Board |
| MODEL 07 OF 10 · CORE FRAMEWORK: HUMAN CAPITAL & TALENT-LED GROWTH STRATEGY |
7. The Singapore Theorem: Why Human Capital Investment Is the Highest-Return Asset Class in Development Economics
Core Thesis
Lee Kuan Yew famously observed that Singapore’s only natural resource is its people. The meticulous, systematic cultivation of human capital—through elite technical education, continuous workforce retraining, immigration of specialized talent, and ruthless meritocracy in public sector staffing—transformed a malarial swamp into the world’s fourth-largest financial centre by assets under management. The Singapore theorem posits that in the knowledge economy, human capital is not just one factor of production among many—it is the meta-factor that determines how productively all other factors are deployed. For developing nations, this model is simultaneously the most difficult (requiring generational investment and institutional patience) and the most durable.
Real-World Exemplar: Singapore & Estonia
Singapore’s investment in education consistently ranks among the highest globally as a share of government spending. The result: Singapore’s students rank #1 globally in mathematics and science on OECD PISA 2022 assessments, a pipeline that feeds directly into a workforce commanding the highest median wages in Asia. Estonia—a nation of 1.3 million—built a digital governance infrastructure (e-Estonia) so sophisticated that 99% of government services are accessible online, reducing bureaucratic friction costs by an estimated 2% of GDP annually, per McKinsey Global Institute’s Digital Estonia case study.
| Dimension | Detail | Key Metric |
| Dimension | Detail | Key Metric |
| Model | Human Capital Investment | Singapore / Estonia |
| PISA Math Rank | Singapore: #1 globally | OECD PISA 2022 |
| e-Estonia Savings | ~2% of GDP/year | McKinsey Digital Govt. Review |
| Singapore Median Wage | Highest in Asia | MOM Singapore Statistics 2024 |
| Education ROI | +8–13% wages per year schooling | World Bank HCI 2024 |
| Source | OECD, McKinsey, World Bank | Ministry of Manpower SG |
| MODEL 08 OF 10 · CORE FRAMEWORK: REGIONAL INTEGRATION & BLOC-LEVEL ECONOMICS |
8. The Bloc Multiplier: How Regional Economic Integration Transforms Small-Market Disadvantage Into Collective Scale
Core Thesis
A nation of 20 million people with a $15 billion GDP is, in isolation, a rounding error in global trade negotiations. A bloc of 15 such nations, integrated under a common external tariff and harmonized regulatory framework, becomes a $225 billion market—large enough to attract serious FDI, negotiate meaningful trade agreements, and support regional value chains that would be economically unviable for any member in isolation. The BRICS economic trajectory increasingly demonstrates this logic at the largest scale: the bloc now represents over 35% of global GDP on PPP terms, per IMF data, creating collective bargaining power in international financial architecture that no single member could wield alone.
Real-World Exemplar: ASEAN & the African Continental Free Trade Area
ASEAN’s evolution from a loose political forum into the world’s fifth-largest economy as a bloc—with combined GDP exceeding $3.6 trillion—illustrates the compounding benefits of integration. The ASEAN Secretariat Statistical Yearbook 2024 shows intra-ASEAN trade reaching $756 billion in 2023. The African Continental Free Trade Area (AfCFTA), fully operational since 2021, carries even more transformative potential: the World Bank AfCFTA Impact Assessment 2023 projects the agreement could lift 30 million Africans out of extreme poverty and boost intra-African trade by 81% by 2035—if implemented with fidelity.
| Dimension | Detail | Key Metric |
| Dimension | Detail | Key Metric |
| Model | Regional Integration / Bloc Economics | ASEAN / AfCFTA |
| ASEAN GDP (2023) | $3.6 trillion (combined) | ASEAN Secretariat 2024 |
| Intra-ASEAN Trade | $756 billion (2023) | ASEAN Stat Yearbook 2024 |
| AfCFTA Poverty Lift | 30 million by 2035 (projected) | World Bank 2023 |
| AfCFTA Trade Boost | +81% intra-African trade potential | World Bank AfCFTA Report |
| Source | ASEAN Secretariat, World Bank | IMF BRICS Monitor 2024 |
| MODEL 09 OF 10 · CORE FRAMEWORK: INSTITUTIONAL QUALITY & ANTI-CORRUPTION ARCHITECTURE |
9. The Invisible Infrastructure: How Institutional Quality and Anti-Corruption Reform Unlock Every Other Development Model
Core Thesis
Every other model on this list is rendered partially or wholly ineffective in the absence of one foundational precondition: institutions that are reliable, transparent, and resistant to elite capture. This is the uncomfortable truth that the Washington Consensus got right in diagnosis, if catastrophically wrong in prescription. The World Bank’s Worldwide Governance Indicators demonstrate a near-linear correlation between rule of law scores, control of corruption metrics, and long-run per-capita income growth. Nations that implement credible anti-corruption architecture—independent judiciaries, digitized procurement, beneficial ownership registries, whistleblower protections—attract more FDI per capita, service their debt at lower spreads, and compound their human capital investments more efficiently.
Real-World Exemplar: Georgia & Uruguay
Georgia’s radical anti-corruption reforms between 2004–2012—which included abolishing and reconstituting the entire traffic police force overnight, digitalizing the national property registry, and publishing every state contract online—generated a 30-point improvement in Transparency International’s Corruption Perceptions Index within eight years. The World Bank Doing Business evolution for Georgia saw the nation climb from 112th to 7th globally in ease of doing business in the same period. FDI as a share of GDP tripled. Uruguay’s independent anti-corruption framework and judicial independence scores—the highest in Latin America per World Justice Project Rule of Law Index 2024—have consistently attracted investment-grade credit ratings despite being a small, commodity-linked economy.
| Dimension | Detail | Key Metric |
| Dimension | Detail | Key Metric |
| Model | Institutional Reform / Anti-Corruption | Georgia / Uruguay |
| Georgia CPI Change | +30 points (2004–2012) | Transparency International |
| Georgia Doing Business Rank | 112th → 7th globally | World Bank Doing Business |
| FDI Impact | Tripled as % of GDP post-reform | UNCTAD World Investment Report |
| Uruguay Rule of Law | #1 in Latin America | World Justice Project 2024 |
| Source | Transparency International, WJP | World Bank WGI 2024 |
| MODEL 10 OF 10 · CORE FRAMEWORK: SOUTH-SOUTH COOPERATION & ALTERNATIVE CAPITAL ARCHITECTURE |
10. South-South Cooperation and the New Financial Architecture: Escaping the Dollar Trap and Western Conditionality
Core Thesis
The emerging consensus among development economists is that the post-Bretton Woods financial architecture—dominated by the IMF, World Bank, and Western capital markets—imposes conditionalities and carries structural biases that have, at minimum, complicated and at worst actively obstructed the development ambitions of nations in the Global South. The rapid expansion of South-South cooperation frameworks—China’s Belt and Road Initiative, the New Development Bank, the Asian Infrastructure Investment Bank, and bilateral currency swap arrangements—represents a genuine structural shift in the menu of available financing options for developing nations. The BRICS economic trajectory now includes serious discussion of a BRICS reserve currency, and the NDB’s paid-in capital base has reached $10 billion, per its 2024 Annual Report.
Real-World Exemplar: Ethiopia & Indonesia
Ethiopia’s industrial park strategy—financed substantially through Chinese development finance and the NDB—created 100,000+ manufacturing jobs in six years and generated $2.1 billion in export revenues from apparel and light manufacturing, per UNCTAD World Investment Report 2024. Indonesia has strategically leveraged South-South arrangements to negotiate better terms on nickel processing requirements, insisting that raw nickel ore—critical for EV batteries—be processed domestically rather than exported raw, a policy the IMF’s Indonesia Article IV 2024 estimates could add $30–40 billion annually to GDP once downstream battery manufacturing scales.
| Dimension | Detail | Key Metric |
| Dimension | Detail | Key Metric |
| Model | South-South Cooperation | Ethiopia / Indonesia |
| NDB Capital Base | $10 billion paid-in capital (2024) | NDB Annual Report 2024 |
| NDB Project Approvals | $33B+ since inception | New Development Bank |
| Ethiopia Manufacturing Jobs | 100,000+ in 6 years | UNCTAD WIR 2024 |
| Indonesia Nickel Downstream | +$30–40B GDP potential | IMF Indonesia Art. IV 2024 |
| Source | UNCTAD, IMF, NDB | New Development Bank 2024 |
Conclusion: The Hybrid Imperative — Why the Winner Will Be the Nation That Masters Intelligent Economic Pluralism
The nations that will ascend to genuine economic superpower status over the next three decades will not be those that selected one model from this list and executed it faithfully. History is unambiguous on this point. South Korea combined export-led industrialization (Model 1) with aggressive human capital investment (Model 7) and targeted SEZ experimentation (Model 6). China fused all of these with South-South financing architecture (Model 10) and leapfrog digital infrastructure (Model 2). Singapore is essentially Models 6 and 7 in a city-state laboratory. The most sophisticated development economists at the IMF, the Brookings Institution, and Harvard’s Growth Lab all converge on the same conclusion: sequencing and contextual calibration matter as much as model selection.
What distinguishes tomorrow’s economic giants is not which blueprint they borrowed, but whether they possessed the institutional quality (Model 9) to implement it, the regional scale (Model 8) to amplify it, and the sovereign flexibility—freed from commodity dependence (Model 3) and Western conditionality (Model 10)—to adapt it without foreign veto. The nations on the cusp of this achievement today—India, Vietnam, Indonesia, Ethiopia, Morocco, Kenya—share a common denominator: they have all, consciously or pragmatically, begun assembling hybrid frameworks drawing from multiple models simultaneously.
The Harvard Growth Lab’s Atlas of Economic Complexity 2024 ranks economic complexity—the diversity and sophistication of a nation’s productive capabilities—as the single strongest predictor of future income growth. Economic complexity is itself the quantitative fingerprint of successful hybridization. The highest-complexity developing economies are precisely those that have refused to accept any single model’s constraints and instead built diversified productive ecosystems capable of competing across multiple global value chains simultaneously.
| 📊 Final Verdict: There is no single road to economic supremacy. But there is a consistent pattern among nations that travel it fastest: they think in systems, invest in people, protect institutions, and borrow selectively from every model that fits their unique endowments. The most dangerous development strategy is ideological purity. |
Frequently Asked Questions (FAQ Schema)
| What is the fastest-growing economic model for developing countries in 2025? Based on current IMF, World Bank, and McKinsey data, the services-led knowledge economy model (exemplified by India) and leapfrog digital development (exemplified by Kenya and Rwanda) are generating the fastest convergence toward high-income status in 2025. However, the highest sustained growth rates are recorded by nations combining export industrialization with deliberate human capital investment—Vietnam and Bangladesh are the most proximate examples in the current cycle. |
| Can developing nations realistically become the world’s biggest economy? Yes—and according to the IMF’s April 2025 World Economic Outlook, this is already occurring on a PPP-adjusted basis. India is projected to become the world’s third-largest nominal GDP economy by 2027. On a purchasing-power-parity basis, China already surpassed the United States in 2016. The structural fundamentals—demographic dividends, urbanization, technology diffusion, and institutional reform momentum—favour several developing nations ascending to the top tier of global economic power within 25 years. |
| What is leapfrog economics and how does it work for developing nations? Leapfrog economics is the theory that developing nations can bypass intermediate stages of technological and infrastructure development by adopting the latest generation of technology directly—skipping, for example, copper telephone networks in favour of immediate 5G deployment, or coal power grids in favour of solar microgrids. Kenya’s M-Pesa mobile money platform—which extended financial services to 40+ million people without a traditional bank branch network—is the paradigmatic global example. The economic benefit is both cost efficiency (newer technology is often cheaper than legacy systems) and speed of deployment. |
| What role does the BRICS economic trajectory play in developing nation growth? BRICS and its expanded BRICS+ grouping (now including Egypt, Ethiopia, UAE, Iran, and Saudi Arabia) plays an increasingly critical role in three distinct ways: first, as an alternative source of development finance through the New Development Bank ($33B+ in approvals) that carries lower conditionality than IMF/World Bank programmes; second, as a collective bargaining forum that amplifies developing-nation voices in IMF quota negotiations and WTO dispute resolution; and third, as an emerging architecture for de-dollarized trade settlement, which—if implemented at scale—would reduce developing nations’ vulnerability to U.S. Federal Reserve policy decisions and dollar-denominated debt crises. |
References & Data Sources
IMF World Economic Outlook, April 2025
- World Bank Open Data Portal
- World Bank AfCFTA Impact Assessment 2023
- IRENA Renewable Energy Outlook Africa 2023
- IEA Global Hydrogen Review 2024
- NASSCOM Strategic Review 2024
- McKinsey Global Institute Digital Reports
- Brookings Institution SEZ Analysis
- GSMA Mobile Economy Report 2024
- Harvard Growth Lab Atlas of Economic Complexity 2024
- OECD PISA 2022 Results
- World Justice Project Rule of Law Index 2024
- New Development Bank Annual Report 2024
- UNCTAD World Investment Report 2024
- Transparency International Corruption Perceptions Index
- ASEAN Secretariat Statistical Yearbook 2024
- Norges Bank Investment Management Annual Report 2024
- Goldman Sachs Global Investment Research – India Outlook 2024
Discover more from The Economy
Subscribe to get the latest posts sent to your email.


Antonoaldo Neves, Etihad Airways’ chief executive, took the helm with a singular, unsentimental mandate: strip away the vanity and chase the yield. The ghosts of the airline’s disastrous 2010s equity spending spree—a period defined by burning cash on doomed European carriers like Air Berlin and Alitalia—are finally exorcised. Today, from the polished concourses of the newly inaugurated Terminal A at Zayed International Airport, a quieter, deadlier calculus is taking shape. This week’s announcement of an Etihad European expansion—specifically adding Prague and Warsaw to its summer 2025 route map—is not merely about planting flags in foreign capitals. It is a calculated strike in the escalating air war over the global transit passenger.
The aviation landscape of the Arabian Gulf has fundamentally transformed since the pandemic. Abu Dhabi is no longer trying to outspend Dubai or out-fly Doha. Instead, it is playing a game of surgical precision.
Global passenger demand is currently testing the physical limits of airport infrastructure and aircraft leasing markets. According to the International Air Transport Association (IATA), Middle Eastern carriers posted a 10.8% year-on-year increase in international traffic midway through 2024. Yet, growth is bottlenecked by systemic delivery delays from both Boeing and Airbus, forcing airline executives to treat every available aircraft as an ultra-premium asset.
That said, Etihad remains remarkably unbothered by the macro-level chaos. Armed with a leaner fleet and a restructured balance sheet, the carrier is selectively targeting secondary European markets where legacy competitors are retreating or failing to meet surging point-to-point demand.
The Economics of Eastern Europe
Prague and Warsaw are not the glittering long-haul megahubs of London or Frankfurt. They are, however, formidable economic engines in their own right. By deploying Boeing 787 Dreamliners to these cities, Etihad is capturing a highly specific demographic. They are targeting affluent Eastern European tourists heading to Southeast Asia, alongside a rapidly growing cohort of corporate travellers facilitating trade between the Arabian Peninsula and the Visegrád Group.
Etihad new destinations are chosen through ruthless route profitability algorithms, not political prestige.
For years, passengers from Poland and the Czech Republic bound for Thailand, Vietnam, or the Maldives had to transit through Munich, Paris, or Amsterdam. This geographic inefficiency enriched Air France-KLM and the Lufthansa Group. Abu Dhabi is simply cutting out the middleman. By flying directly into these Eastern European capitals, Etihad captures the full fare premium while dramatically reducing the total travel time for the consumer.
The numbers justify the aggression. Passenger footfall between Eastern Europe and the United Arab Emirates has surged, driven by relaxed visa regimes and an influx of foreign direct investment. Reuters market data indicates that European outbound leisure travel has fully eclipsed 2019 levels, with premium cabin yields holding stubbornly high despite lingering inflationary pressures across the eurozone.
This is where the Neves strategy shines. He knows widebody aircraft are precious commodities in a supply-constrained world. You do not park a $250 million jet on the tarmac for nine hours at Heathrow if you can turn it around in two hours at Warsaw Chopin Airport. The asset utilisation rates on these mid-haul, six-hour European sectors are phenomenally efficient. They allow the aircraft to return to Abu Dhabi just in time to catch the midnight departure wave feeding traffic to Mumbai, Bangkok, and Sydney.
Reframing the Abu Dhabi Aviation Strategy
The obvious question requires a direct answer. Why is Etihad expanding its European network? Etihad is expanding its European network to capture underserved point-to-point premium leisure traffic and to feed its highly profitable Southeast Asian transit routes. This strategy bypasses congested Western European hubs while maximising the daily utilisation of its current widebody aircraft fleet.
That 43-word reality dictates every move the airline makes today.
The era of “The Residence”—the hyper-luxurious three-room suite in the sky that once defined the brand under former CEO James Hogan—is fading into aviation history. Today, the Abu Dhabi aviation strategy is defined by load factors, belly-hold cargo revenue, and operating margins.
The picture is more complicated when you look 130 kilometres up the road. Emirates, the colossus of Dubai, operates a fundamentally different model. Tim Clark built a machine designed to move the entire world through a single point using massive, high-density Airbus A380s. Qatar Airways, under the relentless drive of former chief Akbar Al Baker and his successor Badr Mohammed Al Meer, built an obsessive, high-frequency network that blankets the globe.
Etihad is choosing the middle path. It cannot match Emirates on pure volume, and it will not bleed cash to match Qatar on sheer connectivity.
What follows, however, is a masterclass in niche dominance. By targeting cities like Prague and Warsaw, Etihad avoids entering a financial bloodbath over landing slots at London Heathrow or Paris Charles de Gaulle. They are finding uncontested airspace. The Financial Times recently observed that mid-sized network carriers are currently posting the highest operating margins in the industry. They achieve this precisely because they are not forced to dump excess capacity on hyper-competitive trunk routes just to maintain market share.
Supply Chains and Sovereign Ambitions
This expansion ripples far beyond the departure gates of Eastern Europe. Downstream, the implications for European legacy carriers are severe.
Air France-KLM and the Lufthansa Group have historically relied on their Eastern European feeder networks to prop up the profitability of their long-haul Asian operations. When Middle East carriers Europe strategies shift toward these secondary cities, the European incumbents bleed high-yielding transit passengers. A Polish executive travelling to Singapore no longer needs to connect in Frankfurt; they can fly south to Abu Dhabi and connect east, often on newer aircraft and with superior service.
There is also the physical reality of the metal. The global aviation supply chain is severely fractured. Both Boeing and Airbus are missing delivery targets by months, and in some cases, years. Airlines are being forced to extend the leases of older, less fuel-efficient aircraft and cannibalise parts just to maintain their published schedules. Engine durability issues from manufacturers like Pratt & Whitney have grounded dozens of narrowbody jets globally.
In this hostile environment, launching two medium-haul destinations is a flex of operational reliability.
It signals to the market—and to the sovereign wealth funds backing the enterprise—that Etihad has secured the necessary lift to execute its “Journey 2030” growth mandate. The carrier plans to double its fleet to 150 aircraft and triple its passenger numbers to 33 million by the end of the decade. Adding routes is easy; flying them profitably when aircraft are scarce is the true test of management.
Every new European route also serves the broader geopolitical mandate of the UAE. Abu Dhabi is aggressively pivoting away from hydrocarbon dependency. Bloomberg Intelligence estimates that the broader tourism, logistics, and aviation sector now accounts for a rapidly growing percentage of the emirate’s non-oil GDP. Zayed International Airport capacity was built for exactly this moment. The glittering Terminal A, a $3 billion architectural marvel capable of handling 45 million passengers annually, needs humans to justify its existence. Prague and Warsaw are merely the latest tributaries feeding the river.
The Limits of the Desert Hub Model
Still, skepticism remains. The rapid scaling of Gulf carriers has historically triggered fierce protectionist backlash from European regulators and domestic airlines.
Can a region roughly the size of Scotland truly sustain three massive global aviation hubs operating within a 400-kilometre radius? Dissenting voices argue that the current yield environment is an anomaly, artificially inflated by post-pandemic revenge travel and constrained global capacity. Once Airbus and Boeing resolve their supply chain bottlenecks and flood the market with new jets, yields will inevitably soften.
“The Gulf carrier model is heavily reliant on a continuous, uninterrupted flow of global free trade and open borders,” notes a recent structural analysis by CAPA – Centre for Aviation. “As European states become increasingly protective of their environmental targets and domestic carriers, securing bilateral air rights for unlimited expansion will become exponentially more difficult.”
This is a structural vulnerability that cannot be ignored. European governments, spurred by Brussels, are imposing synthetic aviation fuel mandates and aggressive carbon taxes that disproportionately affect long-haul transit carriers. If Poland or the Czech Republic face pressure from the European Union to cap Gulf carrier frequencies on environmental grounds, the economics of these new routes collapse overnight. Lufthansa CEO Carsten Spohr has spent the better part of a decade lobbying for what he terms a “level playing field” against state-backed Gulf carriers.
Etihad’s smaller scale—its very advantage in agility—makes it susceptible to targeted price wars. If Emirates decides to drop a 500-seat A380 into Prague, or if Qatar Airways slashes fares out of Warsaw to protect its market share, Etihad lacks the immense financial shock absorbers of its neighbours to sustain a protracted war of attrition.
Closing the Loop on Legacy
The addition of Prague and Warsaw is a microcosm of modern aviation economics. It is not a story of flag-waving vanity, but of calculated, almost clinical efficiency. Etihad has learned the hardest lesson of the airline industry through bitter experience: prestige does not pay the fuel bill, and equity stakes in failing airlines do not buy loyalty.
By hunting in the geographic gaps left by European incumbents and avoiding the brutal crossfire of its larger Gulf neighbours, the airline is engineering a quiet, highly profitable resurrection. The battle for the global transit passenger is no longer being won solely on the flagship routes between London and Sydney. It is being fought, and won, in the margins.
Discover more from The Economy
Subscribe to get the latest posts sent to your email.

The confrontation usually happens behind closed glass doors in a bustling DIFC high-rise or a crowded Deira trading office. Voices rise, tempers fracture, and the ultimate corporate sanction is delivered in a single, heated sentence: “You are done—clear your desk.”
For the expatriate professional, the immediate aftermath is a cocktail of adrenaline and panic. In an economy where your residency, your bank accounts, and your family’s legal status are inextricably chained to your employment contract, a sudden dismissal is not just a career setback. It is an existential threat.
But legal reality in the Emirates operates on a strictly documented basis. If you are fired verbally in the UAE, the termination is effectively an illusion in the eyes of the state. The Ministry of Human Resources and Emiratisation (MoHRE) does not recognize heat-of-the-moment outbursts. They recognize paper, digital signatures, and registered post.
What follows is an examination of why the spoken word carries zero weight in UAE termination proceedings, and how the absence of a formal, written notice legally arms the employee while exposing the employer to severe financial penalties.
The Macro Landscape of UAE Labour Reform
To understand why documentation is treated with such uncompromising severity, one must look at the structural pivot the Emirates has executed over the past five years. The nation is aggressively transitioning from a transient, tax-free waystation into a permanent, highly regulated global knowledge economy.
This ambition requires a predictable, transparent legal framework. Foreign direct investment and top-tier global talent do not flow into jurisdictions where executives can be dismissed on a whim without procedural fairness. Recognizing this, the federal government entirely overhauled its labor architecture. On February 2, 2022, Federal Decree-Law No. 33 of 2021 came into effect, representing the most sweeping transformation of workplace regulations in the country’s history.
The new legal framework effectively dismantled the remnants of the old sponsorship mentalities, replacing them with fixed-term contracts and strict procedural mandates. It was designed by Minister of Human Resources Dr. Abdulrahman Al Awar to align the UAE with OECD labor standards, ensuring that both capital and labor operate on a balanced, predictable playing field.
A central pillar of this new framework is the formalization of the termination process. The state demands visibility into the ending of an employment relationship because that ending triggers a cascade of bureaucratic events: visa cancellations, the calculation of end-of-service gratuities, and the repatriation of foreign workers. When an employer attempts to bypass this with a verbal firing, they are not just breaking a corporate rule. They are disrupting the state’s regulatory apparatus.
The Core Development: Why the Spoken Word Fails
When examining the mechanics of dismissal, the primary question must be answered directly. Can an employer fire you without written notice in the UAE?
Under UAE Labour Law, an employer cannot legally fire you without written notice. A verbal dismissal is legally invalid and is heavily presumed by labour courts to be an “arbitrary dismissal.” To terminate a contract legally, the employer must provide formal written notice that explicitly states the reasons for termination, initiating the statutory notice period of 30 to 90 days.
This requirement is not a mere administrative suggestion. It is the absolute bedrock of the termination process.
If a manager tells you to leave the premises and not return, they have committed a critical procedural error. Without a written letter detailing the termination, the employment contract remains entirely active. You are still legally employed. Your salary continues to accrue. Your visa remains valid.
The danger for the employee in this scenario is accidental abandonment. If you take the verbal command at face value, pack your belongings, and stop coming to the office, the employer can legally pivot and accuse you of absconding. Under Article 50 of the Labour Law, unjustified absence for seven consecutive days allows an employer to terminate the contract without notice and potentially withhold end-of-service benefits.
This creates a perilous trap for the uninformed worker. The employer shouts a dismissal, the employee complies by staying home, and the employer then files an absconding report with MoHRE, framing the victim as the violator.
To neutralize this threat, the legally literate employee must force the issue into the written record. If dismissed verbally, you must immediately send an email to HR and upper management. The communication should be polite, strictly factual, and timestamped. It should state: “Following our conversation this morning where I was verbally instructed to leave the premises and end my employment, I am writing to request my formal, written notice of termination as required by UAE Labour Law, outlining the reasons for my dismissal and the start date of my notice period. Until I receive this, I remain ready and willing to fulfill my contractual duties.”
This single email shifts the entire legal burden back onto the company. It proves you have not absconded. It proves you are willing to work. And it creates a permanent digital paper trail that a labor court judge will rely upon when the dispute inevitably escalates.
The Analytical Layer: Arbitrary Dismissal and Compensation
Moving beyond the immediate mechanics of the firing, we must examine how UAE courts interpret a lack of documentation. The judicial system is remarkably consistent on this point: a failure to provide written notice is the fastest route to an employer losing a labor dispute.
When an employer terminates a contract without a valid, documented, and legally permissible reason, it qualifies as arbitrary dismissal under Article 47 of the law. The financial consequences for the company are severe.
If the labor court determines the dismissal was arbitrary—which a purely verbal firing almost guarantees—the employer can be ordered to pay up to three months of the employee’s total salary as compensation. This is entirely separate from, and in addition to, the standard end-of-service gratuity, pending unpaid salaries, and payment in lieu of the unserved notice period.
For a mid-level executive earning 40,000 AED a month, a careless verbal firing by a hot-headed manager can instantly create a legal liability of over 120,000 AED for the company, before even calculating standard severance.
The courts demand strict evidence of poor performance or gross misconduct to justify a termination. If the employer claims the verbal firing was the result of the employee’s incompetence, the court will demand to see the paper trail. Where are the written warnings? Where are the performance improvement plans? Under the UAE’s progressive disciplinary system, an employer must issue formal warnings before moving to termination.
A sudden, undocumented dismissal tells the court that no such disciplinary process occurred. It signals an impulsive, retaliatory, or discriminatory firing.
Yet, the legal landscape is not entirely uniform. The rules shift depending on your precise geographic jurisdiction within the Emirates. While the mainland operates strictly under MoHRE regulations, free zones like the Dubai International Financial Centre (DIFC) and Abu Dhabi Global Market (ADGM) operate their own English common law court systems.
The DIFC Employment Law (Law No. 2 of 2019) is similarly strict regarding written documentation, but it removes the specific concept of “arbitrary dismissal” compensation in favor of strict contractual adherence and a mandatory penalty for late payment of final settlements. Regardless of the zone, the universal truth remains: verbal instructions to leave the company are legally toxic.
Downstream Consequences: Visas, Banking, and Survival
The insistence on written notice extends far beyond the walls of the HR department. In the UAE, your employment contract is the central node of your financial and social existence. Severing it has immediate, profound downstream effects.
First is the matter of banking. UAE financial institutions are notoriously swift to act when an employment relationship ends. Under the terms of most personal loans, car loans, and credit cards in the Emirates, the bank holds a lien on the employee’s end-of-service gratuity. When a company eventually processes a final settlement, it is legally obligated to mark the transfer as a “final payment.”
This coding acts as an automated tripwire for the bank. If you have outstanding debt, the bank may instantly freeze your accounts to secure the funds, demanding proof of a new job before releasing the capital. A verbal firing delays and confuses this entire process. If you are locked in a multi-month labor dispute over a verbal dismissal, your salary stops arriving, but your final settlement is delayed by litigation. This leaves the expatriate in a financial vacuum, unable to service local debt and at risk of criminal bounced-cheque cases.
Second is the visa grace period. Historically, losing your job in the UAE meant you had exactly 30 days to exit the country or find new employment. The resulting panic often forced highly skilled workers to accept substandard jobs simply to maintain their residency.
The government explicitly recognized this as a drag on economic stability. Recent reforms have fundamentally changed the residency landscape. Today, depending on your skill tier, reforms implemented by the UAE cabinet allow grace periods of up to 180 days after a visa is officially cancelled.
But this grace period only begins when the visa is legally cancelled by MoHRE, a process that requires a formal, signed termination and a signed settlement document. A verbal firing leaves the employee in bureaucratic purgatory. You cannot start a new job because your current visa is still active. You cannot access the 180-day grace period because you haven’t been legally terminated. You are a ghost in the system.
This is why compelling the employer to issue a written termination letter is the vital first step. It starts the clock. It triggers your legal entitlements. It forces the bureaucratic gears to turn, allowing you to transition your visa, secure your funds, and remain in the country legally while you plot your next move. According to recent demographic data, expatriates make up over 88% of the UAE’s population, and ensuring their frictionless transition between roles is a stated macroeconomic priority for federal policymakers.
The Employer’s Defense: Burden and Reality
To present a complete picture, we must examine the reality from the employer’s perspective. Why do verbal firings still happen in a jurisdiction that punishes them so severely?
The defense often centers on the administrative burden placed upon small and medium enterprises (SMEs). In a fast-paced trading environment or a high-turnover retail business, managers often view the strict procedural requirements of MoHRE as incompatible with the daily realities of running a business.
When an employee commits a serious breach of trust—perhaps suspected theft, violent behavior, or catastrophic negligence—the immediate instinct of a business owner is to remove the threat from the premises. Drafting formal letters, initiating 30-day notice periods, and scheduling HR meetings feels agonizingly slow when the business is actively bleeding capital or facing reputational damage.
Legal advocates for employers argue that the current system is occasionally exploited by underperforming employees. A poorly performing worker who knows the law can sometimes weaponize the procedural requirements, using a minor technical misstep by the employer—like a verbal outburst by a stressed manager—to extract an arbitrary dismissal settlement.
That said, the law does provide an escape valve for employers in genuine crisis. Article 44 of the Labour Law outlines ten specific scenarios where an employer can terminate an employee instantly, without notice and without end-of-service benefits. These include submitting forged documents, failing to perform basic duties despite written warnings, revealing corporate secrets, or being found drunk at work.
Crucially, however, even an Article 44 dismissal requires a written investigation and a formal letter stating exactly which clause the employee violated. The state grants the employer the power to fire instantly for gross misconduct, but it refuses to waive the requirement for a written record.
Furthermore, courts are highly skeptical of Article 44 dismissals. Employers who attempt to use it to bypass notice periods often find themselves brutally cross-examined by labor judges. If the employer fails to provide an airtight, documented investigation proving the gross misconduct, the court will automatically revert the case to an arbitrary dismissal, handing the victory to the employee.
The burden of proof rests entirely on capital, not labor. In a region historically criticized by international rights organizations for favoring corporate power, the contemporary UAE labor court is surprisingly, structurally biased toward the worker when documentation is absent.
Synthesis: The Value of the Paper Trail
The UAE’s labor market has matured at a staggering pace. It has evolved from a deeply asymmetrical system into a highly codified, internationally competitive legal arena. In this modern landscape, verbal instructions regarding employment status are not just unprofessional; they are legally non-existent.
For the employer, yielding to anger and verbally dismissing a worker is an unforced error that invites catastrophic financial penalties and protracted litigation. It turns a simple staffing change into an arbitrary dismissal claim that the company is mathematically likely to lose.
For the employee, understanding this framework is the ultimate shield against corporate abuse. The moment a manager attempts to end your livelihood with spoken words, the power dynamic actually inverts. By refusing to abscond, calmly demanding written notice, and maintaining a meticulous digital trail, the worker traps the careless employer in the strict machinery of federal law. In the UAE, the loudest voice in the room never wins the labor dispute. The victor is always the one holding the paperwork.
Discover more from The Economy
Subscribe to get the latest posts sent to your email.
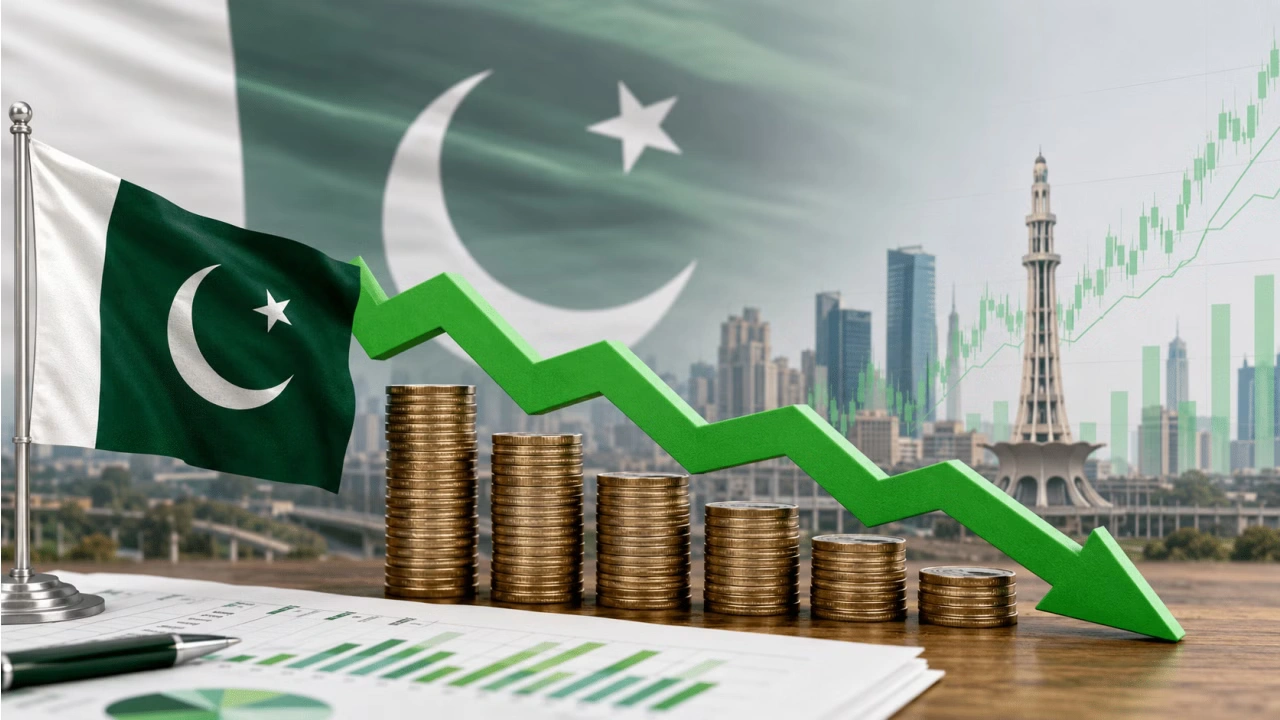
Islamabad’s fiscal arithmetic for 2026-27 tells two stories at once. One is a government insisting the worst of the inflation crisis has passed, with growth ticking back toward 4%. The other is a security state absorbing more than Rs3 trillion in defence outlays, its largest allocation on record, against a regional backdrop still rattled by the Iran-Israel-US conflict that erupted in February. Finance Minister Muhammad Aurangzeb presented both numbers in the same breath, and that juxtaposition is the story.
A Budget Shaped by War, Reserves, and the IMF
Pakistan’s FY27 budget didn’t emerge in a vacuum. It was drafted while an IMF mission led by Iva Petrova was still in Islamabad picking through the numbers, and while the State Bank was nursing reserves that had only just climbed back toward $17 billion after years of near-default anxiety. The IMF’s Executive Board completed the third review of Pakistan’s Extended Fund Facility arrangement and the second review of its Resilience and Sustainability Facility on May 8, 2026, releasing roughly $1.1 billion and $220 million respectively, and bringing total disbursements under the two programmes to about $4.8 billion.
That context matters because it’s the IMF’s framework, more than domestic politics, that has shaped the headline targets. Pakistan’s economy grew 3.7% in FY2025-26, up from 3.2% in FY2024-25, with nominal GDP reaching Rs126.9 trillion ($452.1 billion) and per capita income rising to $1,901. The FY27 numbers are calibrated against that base, with the government betting that a fragile recovery can be nursed along without breaking the fiscal discipline Washington has demanded.
Section 1: The Numbers Behind Pakistan’s FY27 Budget
The Pakistan FY27 budget sets out a GDP growth target of 4%, up from an estimated 3.7% this year, alongside an inflation projection of 8.2%. The budget deficit is projected at 3.6% of GDP, with the government aiming for a primary surplus of 2% of GDP and a federal deficit of Rs7.02 trillion. Those are not small ambitions for a country that, less than three years ago, was weeks away from default.
The revenue side carries the heaviest lift. The Federal Board of Revenue has been handed a tax collection target of Rs15.26 trillion for FY27, an increase of more than 8% from Rs14.13 trillion in the outgoing year. That’s a number the IMF effectively wrote into the programme months ago, and it leaves little room for the kind of populist tax relief that often appears in election-adjacent budgets.
Then there’s defence. Defence spending has been raised to over Rs3 trillion for FY27, up from Rs2.56 trillion last year, with Aurangzeb telling parliament that “defence spending has been increased considerably to make the country invincible due to the uncertainty in the region.” It’s the second consecutive year of double-digit increases to the military budget — last year’s allocation itself had jumped sharply after the brief but intense conflict with India in May 2025.
Development spending, by contrast, has been held tight. The federal Public Sector Development Programme has been set at roughly Rs1 trillion, with provincial Annual Development Programmes adding a further Rs2.2 trillion, taking the national development outlay to about Rs3.7 trillion. Social protection got a modest boost: the Benazir Income Support Programme allocation rises to Rs838 billion, up 17% from last year, with coverage extended to 12 million families.
Section 2: What Does Pakistan’s Rs3 Trillion Defence Budget Actually Mean?
Pakistan’s defence budget for 2026-27 isn’t just a line item — it’s a statement about how the security establishment views the regional environment, and about where the civilian government’s bargaining power ends. At over Rs3 trillion, defence spending now equals roughly 2.1% of GDP, up from 2.03% in the FY26 revised estimate. On paper that’s a modest shift in the ratio. In rupee terms, though, it’s an 18% jump in a single year, layered on top of the 20% increase the previous government approved after the May 2025 clashes with India.
What is Pakistan’s GDP growth target for FY27? Pakistan has set a GDP growth target of 4% for fiscal year 2026-27, up from an estimated 3.7% in the outgoing year. The target rests on sectoral projections of 3.6% growth in agriculture, 4.5% in industry, and 4.2% in services — all modest accelerations from FY26 outturns.
The defence allocation didn’t arrive in isolation, either. Aurangzeb framed it alongside a diplomatic flourish: he lauded the role of Pakistan’s armed forces, calling them a source of foreign exchange earnings, and described the strategic defence agreement between Pakistan and Saudi Arabia as “a moment of pride,” adding that Pakistan would “always steadfastly stand alongside KSA.” That’s not boilerplate. It’s a budget speech doing double duty as a signal to Riyadh, to New Delhi, and to a domestic audience that has spent a year absorbing the costs of a conflict most Pakistanis didn’t choose.
What’s harder to square is how a government under an IMF primary-surplus mandate finds room for both a record defence bill and a 14% jump in core tax collection without squeezing development spending into irrelevance. The answer, so far, appears to be: it doesn’t fully square. The Rs1 trillion federal PSDP is essentially flat in real terms once 8.2% inflation is stripped out — meaning roads, dams, and digital infrastructure projects are being asked to do the same job with less purchasing power than last year.
Section 3: Markets, the IMF, and the Citizen’s Wallet
The immediate audience for this budget isn’t really the Pakistani public — it’s the IMF board, which has another review scheduled for the second half of 2026. An IMF mission led by Iva Petrova concluded a staff visit to Islamabad on May 20, 2026, focused specifically on “the FY2027 budget formulation, and progress on the reform agenda under the Extended Fund Facility (EFF) and the Resilience and Sustainability Facility (RSF),” with the next full review mission expected later this year. If Islamabad’s numbers diverge too sharply from what was discussed in those meetings, the budget could become a negotiating problem before it’s even fully implemented.
For markets, the signal is broadly reassuring — at least on paper. A fourth consecutive primary surplus, a stated commitment to fiscal consolidation, and a tax target that’s already been pre-cleared with the Fund all point toward continuity rather than rupture. The State Bank’s decision to raise its policy rate by 100 basis points to 11.5% in April, the first hike since June 2023, suggests the central bank is already pricing in the inflationary drag from higher global oil prices since the Middle East war began.
For ordinary citizens, the picture is more complicated. The budget does carve out some relief for salaried workers, with income tax rates cut across several brackets — for instance, the rate on annual salaries between Rs3.2 million and Rs4.1 million falls to 25% from 30%, and the bracket from Rs4.1 million to Rs5.6 million drops to 29% from 35%. But with inflation forecast at 8.2% — itself a figure many independent economists consider optimistic — those gains could be eaten up quickly if energy and food prices track anywhere near the trajectory seen since the conflict began.
Energy remains the wildcard that could unravel the whole framework. Circular debt in the power sector alone sits close to Rs1.84 trillion even after a major bank refinancing facility, and the combined energy sector shortfall — including gas — has reportedly climbed past Rs5 trillion. Any subsidy reintroduced to cushion consumers from cost-reflective tariffs would directly threaten the 2% primary surplus target the entire IMF arrangement is built around.
Section 4: Not Everyone Buys the Optimism
The government’s framing — 4% growth, 8.2% inflation, a primary surplus locked in for a fourth straight year — assumes the Middle East conflict’s economic fallout stays contained. Not every economist agrees that’s the safer bet.
Dr Hafiz Pasha’s recent analysis places FY27 growth at just 2.5% against the government’s 4% and the IMF’s earlier 3.5% baseline, inflation at 12% against the official 8.2%, and the current account deficit at $10 billion rather than the roughly $4 billion implied by Fund projections — with reserves declining rather than continuing to build. The gap between these scenarios isn’t academic. If Pasha’s stress case is closer to reality, the tax revenue assumptions underpinning the entire budget — that 14% jump in FBR collections — become much harder to deliver, and the primary surplus the IMF is counting on could evaporate.
Even the IMF’s own staff report, published in mid-May, hedged its bets. The Fund’s third review noted that GDP growth had accelerated in the first half of FY26 and the current account was broadly balanced, but acknowledged that “the impact of the war in the Middle East clouds Pakistan’s near-term outlook and there is great uncertainty about how developments will unfold.” That report was written before the worst of the oil-price shock had fully filtered through to Pakistan’s import bill — and the gap between that baseline and the budget presented weeks later suggests the government chose to project confidence rather than caution. Whether that confidence survives contact with a second IMF review later this year is an open question that won’t be settled by a budget speech, however carefully worded.
The Bigger Picture
What Pakistan’s FY27 budget really reveals is a government trying to hold two contradictory commitments at once: a security posture that demands ever-larger defence outlays in a volatile region, and an IMF programme that demands fiscal restraint as the price of continued solvency. For now, both demands have been met — on paper, through a combination of aggressive tax targets, modest development spending, and a growth forecast that several independent economists consider generous. The real test arrives not in parliament, where the budget will pass with the government’s majority, but in the months ahead, when oil prices, energy subsidies, and the next IMF mission will decide whether 4% growth and 8.2% inflation were a forecast — or a wish.
Discover more from The Economy
Subscribe to get the latest posts sent to your email.

The Pragmatic Pivot: Etihad European Expansion Signals New Strategy

Can You Be Fired Verbally in the UAE? The Legal Reality

Pakistan’s FY27 Budget Bets on 4% Growth While Defence Spending Crosses Rs3 Trillion

Isme Tells Government to Redirect FDI Funding Towards Irish Entrepreneurs

Asia Energy Crisis Hits ‘Worst-Case Scenario’ as ADB Warns of Structural Collapse

The Automated Authority: Inside the KPMG AI Report Hallucination Scandal

Hong Kong Bank Accounts for Mainland Residents: Capital Flight Surge

Pakistan’s AI moment: Rs9bn prescription for a structural problem

SpaceX IPO: Musk Raises $75bn in History’s Largest Listing

Tightrope Walk: Pakistan Unveils Crucial FY2026-27 Federal Budget Today

Public Debt Bond Markets: Why Investors Learned to Love Debt

Xponential Fitness Franchise Lawsuit: The $3.97M Judgment

UK Labour Productivity: Are We Finally Seeing a Rebound?

UK Stablecoin Regulation: Can Britain Catch Up?

China Overhauls the World’s Biggest Surveillance Network with Advanced AI

Kevin Warsh Takes the Fed’s Helm — and Walks Straight Into a Rate-Hike Storm

McKinsey’s Post-AI Pay Reckoning: Why Partners Face Cash Cuts in a Radical Compensation Overhaul

S&P 500 Slips Back to 7,408 as Oil Storms Past $109, Bond Yields Clock 19-Year Highs

SpaceX, OpenAI & Anthropic IPOs: Wall Street’s $200B AI Test

SpaceX IPO: Inside the $2 Trillion Market Debut

How AI Is Forcing McKinsey and Its Peers to Rethink Pricing

SpaceX IPO Set to Lock In Musk’s Control With Mars-Linked Pay Deal

KPMG Australia CEO Resigns After Whistleblower Claims Exposed Investigation Failures

Why Selling Persists at the PSX as the US-China Stalemate on Iran Deepens Market Jitters

The Guardrails Are Down: How Meta and Google’s AI Models Fold Under Pressure

Broadcom Market Value Loss: Revenue Forecast Disappoints

Cerebras IPO: The Wafer-Scale AI Challenger That Just Priced at $185 — and Why the Market Is Betting It Can Crack Nvidia’s Fortress

Pakistan Budget FY 2026-27: Relief, Prospects, and the Tightrope Walk
-

 Markets & Finance5 months ago
Top 15 Stocks for Investment in 2026 in PSX: Your Complete Guide to Pakistan’s Best Investment Opportunities
-

 Analysis4 months ago
Top 10 Stocks for Investment in PSX for Quick Returns in 2026
-

 Analysis4 months ago
Brazil’s Rare Earth Race: US, EU, and China Compete for Critical Minerals as Tensions Rise
-

 Banks5 months ago
Best Investments in Pakistan 2026: Top 10 Low-Price Shares and Long-Term Picks for the PSX
-

 Investment5 months ago
Top 10 Mutual Fund Managers in Pakistan for Investment in 2026: A Comprehensive Guide for Optimal Returns
-

 Analysis4 months ago
Johor’s Investment Boom: The Hidden Costs Behind Malaysia’s Most Ambitious Economic Surge
-

 Global Economy6 months ago
15 Most Lucrative Sectors for Investment in Pakistan: A 2025 Data-Driven Analysis
-

 Global Economy6 months ago
Pakistan’s Export Goldmine: 10 Game-Changing Markets Where Pakistani Businesses Are Winning Big in 2025