
Analysis
Top 10 Economic Models for Developing Nations to Adopt and Succeed as the Biggest Economy
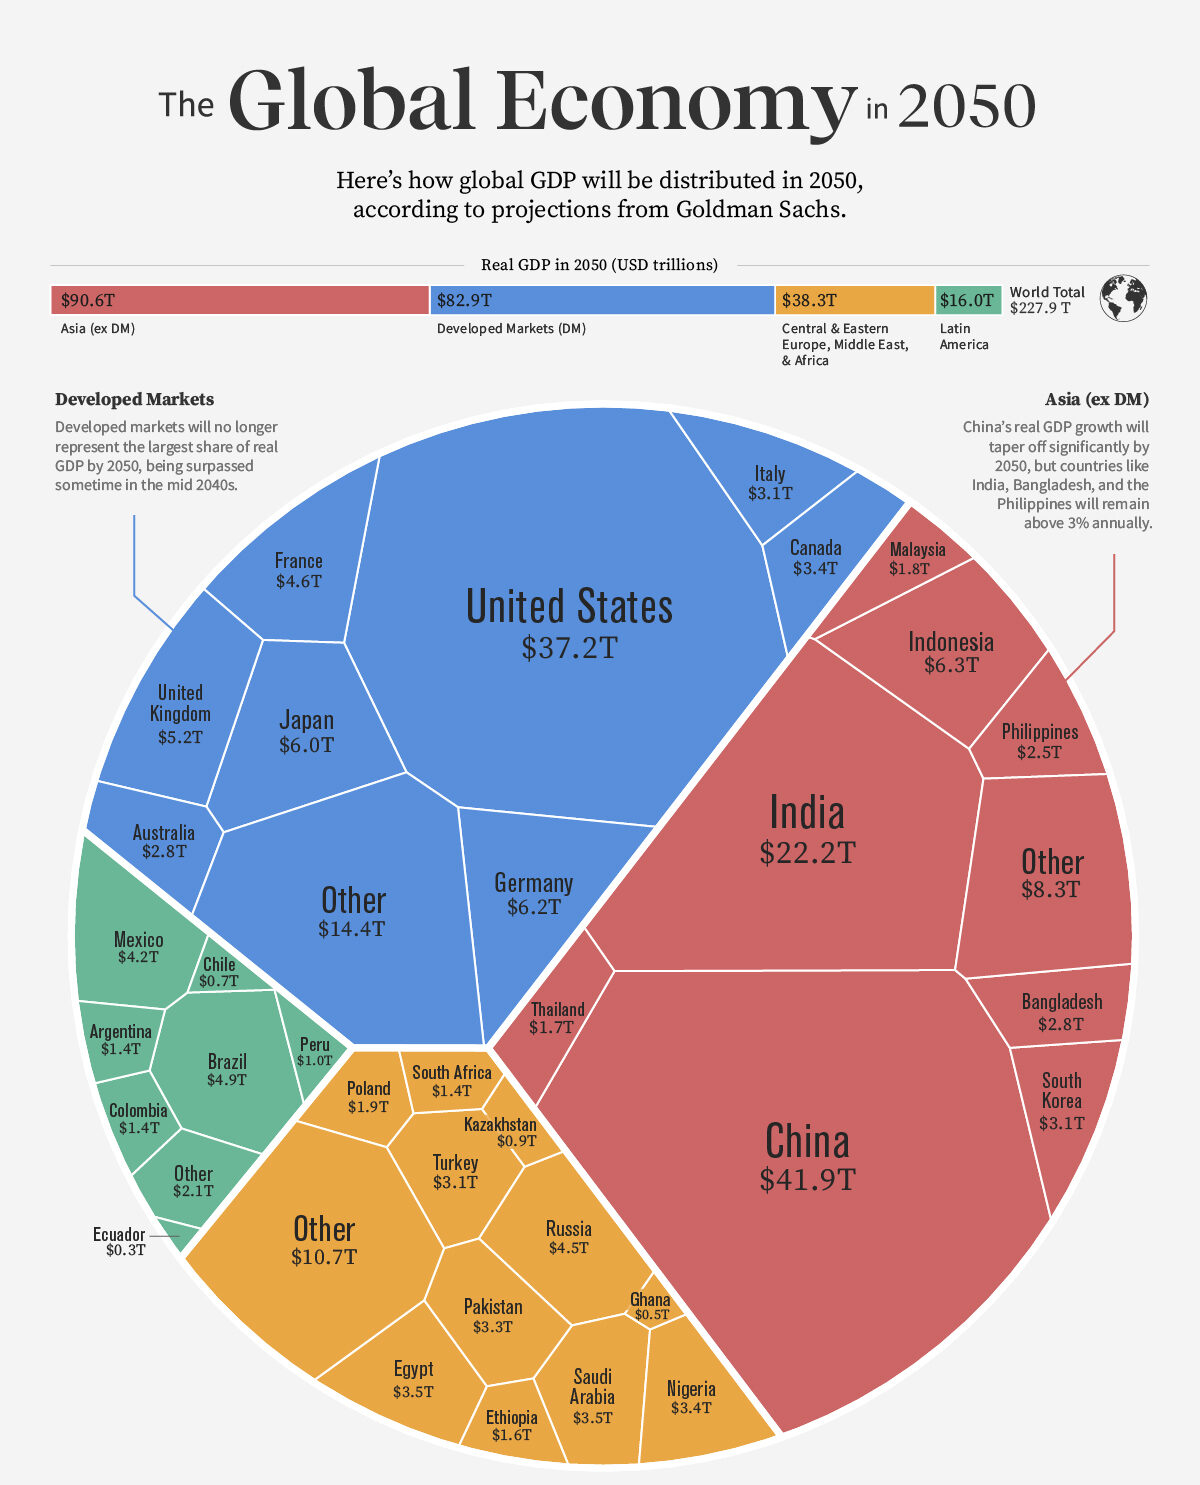
The $100 Trillion Question: Who Will Own the Next Era of Global Economic Power?
The numbers are no longer a forecast—they are a verdict. According to the IMF’s World Economic Outlook (April 2025), emerging and developing economies now account for approximately 59% of global GDP measured in purchasing-power-parity terms, a tectonic shift from 44% in 2000. Yet the spoils of this growth remain grotesquely uneven. A handful of nations are sprinting toward genuine economic superpower status, while dozens of others remain mired in the structural traps—commodity dependence, institutional fragility, capital flight, and the middle-income ceiling—that have historically foreclosed their ambitions.
The question facing every finance minister, central banker, and development economist today is brutally direct: which blueprint do you choose? History has proven there is no universal panacea. The Washington Consensus—that rigid cocktail of privatization, deregulation, and fiscal austerity—generated growth in some contexts and catastrophe in others. The state-led developmental model of East Asia created economic miracles but also sovereign debt crises. Green industrialization looks compelling on paper until grid reliability becomes a crisis.
What follows is a rigorous, data-driven examination of the ten most powerful economic development models available to policymakers today. Each is assessed through the lens of real-world implementation, empirical outcomes, geopolitical viability, and long-run sustainability. The conclusion, reinforced by the evidence, is unambiguous: the nations that will ascend to the apex of the global economy in the 21st century will not be those that followed a single doctrine—they will be those that mastered the art of intelligent hybridization.
| 📊 Key Insight: Nations that reached upper-middle income status fastest between 2000–2024 averaged 3.2 more institutional reforms per decade than their peers, per World Bank Governance Indicators data. |
| MODEL 01 OF 10 · CORE FRAMEWORK: INDUSTRIAL POLICY & EXPORT-LED GROWTH |
1. The East Asian Export-Industrialization Engine: Manufacturing Supremacy Through Deliberate State Choreography
Core Thesis
No development model has generated wealth faster, at greater scale, or more reproducibly than export-led industrialization. The fundamental logic is elegant: rather than producing exclusively for a small domestic market constrained by low incomes, a nation leverages its comparative advantages—abundant labour, strategic location, undervalued currency—to integrate into global value chains and capture foreign demand. The state does not merely step aside; it actively choreographs industrial champions, negotiates market access, directs credit, and manages the exchange rate with surgical precision. The emerging market economic strategy here is not laissez-faire—it is disciplined mercantilism in a globalized wrapper.
Real-World Exemplar: South Korea & Vietnam
South Korea’s trajectory from a per-capita GDP of roughly $1,200 in 1965 to over $33,000 today is one of the most studied developmental arcs in modern economics. The World Bank’s Korea Development Overview documents how successive Five-Year Plans coordinated between the state and the chaebol conglomerates—Samsung, Hyundai, LG—compressed industrial transitions that took Europe and America a century into three decades. Vietnam has since replicated this playbook in miniature: World Bank Vietnam data shows exports grew from 46% of GDP in 2000 to over 93% in 2023, propelling manufacturing-led growth averaging 6.4% annually.
The Evidence
| Dimension | Detail | Key Metric |
| Model | Export-Led Industrialization | East Asian Development State |
| Case Country | Vietnam (2000–2023) | South Korea (1965–1995) |
| GDP Growth CAGR | ~6.4% annually | ~8.1% annually |
| Poverty Reduction | 72% → 4.8% headcount | 80%+ → sub-5% headcount |
| Export / GDP Ratio | 93% (2023) | Grew from 3% to 40% |
| Key Enabler | FDI + SEZs + Education | State-directed credit + POSCO |
| Source | World Bank Open Data | IMF Working Papers |
| MODEL 02 OF 10 · CORE FRAMEWORK: LEAPFROG ECONOMICS & DIGITAL-FIRST DEVELOPMENT |
2. Leapfrog Economics: How Digital Infrastructure Lets Developing Nations Skip Entire Industrial Eras
Core Thesis
Leapfrog economics posits that developing nations are not condemned to recapitulate every stage of industrial evolution that wealthy nations traversed. A country need not build copper telephone networks if it can deploy LTE and 5G directly. It need not construct coal-fired baseline power if solar microgrids can deliver electricity to rural households at lower levelized cost. The strategic implication is transformative: rather than playing catch-up, a nation can arrive at the technological frontier first, unburdened by legacy infrastructure or incumbent lobbying. This is arguably the most exciting—and underutilized—sustainable growth model for developing nations in the current decade.
Real-World Exemplar: Rwanda & Kenya
Rwanda’s Vision 2050 explicitly deploys leapfrog theory as national strategy. The IMF Rwanda Article IV Consultation (2024) notes that ICT now contributes approximately 3.5% of GDP and growing, while mobile money penetration exceeds 40% of adults—bypassing the need for traditional bank branch networks. Kenya’s M-Pesa story is perhaps the paradigmatic leapfrog case: over 65% of Kenya’s GDP flows through the platform annually, according to GSMA Intelligence data, creating financial inclusion at a velocity no conventional banking expansion could have achieved.
| Dimension | Detail | Key Metric |
| Dimension | Detail | Key Metric |
| Model | Leapfrog / Digital-First | Mobile-led financial inclusion |
| Case Country | Kenya / Rwanda | 2010–2024 |
| GDP Impact (Digital ICT) | +3.5% of GDP (Rwanda) | McKinsey: +$300B SSA potential |
| Mobile Money Penetration | 65%+ GDP via M-Pesa (Kenya) | GSMA 2024 |
| Cost vs. Traditional Banks | 60–80% cheaper delivery | CGAP / World Bank 2023 |
| Source | IMF, McKinsey Global Institute | GSMA Intelligence |
| MODEL 03 OF 10 · CORE FRAMEWORK: NATURAL RESOURCE SOVEREIGN WEALTH CONVERSION |
3. The Resource Curse Antidote: Sovereign Wealth Fund Architecture and the Norwegian / Gulf Pivot
Core Thesis
For resource-rich developing nations, the greatest economic threat is not scarcity but abundance. The ‘resource curse’—the paradox whereby commodity wealth correlates with slower growth, weaker institutions, and greater inequality—is empirically documented across dozens of cases, from Nigeria to Venezuela. The corrective model is institutional: create a sovereign wealth fund that sequesters commodity revenues, insulates the domestic economy from Dutch Disease currency appreciation, and invests proceeds in diversified global assets that generate perpetual returns after the resource is exhausted. The BRICS economic trajectory increasingly incorporates this framework as member states seek to convert finite natural capital into enduring financial capital.
Real-World Exemplar: Norway & Botswana
Norway’s Government Pension Fund Global—managed by Norges Bank Investment Management—surpassed $1.7 trillion in assets under management in 2024, equivalent to approximately $325,000 per Norwegian citizen. The Norges Bank Investment Management Annual Report 2024 shows that the fund’s equity portfolio alone generated a 16.1% return in 2023. Botswana offers the developing-nation proof-of-concept: the Pula Fund, established in 1994, channeled diamond revenues into diversified reserves, enabling counter-cyclical fiscal policy and maintaining investment-grade credit ratings across commodity cycles—a rare achievement in Sub-Saharan Africa, per IMF Botswana Article IV 2024.
| Dimension | Detail | Key Metric |
| Dimension | Detail | Key Metric |
| Fund | Norway GPFG | Botswana Pula Fund |
| AUM (2024) | $1.7 trillion | ~$5.5 billion |
| Per-Capita Value | ~$325,000 / citizen | ~$2,200 / citizen |
| 2023 Return | 16.1% | Diversified portfolio return |
| Credit Rating Preserved? | AAA | Investment Grade |
| Source | NBIM Annual Report 2024 | IMF, Bank of Botswana |
| MODEL 04 OF 10 · CORE FRAMEWORK: SERVICES-LED GROWTH & KNOWLEDGE ECONOMY |
4. The Services Leapfrog: From Agricultural Subsistence to a Knowledge Economy Without a Manufacturing Middle
Core Thesis
India’s development trajectory has confounded classical economists who assumed manufacturing must precede services. India essentially skipped the textile-and-steel phase that defined British and American industrialization, catapulting directly into high-value software, business process outsourcing, and—most recently—global capability centres and AI engineering hubs. Services-led growth is now a credible emerging market economic strategy precisely because digital services are tradeable at scale, require relatively modest physical capital investment, and can generate high-wage employment disproportionately concentrated among educated urban populations.
Real-World Exemplar: India & the Philippines
India’s technology and services exports surpassed $290 billion in fiscal year 2023-24, according to NASSCOM Strategic Review 2024. The IMF’s India Article IV Consultation 2024 projects India as the world’s third-largest economy by 2027, propelled heavily by services sector productivity growth averaging 8.2% annually over the preceding decade. The Philippines, meanwhile, demonstrates that BPO-led services growth can generate 1.3 million high-skill jobs and $38 billion in annual remittances-equivalent service receipts.
| Dimension | Detail | Key Metric |
| Dimension | Detail | Key Metric |
| Model | Services & Knowledge Economy | India / Philippines 2000–2024 |
| Tech/Services Exports | $290B+ (India FY24) | NASSCOM 2024 |
| Services GDP Share | ~55% of India’s GDP | World Bank 2024 |
| Wage Premium | IT jobs: 4–8× median wage | ILO Labour Statistics |
| Projected GDP Rank | #3 globally by 2027 | IMF WEO April 2025 |
| Source | IMF, NASSCOM, Goldman Sachs | Global Investment Research 2024 |
| MODEL 05 OF 10 · CORE FRAMEWORK: GREEN INDUSTRIALIZATION & CLIMATE ECONOMY |
5. Green Industrialization: Turning the Climate Crisis Into the Greatest Development Opportunity of the 21st Century
Core Thesis
For nations that have not yet built their energy infrastructure, the climate crisis is not merely a threat—it is a once-in-a-century development opportunity. The economics of renewable energy have undergone a structural transformation since 2015 that is nothing short of revolutionary: the levelized cost of solar PV has declined approximately 90% over the past decade, according to the International Renewable Energy Agency (IRENA). Nations that build their industrial base on cheap, abundant renewable energy will enjoy structural competitive advantages in energy-intensive manufacturing for generations. Moreover, the emerging global carbon border adjustment mechanism—particularly the EU’s CBAM—effectively penalizes high-carbon production, creating a first-mover advantage for nations that industrialize green from the outset.
Real-World Exemplar: Morocco & Chile
Morocco’s Noor Ouarzazate complex—at 580MW one of the world’s largest concentrated solar power installations—is the cornerstone of an industrial strategy that targets 52% renewable electricity by 2030, per IRENA’s Africa Renewable Energy Outlook 2023. Morocco now exports clean electricity to Europe via sub-sea cable and is positioning itself as a green hydrogen exporter—a market the IEA Global Hydrogen Review 2024 values at potentially $200 billion annually by 2030. Chile, with the Atacama Desert’s irradiation levels producing solar electricity at under $20/MWh, has become a natural laboratory for green copper smelting—critical for the EV supply chain.
| Dimension | Detail | Key Metric |
| Dimension | Detail | Key Metric |
| Model | Green Industrialization | Morocco / Chile 2015–2030 |
| Solar Cost Decline | ~90% since 2015 | IRENA 2024 |
| Morocco Renewable Target | 52% by 2030 | Ministry of Energy Morocco |
| Green H₂ Market Value | $200B/yr by 2030 (potential) | IEA Hydrogen Review 2024 |
| Chile Solar LCOE | <$20/MWh (Atacama) | BNEF Clean Energy Index |
| EU CBAM Impact | 15–35% tariff on high-carbon goods | European Commission 2024 |
| Source | IRENA, IEA, BNEF | European Commission |
| MODEL 06 OF 10 · CORE FRAMEWORK: SPECIAL ECONOMIC ZONES & INSTITUTIONAL EXPERIMENTATION |
6. Special Economic Zones as Laboratories of Capitalism: China’s SEZ Blueprint for the Developing World
Core Thesis
One of the most powerful tools in the developmental state’s arsenal is the Special Economic Zone—a geographically bounded area where a nation effectively runs a different, more market-friendly regulatory regime than the broader domestic economy. SEZs allow governments to attract FDI, build export capacity, and test institutional reforms without requiring political consensus for nationwide liberalization. The evidence base is extensive. The World Bank’s 2024 report on SEZs globally documented over 5,400 active zones across 147 countries, generating combined exports exceeding $3.5 trillion annually.
Real-World Exemplar: China’s Shenzhen & Rwanda’s Kigali SEZ
Shenzhen’s transformation from a fishing village of 30,000 people in 1979 to a metropolitan economy of 13 million generating GDP equivalent to a mid-sized European nation within a single generation is the most dramatic example of deliberate institutional engineering in modern history. The Brookings Institution’s analysis of China’s SEZ model attributes Shenzhen’s success to the unique combination of preferential tax regimes, streamlined customs, and—critically—de facto property rights protections that did not exist in the rest of China at the time. Rwanda’s Kigali SEZ, while embryonic by comparison, has attracted 30+ international firms since 2011 and is deliberately modelled on Singapore’s Jurong Industrial Estate.
| Dimension | Detail | Key Metric |
| Dimension | Detail | Key Metric |
| Model | Special Economic Zones (SEZs) | China / Rwanda |
| Global SEZ Count | 5,400+ active zones | World Bank 2024 |
| Global SEZ Exports | $3.5 trillion annually | World Bank SEZ Report 2024 |
| Shenzhen GDP Growth | From $0.3B (1980) to $490B+ (2023) | CEIC / China NBS |
| Kigali SEZ Investment | 30+ multinationals attracted | Rwanda Development Board |
| Source | World Bank, Brookings | CEIC, Rwanda Dev. Board |
| MODEL 07 OF 10 · CORE FRAMEWORK: HUMAN CAPITAL & TALENT-LED GROWTH STRATEGY |
7. The Singapore Theorem: Why Human Capital Investment Is the Highest-Return Asset Class in Development Economics
Core Thesis
Lee Kuan Yew famously observed that Singapore’s only natural resource is its people. The meticulous, systematic cultivation of human capital—through elite technical education, continuous workforce retraining, immigration of specialized talent, and ruthless meritocracy in public sector staffing—transformed a malarial swamp into the world’s fourth-largest financial centre by assets under management. The Singapore theorem posits that in the knowledge economy, human capital is not just one factor of production among many—it is the meta-factor that determines how productively all other factors are deployed. For developing nations, this model is simultaneously the most difficult (requiring generational investment and institutional patience) and the most durable.
Real-World Exemplar: Singapore & Estonia
Singapore’s investment in education consistently ranks among the highest globally as a share of government spending. The result: Singapore’s students rank #1 globally in mathematics and science on OECD PISA 2022 assessments, a pipeline that feeds directly into a workforce commanding the highest median wages in Asia. Estonia—a nation of 1.3 million—built a digital governance infrastructure (e-Estonia) so sophisticated that 99% of government services are accessible online, reducing bureaucratic friction costs by an estimated 2% of GDP annually, per McKinsey Global Institute’s Digital Estonia case study.
| Dimension | Detail | Key Metric |
| Dimension | Detail | Key Metric |
| Model | Human Capital Investment | Singapore / Estonia |
| PISA Math Rank | Singapore: #1 globally | OECD PISA 2022 |
| e-Estonia Savings | ~2% of GDP/year | McKinsey Digital Govt. Review |
| Singapore Median Wage | Highest in Asia | MOM Singapore Statistics 2024 |
| Education ROI | +8–13% wages per year schooling | World Bank HCI 2024 |
| Source | OECD, McKinsey, World Bank | Ministry of Manpower SG |
| MODEL 08 OF 10 · CORE FRAMEWORK: REGIONAL INTEGRATION & BLOC-LEVEL ECONOMICS |
8. The Bloc Multiplier: How Regional Economic Integration Transforms Small-Market Disadvantage Into Collective Scale
Core Thesis
A nation of 20 million people with a $15 billion GDP is, in isolation, a rounding error in global trade negotiations. A bloc of 15 such nations, integrated under a common external tariff and harmonized regulatory framework, becomes a $225 billion market—large enough to attract serious FDI, negotiate meaningful trade agreements, and support regional value chains that would be economically unviable for any member in isolation. The BRICS economic trajectory increasingly demonstrates this logic at the largest scale: the bloc now represents over 35% of global GDP on PPP terms, per IMF data, creating collective bargaining power in international financial architecture that no single member could wield alone.
Real-World Exemplar: ASEAN & the African Continental Free Trade Area
ASEAN’s evolution from a loose political forum into the world’s fifth-largest economy as a bloc—with combined GDP exceeding $3.6 trillion—illustrates the compounding benefits of integration. The ASEAN Secretariat Statistical Yearbook 2024 shows intra-ASEAN trade reaching $756 billion in 2023. The African Continental Free Trade Area (AfCFTA), fully operational since 2021, carries even more transformative potential: the World Bank AfCFTA Impact Assessment 2023 projects the agreement could lift 30 million Africans out of extreme poverty and boost intra-African trade by 81% by 2035—if implemented with fidelity.
| Dimension | Detail | Key Metric |
| Dimension | Detail | Key Metric |
| Model | Regional Integration / Bloc Economics | ASEAN / AfCFTA |
| ASEAN GDP (2023) | $3.6 trillion (combined) | ASEAN Secretariat 2024 |
| Intra-ASEAN Trade | $756 billion (2023) | ASEAN Stat Yearbook 2024 |
| AfCFTA Poverty Lift | 30 million by 2035 (projected) | World Bank 2023 |
| AfCFTA Trade Boost | +81% intra-African trade potential | World Bank AfCFTA Report |
| Source | ASEAN Secretariat, World Bank | IMF BRICS Monitor 2024 |
| MODEL 09 OF 10 · CORE FRAMEWORK: INSTITUTIONAL QUALITY & ANTI-CORRUPTION ARCHITECTURE |
9. The Invisible Infrastructure: How Institutional Quality and Anti-Corruption Reform Unlock Every Other Development Model
Core Thesis
Every other model on this list is rendered partially or wholly ineffective in the absence of one foundational precondition: institutions that are reliable, transparent, and resistant to elite capture. This is the uncomfortable truth that the Washington Consensus got right in diagnosis, if catastrophically wrong in prescription. The World Bank’s Worldwide Governance Indicators demonstrate a near-linear correlation between rule of law scores, control of corruption metrics, and long-run per-capita income growth. Nations that implement credible anti-corruption architecture—independent judiciaries, digitized procurement, beneficial ownership registries, whistleblower protections—attract more FDI per capita, service their debt at lower spreads, and compound their human capital investments more efficiently.
Real-World Exemplar: Georgia & Uruguay
Georgia’s radical anti-corruption reforms between 2004–2012—which included abolishing and reconstituting the entire traffic police force overnight, digitalizing the national property registry, and publishing every state contract online—generated a 30-point improvement in Transparency International’s Corruption Perceptions Index within eight years. The World Bank Doing Business evolution for Georgia saw the nation climb from 112th to 7th globally in ease of doing business in the same period. FDI as a share of GDP tripled. Uruguay’s independent anti-corruption framework and judicial independence scores—the highest in Latin America per World Justice Project Rule of Law Index 2024—have consistently attracted investment-grade credit ratings despite being a small, commodity-linked economy.
| Dimension | Detail | Key Metric |
| Dimension | Detail | Key Metric |
| Model | Institutional Reform / Anti-Corruption | Georgia / Uruguay |
| Georgia CPI Change | +30 points (2004–2012) | Transparency International |
| Georgia Doing Business Rank | 112th → 7th globally | World Bank Doing Business |
| FDI Impact | Tripled as % of GDP post-reform | UNCTAD World Investment Report |
| Uruguay Rule of Law | #1 in Latin America | World Justice Project 2024 |
| Source | Transparency International, WJP | World Bank WGI 2024 |
| MODEL 10 OF 10 · CORE FRAMEWORK: SOUTH-SOUTH COOPERATION & ALTERNATIVE CAPITAL ARCHITECTURE |
10. South-South Cooperation and the New Financial Architecture: Escaping the Dollar Trap and Western Conditionality
Core Thesis
The emerging consensus among development economists is that the post-Bretton Woods financial architecture—dominated by the IMF, World Bank, and Western capital markets—imposes conditionalities and carries structural biases that have, at minimum, complicated and at worst actively obstructed the development ambitions of nations in the Global South. The rapid expansion of South-South cooperation frameworks—China’s Belt and Road Initiative, the New Development Bank, the Asian Infrastructure Investment Bank, and bilateral currency swap arrangements—represents a genuine structural shift in the menu of available financing options for developing nations. The BRICS economic trajectory now includes serious discussion of a BRICS reserve currency, and the NDB’s paid-in capital base has reached $10 billion, per its 2024 Annual Report.
Real-World Exemplar: Ethiopia & Indonesia
Ethiopia’s industrial park strategy—financed substantially through Chinese development finance and the NDB—created 100,000+ manufacturing jobs in six years and generated $2.1 billion in export revenues from apparel and light manufacturing, per UNCTAD World Investment Report 2024. Indonesia has strategically leveraged South-South arrangements to negotiate better terms on nickel processing requirements, insisting that raw nickel ore—critical for EV batteries—be processed domestically rather than exported raw, a policy the IMF’s Indonesia Article IV 2024 estimates could add $30–40 billion annually to GDP once downstream battery manufacturing scales.
| Dimension | Detail | Key Metric |
| Dimension | Detail | Key Metric |
| Model | South-South Cooperation | Ethiopia / Indonesia |
| NDB Capital Base | $10 billion paid-in capital (2024) | NDB Annual Report 2024 |
| NDB Project Approvals | $33B+ since inception | New Development Bank |
| Ethiopia Manufacturing Jobs | 100,000+ in 6 years | UNCTAD WIR 2024 |
| Indonesia Nickel Downstream | +$30–40B GDP potential | IMF Indonesia Art. IV 2024 |
| Source | UNCTAD, IMF, NDB | New Development Bank 2024 |
Conclusion: The Hybrid Imperative — Why the Winner Will Be the Nation That Masters Intelligent Economic Pluralism
The nations that will ascend to genuine economic superpower status over the next three decades will not be those that selected one model from this list and executed it faithfully. History is unambiguous on this point. South Korea combined export-led industrialization (Model 1) with aggressive human capital investment (Model 7) and targeted SEZ experimentation (Model 6). China fused all of these with South-South financing architecture (Model 10) and leapfrog digital infrastructure (Model 2). Singapore is essentially Models 6 and 7 in a city-state laboratory. The most sophisticated development economists at the IMF, the Brookings Institution, and Harvard’s Growth Lab all converge on the same conclusion: sequencing and contextual calibration matter as much as model selection.
What distinguishes tomorrow’s economic giants is not which blueprint they borrowed, but whether they possessed the institutional quality (Model 9) to implement it, the regional scale (Model 8) to amplify it, and the sovereign flexibility—freed from commodity dependence (Model 3) and Western conditionality (Model 10)—to adapt it without foreign veto. The nations on the cusp of this achievement today—India, Vietnam, Indonesia, Ethiopia, Morocco, Kenya—share a common denominator: they have all, consciously or pragmatically, begun assembling hybrid frameworks drawing from multiple models simultaneously.
The Harvard Growth Lab’s Atlas of Economic Complexity 2024 ranks economic complexity—the diversity and sophistication of a nation’s productive capabilities—as the single strongest predictor of future income growth. Economic complexity is itself the quantitative fingerprint of successful hybridization. The highest-complexity developing economies are precisely those that have refused to accept any single model’s constraints and instead built diversified productive ecosystems capable of competing across multiple global value chains simultaneously.
| 📊 Final Verdict: There is no single road to economic supremacy. But there is a consistent pattern among nations that travel it fastest: they think in systems, invest in people, protect institutions, and borrow selectively from every model that fits their unique endowments. The most dangerous development strategy is ideological purity. |
Frequently Asked Questions (FAQ Schema)
| What is the fastest-growing economic model for developing countries in 2025? Based on current IMF, World Bank, and McKinsey data, the services-led knowledge economy model (exemplified by India) and leapfrog digital development (exemplified by Kenya and Rwanda) are generating the fastest convergence toward high-income status in 2025. However, the highest sustained growth rates are recorded by nations combining export industrialization with deliberate human capital investment—Vietnam and Bangladesh are the most proximate examples in the current cycle. |
| Can developing nations realistically become the world’s biggest economy? Yes—and according to the IMF’s April 2025 World Economic Outlook, this is already occurring on a PPP-adjusted basis. India is projected to become the world’s third-largest nominal GDP economy by 2027. On a purchasing-power-parity basis, China already surpassed the United States in 2016. The structural fundamentals—demographic dividends, urbanization, technology diffusion, and institutional reform momentum—favour several developing nations ascending to the top tier of global economic power within 25 years. |
| What is leapfrog economics and how does it work for developing nations? Leapfrog economics is the theory that developing nations can bypass intermediate stages of technological and infrastructure development by adopting the latest generation of technology directly—skipping, for example, copper telephone networks in favour of immediate 5G deployment, or coal power grids in favour of solar microgrids. Kenya’s M-Pesa mobile money platform—which extended financial services to 40+ million people without a traditional bank branch network—is the paradigmatic global example. The economic benefit is both cost efficiency (newer technology is often cheaper than legacy systems) and speed of deployment. |
| What role does the BRICS economic trajectory play in developing nation growth? BRICS and its expanded BRICS+ grouping (now including Egypt, Ethiopia, UAE, Iran, and Saudi Arabia) plays an increasingly critical role in three distinct ways: first, as an alternative source of development finance through the New Development Bank ($33B+ in approvals) that carries lower conditionality than IMF/World Bank programmes; second, as a collective bargaining forum that amplifies developing-nation voices in IMF quota negotiations and WTO dispute resolution; and third, as an emerging architecture for de-dollarized trade settlement, which—if implemented at scale—would reduce developing nations’ vulnerability to U.S. Federal Reserve policy decisions and dollar-denominated debt crises. |
References & Data Sources
IMF World Economic Outlook, April 2025
- World Bank Open Data Portal
- World Bank AfCFTA Impact Assessment 2023
- IRENA Renewable Energy Outlook Africa 2023
- IEA Global Hydrogen Review 2024
- NASSCOM Strategic Review 2024
- McKinsey Global Institute Digital Reports
- Brookings Institution SEZ Analysis
- GSMA Mobile Economy Report 2024
- Harvard Growth Lab Atlas of Economic Complexity 2024
- OECD PISA 2022 Results
- World Justice Project Rule of Law Index 2024
- New Development Bank Annual Report 2024
- UNCTAD World Investment Report 2024
- Transparency International Corruption Perceptions Index
- ASEAN Secretariat Statistical Yearbook 2024
- Norges Bank Investment Management Annual Report 2024
- Goldman Sachs Global Investment Research – India Outlook 2024
Discover more from The Economy
Subscribe to get the latest posts sent to your email.


The traditional law firm model rests on a simple, historically unbroken equation: time equals money. Yet, that mathematical certainty is fracturing. This week, the legal AI start-up Legora announced an aggressive operational expansion, confirming plans to double its headcount from 140 to 280 employees by the end of 2026. This is not merely a recruitment drive. It is a calculated assault on the fundamental economics of corporate law. While legacy firms slowly pilot language models in isolated sandboxes, Legora is absorbing capital and engineering talent at a rate that suggests imminent, structural market displacement.
The expansion reflects a wider, irreversible shift in professional services. The broader macro environment for legal technology has moved from speculative funding to demanded utility. General Counsel at Fortune 500 companies are flatly refusing to pay first-year associate rates for routine due diligence. According to recent market analysis by Goldman Sachs, generative artificial intelligence could automate up to 44% of legal tasks globally.
This capital rotation is evident in the numbers. Legal tech investment rebounded sharply in early 2026, defying the wider venture capital contraction. Legora’s strategic hiring surge—heavily indexed towards machine learning researchers and former Magic Circle litigators—signals that the bottleneck is no longer technology. The bottleneck is taxonomy, compliance, and integrating vast arrays of unstructured legal data into highly regulated enterprise environments.
The Core Development: Scaling Beyond the Sales Pitch
Legora’s decision to double its workforce is funded by its recent, unpublicised $85 million Series C extension. That said, the specific allocation of this new human capital reveals the start-up’s long-term operational thesis. The company is not simply hiring sales representatives to push software licences. Instead, CEO Elena Rostova is recruiting aggressively for hybrid roles: legal engineers, compliance architects, and algorithmic auditors.
These roles address the primary friction point in enterprise legal tech. Off-the-shelf language models cannot draft a bespoke merger agreement without hallucinating non-existent precedents. To solve this, Legora is building proprietary, retrieval-augmented generation (RAG) pipelines overlaid with highly specific, jurisdiction-bound legal taxonomies.
- Legal Ontologists: 40% of the new hires will hold dual qualifications in computer science and law.
- Security Infrastructure: 30% are allocated to on-premise deployment teams, addressing the data sovereignty concerns of Tier 1 banks.
- Customer Success: The remainder will embed directly within partner law firms to manage change resistance.
The market demand for this tailored approach is acute. In a recent sector assessment, the Solicitors Regulation Authority (SRA) noted that 65% of large firms now expect vendors to provide indemnification against algorithmic errors. Meeting that regulatory threshold requires human oversight at scale. Legora’s hiring spree is a direct response to this compliance mandate. They are internalising the liability risk that major law firms are too terrified to assume.
Still, executing this expansion in a tight labour market presents unique risks. Recruiting talent that understands both the transformer architecture of modern AI and the intricacies of Delaware corporate law is notoriously expensive. Base salaries for these hybrid “legal prompt engineers” reportedly exceed $250,000, placing enormous pressure on Legora’s burn rate.
Generative AI in Law: A Structural Rebalancing
The narrative surrounding legal automation often centres on job losses for junior lawyers. The reality is far more complex and fundamentally alters law firm profitability metrics. When a task that traditionally billed for 12 hours is completed in 14 seconds by a proprietary algorithm, the law firm faces an existential pricing crisis.
How will legal AI change the billable hour?
Generative AI will effectively destroy the traditional billable hour model by decoupling time spent from value delivered. Law firms will be forced to transition to value-based pricing or flat-fee arrangements, as clients will refuse to pay hourly rates for tasks automated by language models in seconds.
This transition is already visible in the mid-market. Alternative Legal Service Providers (ALSPs) are weaponising platforms like Legora to win massive corporate contracts away from established legacy firms. By operating without the overhead of expensive real estate and bloated equity partnerships, these tech-enabled challengers offer fixed-fee corporate governance and contract lifecycle management.
To survive, traditional firms must redefine what constitutes “premium” legal advice. If drafting standard commercial leases is entirely commoditised, partner-level profitability will rely solely on high-stakes litigation, complex regulatory strategy, and bespoke M&A structuring. Legora’s product roadmap directly targets this commoditisation threshold. Their upcoming V4 engine promises to automate complex, multi-jurisdictional compliance audits.
The financial implications are staggering for the broader economy. Corporate legal spending represents a massive drag on business efficiency. A report by the Financial Times highlighted that enterprise clients anticipate reducing their external legal spend by up to 20% by 2028, entirely through the mandated use of vendor-supplied AI. Legora is positioning itself to be the tollbooth through which those efficiency savings flow.
Downstream Consequences: Markets, Regulators, and SMEs
If Legora successfully deploys its doubled workforce and captures dominant market share, the second-order effects will ripple far beyond corporate boardrooms. The most immediate impact will be felt by mid-tier law firms. Lacking the capital to build proprietary models or licence top-tier enterprise software, these firms face a severe competitive disadvantage.
Furthermore, the democratisation of legal intelligence fundamentally alters the power dynamics for Small and Medium Enterprises (SMEs). Historically, SMEs capitulated in commercial disputes against larger corporations simply because they could not afford the discovery costs. Platforms scaling at Legora’s velocity threaten to level this playing field. When AI can parse 100,000 emails for relevant trial exhibits in an afternoon for $500, the “war of attrition” litigation strategy collapses.
Regulators are acutely aware of this shifting terrain. The Bank of England has already expressed preliminary concerns regarding systemic risk if multiple global financial institutions rely on the same underlying AI infrastructure for regulatory compliance. If Legora’s models contain a systemic bias or hallucinate a specific compliance interpretation, that error could replicate across dozens of global banks simultaneously.
That said, the expansion of legal tech workforces also promises a surge in transparency. Regulators themselves are beginning to adopt these exact technologies to audit corporate behaviour. Legora has already confirmed pilot programs with two unnamed European antitrust authorities. The hiring of ex-regulators into their newly formed government relations team—expected to reach 15 staff members by September 2026—demonstrates a clear ambition to become the default compliance layer for state actors.
Competing Perspectives: The Hallucination Ceiling
Not all market analysts view Legora’s aggressive expansion as a signal of inevitable triumph. A vocal contingent of legal traditionalists and tech sceptics argues that the start-up is fundamentally mispricing the “last mile” of legal accuracy.
Language models are inherently probabilistic; they guess the next most likely word based on training data. Law, however, is deterministic. A misplaced comma in a £50 million credit facility can trigger catastrophic default clauses. Dr. Simon Aris, a visiting fellow at the Oxford Internet Institute, recently argued that companies like Legora are hitting a “hallucination ceiling.” He posits that pushing an AI model from 95% accuracy to the 99.9% required for binding legal counsel requires an exponential, rather than linear, increase in compute and human oversight.
From this perspective, Legora’s decision to double its headcount is an admission of technological failure, not success. The sceptics argue that the start-up is forced to hire hundreds of human reviewers to manually patch the inherent flaws in their generative models. If true, the unit economics of the business are fundamentally broken. They are simply operating a traditional, low-margin legal process outsourcing (LPO) firm disguised under a high-margin tech valuation.
Furthermore, data privacy remains an unresolved battleground. European clients governed by GDPR are increasingly hostile to cloud-based processing of sensitive litigation data. While Legora touts its on-premise capabilities, maintaining bespoke, disconnected models for individual clients destroys the network effects that traditionally make software-as-a-service (SaaS) businesses so profitable. The requirement to constantly update and patch isolated instances of the software requires a massive, sustained human workforce.
The Synthesis of Law and Code
The expansion of Legora is a litmus test for the commercial viability of artificial intelligence in high-stakes professional services. If the company can successfully integrate 140 new specialists without destroying its margin, it will validate the hybrid model of legal engineering. If it collapses under the weight of manual oversight and spiralling wages, it will confirm the traditionalists’ belief that human judgment is economically irreplaceable.
We are witnessing the painful, capital-intensive transition from bespoke craftsmanship to industrialised intelligence. The billable hour may not die tomorrow, but the infrastructure for its replacement is currently being built, coded, and tested.
Discover more from The Economy
Subscribe to get the latest posts sent to your email.

The San Francisco headquarters of Anthropic turned into a command center on Thursday night following a sudden directive from Washington. The Anthropic AI model freeze, issued via an emergency order by the Department of Commerce, marks a watershed moment in state intervention within Silicon Valley. Federal regulators blocked the deployment and export of the firm’s unreleased next-generation frontier system, sending shockwaves through global technology markets. For Chief Executive Officer Dario Amodei, the enforcement represents an existential hurdle that upends the capital-intensive roadmaps governing generative artificial intelligence. As capital flight threatens the broader sector, the company is now forced into a desperate regulatory re-engineering process to salvage its most advanced intellectual property.
This regulatory crackdown didn’t emerge from a vacuum. Throughout 2025, the Executive branch signaled an aggressive pivot toward protectionist technology containment, viewing massive frontier LLMs as critical dual-use infrastructure. According to a recent Federal Register report, federal oversight over compute clusters exceeding $10^{26}$ FLOPS has intensified by 40% over the last fiscal year. This aggressive stance reflects a wider geopolitical doctrine aimed at securing American algorithmic supremacy. Data compiled by the Center for Strategic and International Studies reveals that international capital flows into US-based AI laboratories reached $42 billion in early 2026, with a significant portion tied to cross-border deployment strategies that are now illegal under current mandates. By freezing Anthropic’s flagship models, the White House is drawing a definitive line in the sand. National security priorities now supersede pure venture-backed market expansion. This shift forces a fundamental reappraisal of the commercial viability of frontier systems, turning regulatory compliance into a primary battleground for survival.
The Core Development: Inside the Claude 4 Interdiction
The mechanical catalyst for this disruption occurred on June 11, 2026, when the Bureau of Industry and Security (BIS) issued an unprecedented temporary denial order. Officials targeted Anthropic’s unreleased model pipeline, code-named Claude 4 Ultra, halting both domestic deployment and external cloud testing. The agency utilized emergency powers under the International Emergency Economic Powers Act, citing classified audits that alleged vulnerabilities in the model’s autonomous cyber-defense evasion techniques. Reports from the Financial Times indicate that the decision followed a series of closed-door red-teaming exercises conducted by federal agencies. These tests revealed unexpected capabilities in automated malware generation that surpassed acceptable safety thresholds.
Anthropic’s internal response has been chaotic yet highly calculated. Amodei convened an emergency board meeting within two hours of the BIS notification to address the immediate operational fallout. The company’s immediate priority is convincing regulators that its safety protocols, known as Constitutional AI, can effectively mitigate the government’s specific national security anxieties. Internal memos leaked to the press show that the firm had already spent $120 million on alignment engineering specifically for this model iteration. The freeze effectively traps this capital in a regulatory holding pattern, preventing any immediate return on investment.
The financial impact of the freeze reverberates through Anthropic’s core capitalization structure. Major backers, including Amazon and Alphabet, are closely monitoring the situation as their cloud architecture roadmaps rely heavily on Anthropic’s frontier capabilities. According to analysis by Bloomberg Economics, the freeze could disrupt up to $1.5 billion in projected cloud services revenue for these tech giants over the next two quarters alone. With computational overhead costs running at an estimated $3 million per day, Anthropic faces a rapidly burning runway unless it can negotiate a swift compromise with Washington. This financial bleeding represents a stark lesson for venture-backed AI labs operating under an increasingly assertive state apparatus.
Geopolitical Realignment and the Trump Administration AI Policy
This enforcement represents a paradigm shift in how the state treats corporate intellectual property. Under the current Trump administration AI policy, software assets are no longer viewed merely as commercial products; they are treated with the same strict counter-proliferation protocols as nuclear centrifuges or stealth hardware. This aggressive mercantilism signals that the White House views the race for artificial general intelligence through an unyielding realist lens. The administration expects American laboratories to function as national assets rather than independent international enterprises.
Why did the Trump administration freeze Anthropic’s AI models?
The Trump administration froze Anthropic’s top AI models due to heightened national security concerns regarding dual-use capabilities. The Department of Commerce’s Bureau of Industry and Security intervened after internal assessments flagged potential vulnerabilities in Claude 4’s advanced cryptographic and autonomous cyber-offensive capacities.
The strategic consequences for Anthropic’s commercial position are severe. By restricting the dissemination of Claude 4, the government has inadvertently altered the competitive equilibrium of Silicon Valley. Competitors who have engineered models just below the federal compute scrutiny thresholds now possess an unexpected market advantage. The picture is more complicated for companies trying to balance international enterprise software contracts with increasingly isolationist domestic laws. This regulatory ceiling distorts normal market mechanisms, picking winners and losers based on bureaucratic compliance rather than technical merit.
Furthermore, this action highlights the fragility of the compute-centric regulatory framework. Government agencies are currently using hardware capacity as a proxy for raw intelligence and threat potential. This blunt approach penalizes architectural efficiency and algorithmic breakthroughs. As a result, venture capital firms are already reallocating funds away from raw scale toward specialized, narrow applications that evade federal scrutiny. The focus is shifting rapidly from raw processing power to defensive compliance engineering.
Market Disruptions and the Claude 4 Export Restrictions
The chilling effect of these Claude 4 export restrictions extends far beyond Anthropic’s balance sheet. Small and medium enterprises (SMEs) that built their product pipelines on top of Anthropic’s commercial APIs face sudden, systemic platform risk. If federal restrictions expand to current production models, thousands of downstream software applications could see their operational backbones severed overnight. This dependency highlights the profound vulnerability of the modern software ecosystem, where entire industries rely on a handful of centralized AI providers.
On a macroeconomic level, the intervention challenges the long-term viability of the American tech sector’s foreign revenue models. European and Asian enterprise clients are already reassessing their reliance on American cloud infrastructure. A research briefing from the Organisation for Economic Co-operation and Development indicates that corporate trust in trans-Atlantic data architectures has declined, prompting a surge in demand for localized, open-source alternatives. This flight toward sovereign AI models could permanently diminish the global market share of domestic technology giants.
The semiconductor supply chain will also experience significant volatility because of this freeze. If major AI labs cannot deploy next-generation models, their demand for high-end accelerators will inevitably contract. Market analysts project that a prolonged deployment ban could lead to an immediate oversupply of advanced silicon, disrupting production schedules at major foundries like TSMC. Still, Washington appears willing to accept this collateral economic damage to maintain absolute control over critical technologies. The downstream friction will likely recalibrate hardware valuations across the global tech sector.
The National Security Rationale vs. Market Innovation
Defenders of the administration’s aggressive intervention argue that the state is fulfilling its primary obligation to national defense. National security hawks point out that the speed of AI advancement far outpaces traditional legislative frameworks, requiring decisive executive action. A policy paper from the Heritage Foundation argues that failing to secure dual-use algorithms represents an unacceptable risk to critical infrastructure. From this perspective, the temporary economic disruption of private firms is a small price to pay to prevent advanced capabilities from falling into hostile hands.
Yet, critics within the scientific community argue this heavy-handed approach will ultimately backfire. By forcing an Anthropic regulatory response that focuses entirely on compliance over research, the government risks stifling the exact innovation that grants America its competitive edge. Leading researchers note that top-tier talent is highly mobile; excessive domestic restrictions may drive the world’s best computer scientists to jurisdictions with more permissive research environments. This brain drain would weaken domestic capabilities far more than any controlled export ever could. The global balance of technological power may hinge on where these researchers choose to settle.
The Cost of Sovereign Control
The confrontation between Anthropic and the federal government exposes the core tension of the algorithmic age. Silicon Valley can no longer operate as an autonomous nation-state, detached from the geopolitical realities of Washington. As the boundaries between commercial enterprise and national security dissolve, technology companies must accept a new reality where state oversight is permanent and pervasive. The financial and structural costs of this transition will redefine the economics of innovation for a generation.
The true measure of success for Anthropic will not be its next architectural breakthrough, but its capacity to operate within the constraints of a suspicious state.
Discover more from The Economy
Subscribe to get the latest posts sent to your email.

KEY FACTS: THE NEW IMBALANCE
- The Issue: A sharp widening in global current account deficits and surpluses, driven by US consumption and Chinese export overcapacity.
- Scale: Global imbalances have widened to nearly 3.5% of world GDP, approaching pre-2008 financial crisis levels.
- Key Drivers: Green technology subsidies, shifting manufacturing hubs, and retaliatory tariff regimes.
- SME Impact: Increased volatility in supply chains and currency markets; tighter access to cross-border trade finance.
The ships are backing up again. At the ports of Long Beach and Rotterdam, the visible symptoms of a macroeconomic fever are returning: a flood of manufactured exports from East Asia meeting an insatiable, debt-fueled demand in the West.
For the better part of a decade following the 2008 financial crash, the world’s trade ledger slowly equalised. The massive deficits run by the United States and the corresponding surpluses hoarded by China and Germany shrank to manageable levels. Politicians declared the era of dangerous global imbalances over. They were premature. Today, the global economy is threatened again by trade imbalances, and the architecture designed to manage these pressures is fundamentally fracturing.
The Return of the China Shock
To understand the current threat, one must look at how capital and goods are flowing in a post-pandemic, highly subsidised world. The structural forces are distinct from the early 2000s, yet the mathematical outcome is strikingly similar.
The United States is running a severe current account deficit, propped up by high fiscal spending and a strong dollar. Conversely, China, facing a profound domestic real estate contraction and weak consumer demand, has pivoted aggressively back to export-led growth. Beijing is pouring capital into advanced manufacturing—specifically electric vehicles, solar panels, and legacy semiconductors. This is generating a massive current account surplus, effectively exporting its deflationary pressures to the rest of the world.
The International Monetary Fund (IMF) recently warned that this divergence is unsustainable. When one major economy consumes vastly more than it produces, and another produces vastly more than it consumes, the resulting friction typically ends in a financial shock or a protectionist wall.
Structural Fragmentation and the Tariff Wall
What makes this wave of global trade imbalances particularly dangerous is the geopolitical environment. In 2005, policymakers sought to resolve imbalances through diplomatic forums and currency adjustments. In 2026, they are using tariffs.
We are witnessing the weaponisation of the current account. The European Union has erected steep duties on subsidised green technology, while Washington has effectively ring-fenced its domestic markets against foreign tech and automotive imports. This fragmentation forces global trade into inefficient, politically mandated corridors.
For mid-market companies and multinational supply chains, the fallout is immediate. A widening global imbalance historically leads to sudden currency realignments. If the US dollar eventually corrects downward to close the deficit gap, emerging markets holding dollar-denominated debt will face crippling repayment crises. The imbalances are not merely spreadsheet errors; they are stored kinetic energy in the global financial system.
Eligibility & How SMEs Can Access Trade Support Funding
While macroeconomic tectonic plates shift, small and medium-sized enterprises (SMEs) are the ones that must navigate the resulting supply chain shocks. Recognising the threat that global trade imbalances pose to domestic businesses, governments have expanded localized funding and advisory schemes to help firms diversify their export markets and secure supply chains.
In the UK, the Department for Business and Trade (DBT) operates the UK Export Finance (UKEF) facilities and the Export Support Service.
Who is eligible?
- UK-based businesses with an annual turnover of under £25 million.
- Firms experiencing direct supply chain disruption due to foreign tariffs or trade imbalances.
- Companies seeking to enter new markets to bypass concentrated trade routes.
How to apply:
- Audit Your Supply Chain: Before applying, document your reliance on single-nation imports (particularly those subject to new trade barriers).
- Access the Portal: Applications for the General Export Facility (GEF)—which provides partial guarantees to banks to help UK exporters access trade finance—are processed through the official UKEF portal.
- Required Documentation: You will need three years of audited accounts, a detailed export business plan, and proof of disruption or market opportunity.
- Approval Timeline: Standard advisory services are available immediately, while financial guarantees typically take four to six weeks for approval via participating commercial banks.
The Downstream Consequences for Markets
The second-order effects of these widening imbalances will shape the next decade of capital allocation. If surplus nations cannot recycle their excess capital into US Treasuries—due to geopolitical sanctions or changing risk appetites—that capital will seek alternative havens, potentially inflating asset bubbles in gold, commodities, or emerging market equities.
Furthermore, trade imbalances threaten the green transition. The West needs cheap solar panels and batteries to meet climate targets; China has the capacity to provide them. Yet, the political imperative to balance trade and protect domestic jobs means Western nations are taxing these exact imports. The irony is sharp: the effort to correct the trade imbalance will almost certainly increase the cost of the energy transition.
We are entering a period where trade policy and monetary policy are actively colliding. Central banks are trying to tame inflation, while trade ministries are implementing tariffs that inherently raise consumer prices.
The Efficiency Counterargument
Yet, not all economists view the current data with alarm. A dissenting perspective suggests that framing these imbalances as a “threat” misreads the reality of modern demographics and capital efficiency.
Proponents of this view argue that surplus countries like Germany and Japan have rapidly aging populations; it is entirely logical for them to save more than they invest, generating a surplus. Conversely, the US, with deeper capital markets and a younger demographic profile, is the natural destination for those savings. From this angle, the deficit is not a sign of American weakness, but of American financial magnetism.
That said, this demographic defence ignores the speed at which the current gaps are widening, and the political backlash they are generating. Efficient capital flows mean nothing if they trigger legislative trade wars that ultimately destroy that efficiency.
Frequently Asked Questions
What are global trade imbalances? Global trade imbalances occur when the value of a country’s imports significantly exceeds its exports (a current account deficit), while other nations export vastly more than they import (a current account surplus). Over time, this creates financial instability and currency volatility.
How do trade imbalances affect the global economy? They create systemic fragility. Surplus countries accumulate massive foreign reserves, while deficit countries accumulate debt. If surplus nations suddenly stop buying the deficit nation’s debt, it can trigger rapid currency devaluation, spike interest rates, and cause a global recession.
What is the main cause of the US trade deficit? The US trade deficit is primarily driven by high domestic consumption, a strong US dollar that makes American exports expensive, and significant government borrowing. It is amplified by importing cheap manufactured goods from surplus nations like China.
How can SMEs protect themselves from trade wars? SMEs can protect themselves by diversifying their supplier base, avoiding over-reliance on a single country for raw materials, utilising government export finance guarantees, and hedging against currency volatility through forward contracts.
The Path Forward
The global economy is threatened again by trade imbalances, not because deficits and surpluses are inherently evil, but because the political tolerance for them has evaporated. The system is attempting to balance the books through friction rather than cooperation. As surplus nations double down on manufacturing and deficit nations retreat behind tariff walls, the illusion of a frictionless global market is over. What follows, however, will be defined by whether policymakers choose managed decoupling or a chaotic fracturing of the global trade order.
Sources:
- International Monetary Fund (IMF) – World Economic Outlook
- World Trade Organization (WTO) – Global Trade Outlook and Statistics
- UK Department for Business and Trade – UK Export Finance Guidelines
- The Economist – The New China Shock
Discover more from The Economy
Subscribe to get the latest posts sent to your email.

Why Legal AI Start-up Legora is Doubling Its Headcount

Anthropic AI Model Freeze: White House Halts Claude 4 Deployment Over National Security

The Global Economy Is Threatened Again by Trade Imbalances

The £4m Lifeboat: Why the Treasury is Treating SME Debt as a Structural Contagion

Kevin Warsh Wants the Fed to Stop Explaining Everything

UK Japan Investment Agreement: Inside the £18bn Deal

AI Fundraising Trends: Wall Street’s Record Capital Influx

China Tungsten Export Curbs: Is Japan’s AI Chip Supply at Risk?

Pakistan Textile Body Welcomes FY27 Budget, Seeks FTR

US Economic Resilience: Why the Economy Keeps Defying the Odds

Global Strategic Oil Reserves Depletion: The Empty Vaults

Dubai Consumer Protection: 155,000+ Inspections Secure Price Stability

18% Shipping Sales Tax Abolition Sparks Maritime Economy Growth

Bank Indonesia Rate Hike 2026: New Mandate’s First Market Test

China Overhauls the World’s Biggest Surveillance Network with Advanced AI

Kevin Warsh Takes the Fed’s Helm — and Walks Straight Into a Rate-Hike Storm

SpaceX, OpenAI & Anthropic IPOs: Wall Street’s $200B AI Test

SpaceX IPO: Inside the $2 Trillion Market Debut

How AI Is Forcing McKinsey and Its Peers to Rethink Pricing

KPMG Australia CEO Resigns After Whistleblower Claims Exposed Investigation Failures

Pakistan Budget FY 2026-27: Relief, Prospects, and the Tightrope Walk

Broadcom Market Value Loss: Revenue Forecast Disappoints

The Guardrails Are Down: How Meta and Google’s AI Models Fold Under Pressure

Stock Market Correction Risk Mounts as Bond Yields Defy the Bull Case

Five PSX Stocks Worth Owning Before the Second Quarter Ends

Benefitbay Raises $18M to Build the Plumbing for America’s ICHRA Shift

Nasdaq Tumbles 4% as Chip and Memory Stocks Sink: A $1.2 Trillion Wipeout

China Warns of ‘Severe’ Global Conditions as Economy Shows Weakness
-

 Markets & Finance5 months ago
Top 15 Stocks for Investment in 2026 in PSX: Your Complete Guide to Pakistan’s Best Investment Opportunities
-

 Analysis4 months ago
Top 10 Stocks for Investment in PSX for Quick Returns in 2026
-

 Analysis4 months ago
Brazil’s Rare Earth Race: US, EU, and China Compete for Critical Minerals as Tensions Rise
-

 Banks5 months ago
Best Investments in Pakistan 2026: Top 10 Low-Price Shares and Long-Term Picks for the PSX
-

 Investment5 months ago
Top 10 Mutual Fund Managers in Pakistan for Investment in 2026: A Comprehensive Guide for Optimal Returns
-

 Analysis4 months ago
Johor’s Investment Boom: The Hidden Costs Behind Malaysia’s Most Ambitious Economic Surge
-

 Global Economy6 months ago
15 Most Lucrative Sectors for Investment in Pakistan: A 2025 Data-Driven Analysis
-

 Global Economy6 months ago
Pakistan’s Export Goldmine: 10 Game-Changing Markets Where Pakistani Businesses Are Winning Big in 2025