
Analysis
Iran’s Real Weapon Is the World Economy: How Missiles, Drones, Mines and Selective Maritime Disruption Are Reshaping Global Risk

When the White House quietly confirmed that US President Donald Trump would travel to Beijing on May 14 to 15, rescheduling a summit previously derailed by the sudden outbreak of the Iran war on February 28, it was more than a mere scheduling adjustment. It was a stark geopolitical admission. The delay revealed that this conflict in the Middle East is now structurally vast enough to disrupt the calendars of great powers, distort global markets, and force governments thousands of miles from the Persian Gulf to urgently rethink energy security, inflation, and supply-chain resilience.
For decades, military analysts have war-gamed a clash between Washington and Tehran through the sterile lens of conventional military metrics: ship counts, sortie rates, and air defense batteries. But as the events of the past month have demonstrated with chilling clarity, the central question of this conflict is no longer whether Iran can defeat the United States or Israel conventionally. They cannot, and they know it.
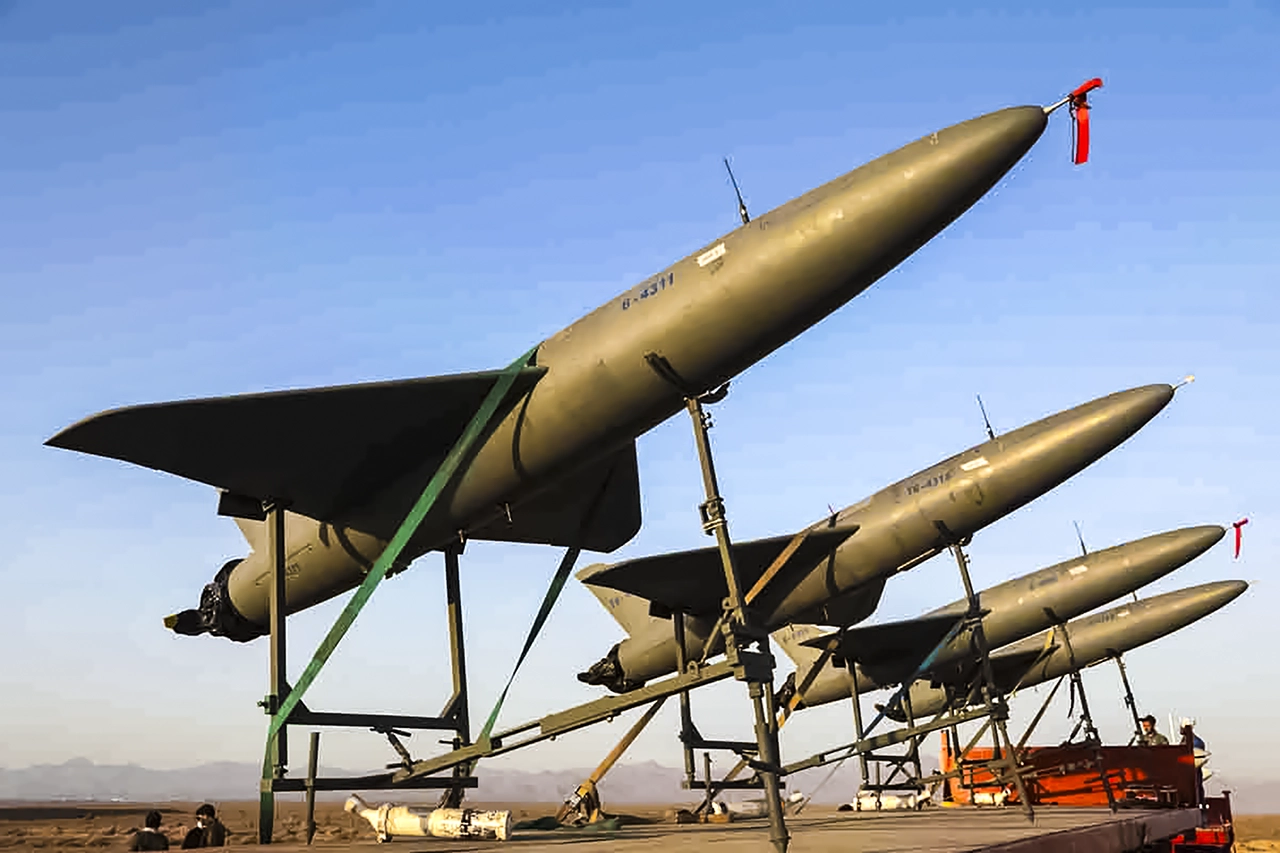
The real question is whether Tehran can make the economic price of continuing the war too high, too global, and too prolonged for the West to ignore. We are witnessing a masterclass in asymmetric warfare where Iran’s real weapon is the world economy. By deploying low-cost, high-impact tools, Tehran is proving that missiles, drones, mining threats and selective maritime disruption can be enough to make insurers, traders, shipowners and governments reprice risk across the entire globalized system.
Iran’s strategy is a meticulously calibrated economic coercion. Tehran is exploiting a rare combination of geography, target concentration and asymmetric tools to hold the global economic recovery hostage. And so far, the financial markets are proving them right.
The New Paradigm: Iran Asymmetric Economic Warfare
To understand the genius—and the terror—of Iran’s current playbook, one must discard the 20th-century notion that wars are won by destroying the enemy’s military formations. In a hyper-connected, hyper-optimized global economy, a nation does not need to sink a fleet to achieve strategic parity; it merely needs to make the cost of transit commercially unviable.
This is the essence of Iran asymmetric economic warfare. By utilizing swarms of cheap loitering munitions, unmanned surface vessels, and the persistent, invisible threat of naval mines, Tehran has fundamentally altered the cost-benefit analysis of navigating the world’s most critical maritime chokepoints. A $20,000 drone does not need to sink a $150 million Very Large Crude Carrier (VLCC) carrying $100 million worth of oil. It only needs to scorch its deck to trigger a systemic panic in the underwriting rooms of London and New York.
Tehran understands the fragility of the maritime arteries that sustain modern capitalism. This is why the recent entrance of Yemen’s Houthis into the broader conflict is so destabilizing. We are no longer looking at an isolated crisis in the Strait of Hormuz; we are facing a dual-chokepoint strangulation encompassing both Hormuz and the Bab el-Mandeb Strait. By targeting commercial vessels selectively—and reportedly floating a mafia-style “$2 million-per-ship fee” for guaranteed safe passage—Iran and its proxies are effectively levying a private tax on global trade.
This is not a traditional blockade. It is a protection racket scaled to the size of the global economy. Through Iran missiles drones mining global supply chains, Tehran is executing a strategy designed not to win a military victory, but to inflict a political and economic pain threshold that forces a diplomatic capitulation.
Repricing the Gulf: Iran Maritime Disruption Insurance
The immediate frontline of this new war is not the flight deck of a US aircraft carrier; it is the actuarial spreadsheets of global maritime insurers. The Strait of Hormuz disruption 2026 is triggering a seismic shift in how risk is priced, bought, and sold.
Prior to February 28, an estimated 20% of global oil consumption—roughly 21 million barrels per day—transited the Strait of Hormuz. Today, that volume has contracted sharply as shipping companies route around the cape or pause voyages entirely. For those that dare the passage, the financial toll is staggering. War-risk insurance premiums have skyrocketed, surging from a fraction of a percent of a vessel’s value to unsustainable single-digit percentages practically overnight.
As the Financial Times notes in its analysis of maritime risk, when Gulf shipping risk insurers repricing occurs at this velocity, the costs are immediately passed down the supply chain. Iran maritime disruption insurance is no longer a niche concern for shipping magnates; it is a direct inflationary tax applied to every commodity, manufactured good, and barrel of oil moving between East and West.
Data Visualization Context: [Chart: Oil Price Trajectory vs. Shipping Volumes Through Hormuz & Bab el-Mandeb Since Feb 28] – A diverging line graph illustrating the inverse relationship between plunging daily vessel transits in the Gulf and the sharp, unbroken ascent of Brent Crude prices crossing the $100 threshold.
This dynamic forces a profound recalibration of what constitutes “risk.” A shipowner looking at a 500% increase in war-risk premiums must decide if the cargo is worth the financial gamble. When the answer is no, vessels sit idle, supply chains freeze, and the global economy chokes. This is precisely what the architects in Tehran intended.
The Macro Shock: Inflation, Oil Trajectories, and Fed Paralysis
The ripple effects of this strategy are already crashing onto the shores of Western central banks. The Iran war oil prices impact has been immediate and violent. With US crude settling above the $100 mark and Brent eyeing a record monthly rise, the specter of the 1970s oil shocks has returned to haunt policymakers. The International Energy Agency (IEA) has already sounded the alarm, warning that we are teetering on the edge of the “largest supply disruption in history” if the conflict broadens to regional oil infrastructure.
This energy shock arrives at the worst possible macroeconomic moment. Just as the US Federal Reserve and the European Central Bank believed they had tamed the post-pandemic inflation dragon, the Gulf crisis has reignited price pressures. Federal Reserve Chair Jerome Powell recently signaled a “wait and see” approach regarding the war’s economic fallout, a subtle admission that the central bank is trapped. Raising interest rates to combat oil-driven inflation risks plunging the global economy into a deep recession; holding them steady risks allowing inflation to become entrenched.
The Economist recently highlighted the resurgence of stagflation fears, pointing out that a prolonged conflict exceeding three months will inevitably lead to deep macroeconomic scarring. By weaponizing the oil markets, Iran has effectively bypassed the Pentagon and launched a direct strike on the Federal Reserve. This is the zenith of Iran calibrated economic coercion 2026: forcing Western leaders into impossible domestic political dilemmas.
Target Concentration: The Outsized Impact on Asian Economies
While the geopolitical theater is fixated on the Washington-Tehran dynamic, the true economic victims of this asymmetric warfare reside in the East. The Strait of Hormuz closure economic impact on Asia cannot be overstated. The economies of China, Japan, India, and South Korea are fundamentally reliant on Middle Eastern crude and liquefied natural gas (LNG).
Tehran’s strategy capitalizes heavily on this “target concentration.” The overwhelming majority of the oil flowing through Hormuz is destined for Asian markets. Consequently, the disruption serves as a blunt instrument of leverage against the very nations that historically maintain neutral or even amicable relations with Iran.
The real-time fallout across the Indo-Pacific is stark. In Singapore, households are already facing immediate electricity tariff hikes for the April-June quarter, with the Energy Market Authority warning of sharper increases to come. Major logistics hubs are feeling the squeeze, with companies like Yeo Hiap Seng cutting headcount and moving operations to navigate the margin crush. Supply chains are fraying; luxury cars destined for Asian markets are stranded in Sri Lankan ports as Japanese shipping companies face paralyzing congestion.
To mitigate the crisis, Asian powers are scrambling for alternatives. Japan is hastily coordinating with Indonesia to secure thermal coal as a fallback for power generation, risking its climate commitments in the name of raw survival. Meanwhile, in a fascinating display of diplomatic fracture, Malaysia recently announced that its tankers would be exempt from Iran’s reported Hormuz toll—a testament to Kuala Lumpur’s pragmatic, long-standing relationship with Tehran.
This selective enforcement is the most insidious aspect of Iran economic coercion. By granting safe passage to some nations while punishing others, Tehran is attempting to divide the international community, making a unified coalition impossible. It forces Beijing and New Delhi to pressure Washington for a rapid de-escalation, effectively turning America’s vital trading partners into unwitting lobbyists for Iranian interests.
The Limits of Conventional Deterrence
The stark reality of 2026 is that traditional naval hegemony is insufficient to guarantee the free flow of global commerce. The US Navy, for all its unparalleled lethality, is designed to destroy state-level navies and project power ashore. It is not inherently designed to play an endless, unwinnable game of Whac-A-Mole against swarms of explosive drones launched from the backs of pickup trucks, or to sweep vast swathes of the Gulf for untethered acoustic mines.
As detailed by Foreign Affairs in their recent evaluation of Gulf security, attempting to solve an asymmetric economic problem with a symmetric military solution is a fool’s errand. Every Tomahawk missile fired at a fifty-dollar drone launch pad is a victory for Tehran’s arithmetic. The sheer cost imbalance heavily favors the instigator.
Furthermore, the secondary knock-on effects are paralyzing corporate strategy. Multinational giants are scaling back; consumer goods titans like Unilever have reportedly imposed global hiring freezes explicitly citing the Middle East war’s macroeconomic drag. Credit ratings agencies are recalibrating the sovereign debt of Gulf nations, with Fitch signaling downgrade risks for regional players due to post-war security environment uncertainties.
When global capital begins to view the entire Middle East as functionally un-investable and physically un-navigable, Iran’s objective is met. They do not need to plant a flag in Washington. They simply need to make the Dow Jones bleed until Washington offers terms.
Conclusion: Navigating a Repriced World
When Presidents Trump and Xi sit down in Beijing this May, the agenda will not merely be about tariffs, semiconductor export controls, or artificial intelligence dominance. The specter at the banquet will be the vulnerability of their shared globalized economy to asymmetric disruption. The Iran war of 2026 has irrevocably proved that the ultimate weapon of mass disruption is not nuclear; it is logistical.
We have entered an era where Iran’s real weapon is the world economy. The success of calibrated economic coercion means that future conflicts will increasingly mirror this blueprint. Rogue states and non-state actors alike have learned that by applying pressure to the delicate, over-optimized nodes of global supply chains, they can punch vastly above their geopolitical weight class.
The West cannot bomb its way out of an insurance crisis. Countering this new reality requires more than just deploying additional carrier strike groups. It demands a total reimagining of global supply-chain resilience, a rapid acceleration toward localized and diversified energy grids, and the painful acceptance that the era of friction-free, perfectly timed global shipping is over.
Until the world economy can insulate itself from the asymmetric leverage of chokepoint disruption, the true balance of power will not be measured in ballistic missiles or stealth fighters. It will be measured in the terrifyingly fragile mathematics of freight rates, risk premiums, and the price of a barrel of crude. The world has been repriced. We are all just paying the toll.
Discover more from The Economy
Subscribe to get the latest posts sent to your email.



Key Takeaways
- Rolex’s secondary market rose approximately 7.9% year-over-year as of 2026 (per WatchCharts data) — trailing Patek Philippe (+16.2%) and Tudor (+11.4%) but still outperforming Audemars Piguet (+3.4%).
- Rolex raised U.S. retail prices 4–9% in January 2026 (steel models ~5.6%, gold models ~8.7%), narrowing the historical gap between retail and pre-owned pricing.
- Not every model appreciates: steel sports references (Submariner, GMT-Master II, Daytona) have held value far better than two-tone or widely available dress references like the standard Datejust.
- The Lady-Datejust posted the sharpest 2026 gain among tracked collections — up 22.73%, from roughly $9,269 to $11,376 — driven by demand for smaller, “everyday luxury” watches.
- Gold’s rise past $2,400/oz has directly lifted the investment case for Rolex’s precious-metal references (Day-Date, Sky-Dweller, Yacht-Master).
The Model-by-Model Picture
| Category | 2026 Trend |
|---|---|
| Lady-Datejust | +22.73% (strongest performer among tracked collections) |
| Steel sports models (Submariner, GMT-Master II) | Held value well; corrected from 2022 peak but stabilized above retail |
| Daytona | Corrected from highs above $50,000 to the mid-$30,000s; still among the most sought-after references |
| Two-tone/widely available Datejust | Flat to negative — “holds value” is an overstatement for this category |
| Gold references (Day-Date, Sky-Dweller) | Lifted by gold’s rise above $2,400/oz |
Why the “Rolex Always Appreciates” Myth Is Fading
The pandemic-era boom pushed some references — the Daytona above all — to speculative highs disconnected from historical norms. Since the March 2022 peak, steel sports models have compressed meaningfully, and dealers who bought inventory near the top have in some cases faced 20–40% markdowns on liquidation. The lesson for 2026 buyers: Rolex as a category is not a monolith. Value retention depends heavily on specific reference, condition, and whether the piece comes with box and papers (“full set”).
What’s Actually Driving 2026 Strength
- Retail price increases raise the floor. When a new Submariner retails at $10,050 (up from $9,500), a pre-owned example at $11,000–$12,000 suddenly represents a smaller premium — narrowing the gap without secondary prices actually moving.
- Supply discipline remains Rolex’s core lever. The brand has never confirmed production numbers, and secondary-market premiums remain entirely a function of Rolex’s own manufacturing decisions — a risk factor as much as a support.
- Certified Pre-Owned rollout. Rolex’s now fully rolled-out CPO program has changed how buyers transact in the used market, adding a layer of brand-verified legitimacy that supports pricing.
The Case for Rolex as a Portfolio Diversifier
Financial advisors increasingly frame luxury watches not as a replacement for equities or bonds, but as a tangible, historically low-correlation diversifier — one that carries its own risks (illiquidity, condition-dependent pricing, no yield) but has demonstrated multi-decade resilience for specific references.
Is Rolex a good investment in 2026?
It depends heavily on the specific reference. Steel sports models like the Submariner and Daytona have held or grown in value; two-tone and widely available dress models generally have not. Overall, Rolex’s secondary market rose about 7.9% year-over-year in 2026, trailing Patek Philippe but ahead of Audemars Piguet.
Discover more from The Economy
Subscribe to get the latest posts sent to your email.

Navigating Mortgage and Loan Refinancing in a High-Yield Environment
Global public debt crossing critical thresholds has kept central bank policies volatile, resulting in fluctuating US Treasury yields throughout 2026. For homeowners and commercial property holders burdened by previous high-interest borrowing cycles, finding optimal refinance windows has become a high-stakes financial puzzle. Stalled disinflation and stubborn employment numbers mean rate cuts are incremental, requiring borrowers to act with precision.
Timing your mortgage or commercial loan refinance in this environment requires a deep understanding of yield curve movements and lender risk appetites.
Decoding 2026 Refinance Dynamics
The 10-Year Treasury Yield Benchmark
Mortgage rates continue to track closely with the 10-year US Treasury yield. When macroeconomic anxiety spikes debt issuance, yields rise, tightening consumer borrowing capacity. Savvy borrowers monitor weekly Treasury auctions to lock in rates during brief dip windows.
Hybrid ARMs and Alternative Structures
With fixed rates remaining elevated, 7/1 and 10/1 adjustable-rate mortgages (ARMs) have surged in popularity. These products offer lower initial monthly payments, giving borrowers breathing room until central bank easing cycles fully materialize.
| Loan Product | Current Rate Range | Best For | Key Risk Factor |
| 30-Year Fixed Mortgage | 6.2% – 6.8% | Long-term predictability | Higher initial monthly outlay |
| 7/1 Hybrid ARM | 5.5% – 5.9% | Short-term ownership / flipping | Rate reset risk after year 7 |
| Commercial Refinance | 7.0% – 8.2% | Corporate asset restructuring | Strict DSCR lender covenants |
Actionable Steps for Successful Refinancing
To maximize your chances of securing favorable refinance terms in a volatile market, follow a disciplined preparation strategy.
Boost Your Credit Score Immediately: Lenders in 2026 are applying stringent credit tiering; a 20-point increase can drop your APR by a crucial quarter-point.
Shop Regional Credit Unions: Smaller financial institutions often offer portfolio loans with more flexible underwriting than major national banks.
Calculate the Break-Even Point: Ensure your total closing costs are recouped through monthly savings within 24 months of closing.
“Market Strategist View: Refinancing in 2026 is an exercise in opportunistic timing. Borrowers must maintain immaculate financial profiles ready to strike the moment Treasury yields dip.”
Mastering the complexities of today’s debt environment ensures you can successfully lower your debt service costs and protect your long-term financial stability.
Discover more from The Economy
Subscribe to get the latest posts sent to your email.

The days of pulling generic auto insurance quotes based purely on your zip code and age are officially over. In 2026, insurance comparison engines are powered entirely by generative AI and real-time telematics. These platforms digest thousands of live data points—ranging from your driving smoothness via connected vehicle sensors to real-time traffic congestion patterns—to generate hyper-personalized premiums instantly.
For consumers, this evolution represents both a massive opportunity for savings and a hidden trap for penalty pricing. Understanding how AI algorithms evaluate risk is essential for anyone looking to lower their monthly auto insurance premiums.
How AI Comparison Engines Evaluate Your Risk Profile
Behavioral Telematics and Connected Cars
Modern cars stream performance data directly to insurance aggregators. Generative AI models analyze braking sharpness, acceleration curves, cornering G-forces, and phone distraction metrics. Drivers who maintain smooth, defensive habits are rewarded with dynamic rate cuts of up to 40% compared to traditional rating tiers.
Predictive Traffic and Weather Modeling
AI tools now cross-reference your daily commute route with predictive weather and accident probability models. If your standard parking location or driving corridor has a statistically higher incidence of uninsured motorist claims, your quotes will reflect that hyper-local risk assessment.
| Comparison Factor | Traditional Rating Model | 2026 Generative AI Model | Impact on Premium |
| Mileage & Usage | Annual estimated odometer reading | GPS tracking & live trip duration | High (up to 35% savings) |
| Driving Behavior | MVR driving record & accidents | Real-time braking, speed, & G-force | Critical (determines tier) |
| Vehicle Tech | Make, model, and safety rating | ADAS calibration & repair cost data | Moderate |
Strategies to Lower Your AI-Driven Insurance Quote
To outsmart the algorithm and secure the lowest possible premium in 2026, drivers must proactively manage their digital footprint on insurance platforms.
Opt-In for Telematics Trial Periods: Many insurers offer immediate 15% discounts just for installing their driving app; let it track safe habits for 30 days to lock in permanent savings.
Scrub Unverified Public Records: Ensure your motor vehicle report is free of clerical errors that AI risk models misinterpret as reckless behavior.
Compare AI Aggregators: Use platforms that integrate multi-carrier API feeds rather than single-brand comparison sites to find the best risk-adjusted rate.
“Industry Note: AI-driven pricing rewards transparency and precision. Drivers who actively manage their telematics data consistently out-save those relying on legacy quote calculators.”
Embracing AI comparison tools allows savvy policyholders to customize coverage limits precisely to their driving habits, eliminating wasted premium spend while ensuring robust protection.
Discover more from The Economy
Subscribe to get the latest posts sent to your email.

Stock Market Crash in 2026? Warning Signs, Scenarios and a Calm Investor Checklist

Peso Mexicano vs Dólar Estadounidense: A Practical USD/MXN Guide for October 2026

Is the Stock Market Open on Columbus Day 2026? NYSE, Nasdaq and Bonds Explained

Concert Ticket Prices in 2026: Dynamic Pricing, Fees and How to Buy Safely

High-Yield Savings Accounts in 2026: How to Compare APY Without Chasing a Headline

EU-China Trade Deal 2026: How Beijing and Brussels Avoided a Trade War—and Who Wins

Social Security 2027 COLA Announcement: Date, Formula and What Retirees Should Check

China’s AI Microdrama Boom: How Beijing Is Reshaping Global Media

Q3 2026 Earnings Preview: Can Record Profit Expectations Keep Wall Street’s Rally Alive?

Russia Diesel Deal 2026: Oil Prices and Inflation Risks

Fed Rates 2026: Treasury Yields, Bonds and SGOV Explained

S&P 500 Market Breadth 2026: Weak Rally or Rotation?

The AI Capex Boom: Data Centers Reshaping Growth

Palantir Stock in 2026: Extraordinary AI Growth

PSX Forecast 2026: KSE-100, IMF Reviews & Geopolitics

Middle East War Economics 2026: Oil Prices & Energy Markets

China Stocks Today: Are Big Economies in Asia Nearing a Market Bottom?

Crypto Daily Outlook: Bitcoin, Altcoins, and the Future of Decentralized Finance

Global Pension Systems Ranked: The World’s Best and Worst Retirement Frameworks

World’s Largest Economies: Ranking the Top Global Powers

Elon Musk’s Next Moves: Disrupting the 2026 Global Economy

Pakistan Economy 2026: Inside the SBP’s Balancing Act

GasBuddy Market Insights: How Crude Price Shifts Impact Local Fuel Cost Averages

World Bank & IMF Reports 2026: Why the “3% Growth” Consensus Is Actually a Debate

Crude Oil & Petroleum Market Analysis: OPEC+ Decisions and Price Forecasts

Global Equity Market Divergence: US Tech vs. European Dividend Stocks vs. Asian Growth

IMF & World Bank Global Economic Outlook: Growth Forecasts Across Europe and Asia

Silver Price Today: Why the Xi-Trump AI Standoff Is Fueling a Safe-Haven Rally
-

 Markets & Finance9 months ago
Top 15 Stocks for Investment in 2026 in PSX: Your Complete Guide to Pakistan’s Best Investment Opportunities
-

 Analysis8 months ago
Johor’s Investment Boom: The Hidden Costs Behind Malaysia’s Most Ambitious Economic Surge
-

 Analysis8 months ago
Top 10 Stocks for Investment in PSX for Quick Returns in 2026
-

 Banks9 months ago
Best Investments in Pakistan 2026: Top 10 Low-Price Shares and Long-Term Picks for the PSX
-

 Analysis8 months ago
Brazil’s Rare Earth Race: US, EU, and China Compete for Critical Minerals as Tensions Rise
-

 Investment9 months ago
Top 10 Mutual Fund Managers in Pakistan for Investment in 2026: A Comprehensive Guide for Optimal Returns
-

 Global Economy10 months ago
15 Most Lucrative Sectors for Investment in Pakistan: A 2025 Data-Driven Analysis
-

 Global Economy10 months ago
Pakistan’s Export Goldmine: 10 Game-Changing Markets Where Pakistani Businesses Are Winning Big in 2025