
Markets & Finance
Gold Overtakes US Treasuries in Reserves: What It Means

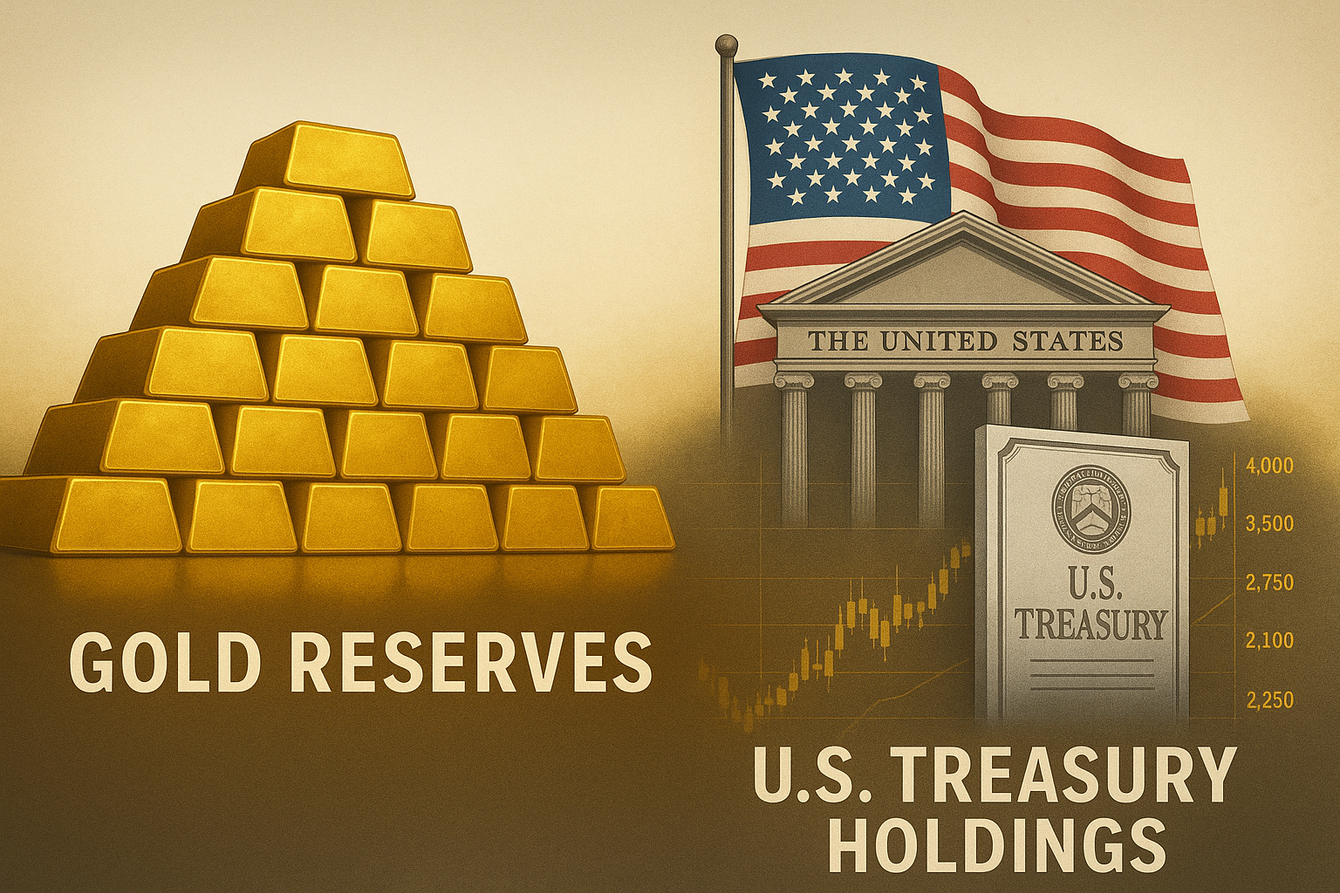
Most gold coverage in 2026 has fixated on the price chart — the spectacular run from roughly $2,633 an ounce at the start of the year to fresh record highs above $5,400 by mid-year (Intellectia). That’s a legitimate story. But it’s not the most important one. The more consequential shift is structural, not seasonal: gold has overtaken US Treasuries as the largest share of global central bank reserves for the first time in three decades (BlackRock).
That’s not a headline about a commodity rally. It’s a headline about the architecture of the global monetary system quietly shifting under everyone’s feet.
The Trigger Most Coverage Undersells
The pivotal moment behind this shift traces back to 2022, when roughly $300 billion of Russian central bank foreign exchange reserves were frozen as part of international sanctions following the invasion of Ukraine (ISA Bullion). For reserve managers around the world — not just in Russia — that event functioned as a wake-up call: dollar-denominated assets held abroad are not unconditionally safe from geopolitical sanctions risk. Gold, by contrast, carries no counterparty risk; nobody can freeze a gold bar sitting in a country’s own vault.
That single realization has reshaped reserve management strategy globally. Central bank gold purchases averaged 225 tonnes per quarter between 2021 and 2025 — roughly double the pace seen from 2016 to 2020 (J.P. Morgan Global Research). BRICS+ nations now hold 17.4% of global gold reserves, up sharply from just 11.2% in 2019 (ISA Bullion).
Who’s Actually Buying, and Why the List Matters
Poland has been the standout accumulator, adding 20.2 tonnes in February 2026 alone, another 11.2 tonnes in March, and 14 tonnes in April — extending a rapid buildup that has added more than 360 tonnes to its reserves since 2023 (BestBrokers). China’s central bank maintained consecutive monthly gold purchases for 19 straight months through May 2026, even though much of this buying goes officially unreported to the IMF — analysts widely believe the People’s Bank of China continues accumulating gold “off the books” (ISA Bullion).
China’s motivation appears explicitly strategic rather than opportunistic. Chinese net gold imports jumped to 317 tonnes in the first quarter of 2026 alone — nearly triple the prior quarter — while the People’s Bank of China’s own reported purchases accelerated from roughly one tonne per month through February to eight tonnes in April (J.P. Morgan Global Research). J.P. Morgan’s own analysts frame this as part of a long-term Chinese project to build gold reserves as a foundation for establishing the renminbi as a credible alternative reserve currency.
A World Gold Council survey found a striking 95% of central banks expect to increase their gold holdings in 2026, up from 81% in 2024 and just 52% in 2021 — a trajectory showing accelerating, not plateauing, institutional conviction (BlackRock).
The Part of the Story Most Coverage Misses: Not Everyone Is Buying
Here’s an angle that gets consistently underplayed: this isn’t a uniform global stampede into gold. Several countries, including Singapore, Jordan, Mexico, and the Solomon Islands, actually reduced their gold reserves in 2025 — Singapore in particular emerged as a notable seller, likely driven by portfolio rebalancing decisions and a desire to realize gains after gold’s historic surge, rather than any lack of confidence in the metal (BestBrokers). Germany, for its part, has reduced its gold holdings every year since at least 2002, though its 2024 sale of just 1.1 tonnes was the smallest annual reduction on record.
This nuance matters for anyone trying to build a genuinely accurate picture: the de-dollarization and gold-accumulation trend is heavily concentrated among specific emerging-market and non-aligned economies — not a universal central bank consensus. Understanding which countries are buying and why is more analytically useful than simply citing an aggregate global purchasing figure.
Where Forecasts Diverge — And Why the Spread Is So Wide
Institutional price forecasts for gold currently show a genuinely unusual spread. J.P. Morgan projects gold reaching $6,000 an ounce by the end of 2026, and potentially $6,300 by the end of 2027 (J.P. Morgan Global Research). Morgan Stanley’s more conservative 2026 forecast sits at $4,400 an ounce (Morgan Stanley), while State Street projects a range of $4,750 to $5,500, and DWS targets $5,400 by mid-2027 (Discovery Alert).
A spread exceeding $1,500 per ounce between the most bullish and most conservative institutional forecasts reflects a genuine, unresolved analytical disagreement — not just differing house styles. The bull case rests on the idea that central bank reserve diversification represents a structural, policy-level shift rather than opportunistic market timing, making it fundamentally different from prior gold cycles driven mainly by retail or momentum investors. The more cautious case notes that gold’s roughly 245% rally from September 2022 to January 2026 is the largest percentage advance in modern gold market history — and historically, rallies of that magnitude have eventually triggered significant, multi-year corrections (Discovery Alert).
The Under-Discussed New Buyer: Stablecoin Issuers
One of the least-covered developments in this entire gold story is the emergence of stablecoin issuers as a genuinely new category of gold demand. As crypto markets have matured, some stablecoin issuers have begun holding gold as part of their reserve backing strategy — a development BlackRock specifically flags as part of the “early stages” of a new demand wave that also includes central banks and the broader AI infrastructure buildout’s effect on institutional portfolio hedging behavior (BlackRock).
What This Means for Different Audiences
For everyday investors: Gold ETPs still make up only about 0.17% of total US private financial assets, remaining well below prior peaks seen in the early 2010s, while private wealth gold allocations globally sit roughly 50% below levels seen a decade ago (BlackRock). That suggests meaningful room for incremental Western retail and institutional demand to grow, even after the current rally, if the structural de-dollarization narrative continues to gain mainstream acceptance.
For businesses managing currency exposure: The scale and persistence of central bank gold buying is one of several signals (alongside Fed communication policy changes and fiscal deficit concerns) suggesting continued structural pressure on the US dollar’s long-term reserve currency dominance — a trend worth factoring into multi-year currency hedging strategies rather than treating as a short-term news cycle.
For portfolio allocators: The unusually wide spread between institutional forecasts is itself useful information — it suggests treating any single gold price target as a scenario input rather than a confident base case, and sizing gold allocations based on its role as a portfolio diversifier and inflation/geopolitical hedge rather than as a directional price bet.
The Bottom Line
The gold price chart is the story most people are watching. The reserve-composition shift is the story that actually matters for the long-term structure of global finance. Gold surpassing US Treasuries as the largest share of central bank reserves for the first time since 1996 is a genuinely historic threshold — one triggered specifically by the 2022 Russian asset freeze and now sustained by a broad, if uneven, cohort of emerging-market central banks pursuing deliberate de-dollarization strategies. Whether the price keeps climbing toward J.P. Morgan’s $6,000 target or cools toward Morgan Stanley’s more conservative range matters less, in the long run, than the structural fact that the world’s reserve managers have permanently changed how they think about gold’s role in the global financial system.
Discover more from The Economy
Subscribe to get the latest posts sent to your email.



Stocks approached record territory as the third-quarter 2026 corporate earnings season gathered pace. Investors have substantial optimism about profits but also a complicated set of risks: borrowing costs, geopolitical energy shocks, narrow market leadership and doubts about whether AI spending will keep producing attractive returns. Earnings reports offer something social-media commentary cannot: company-specific numbers against which expectations can be tested.
The S&P 500 closed at 7,811.54 on Friday, October 9, according to the Associated Press, after gaining 0.6% for the session. A high stock index can be supported by improving fundamentals, improving valuations, or a combination. Earnings season helps reveal how much of the rally is backed by actual revenue, profits and revised guidance. AP market close.
FactSet’s key estimate: 29.6% expected growth
In research published October 9, FactSet said the S&P 500’s current third-quarter earnings growth rate was 29.6%. That is a blended or estimated earnings-season measure, not the final result for the entire index. FactSet further argued that normal patterns of companies beating estimates could push final reported growth above 35%. It is critical to attribute the higher figure as an analytical expectation, not a fact already achieved. FactSet, October 9.
The difference matters for both investors and editorial credibility. A reader seeing “S&P profits rose 35%” may assume results have been reported, while much of the quarter’s company-level information remains forthcoming. A good headline preserves tense: analysts expect, companies reported, or estimates imply. Numbers should be revised after additional disclosures, with the article’s update date changed accordingly.
Why AI is a major source of expected growth
Technology suppliers and businesses selling into AI infrastructure have seen demand for chips, networking and cloud capabilities. Large AI-oriented firms can deliver unusually fast earnings growth that influences aggregate S&P performance. A Financial Times analysis reported strong profit expectations driven in significant part by AI investment and cited Goldman Sachs forecasting a 27% year-on-year increase for the September quarter at the time of publication. Different forecasting organizations may report somewhat different estimates because of timing, methodologies and index coverage. Financial Times analysis.
AI’s influence cuts both ways. If capital spending accelerates, infrastructure providers may enjoy better near-term sales. But the companies purchasing equipment may experience pressure on future cash flows. A positive earnings result from an upstream chip supplier does not establish that a downstream AI application has produced attractive returns. For an earnings season described as “AI-led,” these layers must be kept distinct.
Banks are an early window into the rest of the economy
Major U.S. banks are among the firms expected to report prominently as the season develops. Their results can reveal changes in loan demand, deposits, interest margins, consumer credit and corporate investment appetite. A bank’s profits are influenced by trading activity as well as household borrowing, making financials a useful but imperfect proxy for overall economic strength.
Barron’s reported cautious investor sentiment ahead of results from institutions including JPMorgan and Bank of America, with questions around loan growth, trading, investment banking and funding costs. That coverage highlights an important distinction: strong analyst estimates can coexist with weak bank share prices when the market is concerned about sustainability. Barron’s banks preview.
For editors, bank earnings offer a chance to connect a headline number to the drivers underneath it. A trading-revenue surprise is not the same thing as a broad increase in customer lending. A favorable quarter from reserve releases is not the same as accelerating underlying demand.
Profit margins are the stress test
Corporate profit growth can result from faster sales, lower expenses, favorable mix or accounting effects. When revenue rises quickly but expenses rise more slowly, margins improve. Yet companies experiencing higher energy, borrowing or labor costs may face pressure even if total sales are still rising. Margin changes deserve as much scrutiny as earnings per share.
To compare businesses fairly, separate operating margins from net margins and GAAP results from management-adjusted metrics. Adjusted profitability measures can illuminate recurring performance but can also exclude substantial compensation or restructuring costs. Reconciliations in company filings matter. Commentary should not declare a new efficiency era solely because one adjusted metric rose.
Earnings beats are relative to expectations
A company can report growing profit and see its shares fall. Markets care about results relative to estimates and about forward guidance. If management announces a large revenue increase but expects slower future growth, the stock may decline because investors had anticipated an even stronger outlook. Conversely, a weak quarter can generate a share-price rise if the news is less bad than investors feared.
This is why a quality earnings article should answer at least four questions: What did the company report? What had analysts expected? What guidance changed? How did the share price move after the report, with a precise time reference? Avoid relying on a single social-media reaction or prematurely attributing every market move to one headline.
Does the rest of the market benefit from AI-driven profits?
A major issue is whether profit improvements are spreading beyond the highest-profile technology companies. Large index members have greater weight in the S&P 500, and strong results from a handful of leaders can dominate its earnings trajectory. The wider market may experience more uneven conditions, especially where debt costs, weak pricing power or shrinking demand weigh on smaller firms.
MarketWatch described an improvement in market breadth in the latest week, despite prior concentration in AI-linked shares. That provides a possible counterpoint to fears of permanently narrow leadership. MarketWatch breadth update. But a sustained broadening should be confirmed through both price data and profit revisions across sectors.
The strongest earnings season would be one in which more industries deliver genuine revenue gains, margins remain defensible and corporate guidance does not depend on endlessly rising financing commitments. The weaker version is one in which aggregate growth looks impressive but relies on relatively few extraordinary businesses.
Energy and rates could change management guidance
Energy prices influence transport, production and consumer spending. October’s Russian diesel arrangement temporarily reshaped fuel-market expectations, while conflict risks continued to cloud future supply. Those variables could affect management commentary even when reported September-quarter financial results predate the latest announcement. Reuters diesel reporting.
Interest rates are another powerful influence. In September, the Fed raised its policy target to 3.75%–4.00%, and the 10-year Treasury yield traded at elevated levels by October. Higher financing costs may constrain businesses with weak cash flows and significant borrowing requirements. However, stronger economic growth can also support profits despite those costs. An earnings season should test which companies actually have the pricing power and balance sheets to navigate this environment. Federal Reserve.
The earnings dashboard worth publishing each week
For each major reporting wave, show the percentage of S&P companies that have announced results, the blended earnings growth rate, revenue growth, the fraction beating estimates, and the direction of full-year guidance. Then include a sector table highlighting technology, financials, energy, industrials, health care and consumer-facing companies. A static earnings estimate from early October must not be presented as though it already incorporates late-October results.
Separate reported financials from projections. Update coverage at meaningful milestones and retain a revision history when numbers change materially. Cite primary investor-relations releases and SEC filings wherever possible, using analysts or data providers for consensus figures. This publication method is better for readers than repeating an aggressive headline each time a single company exceeds expectations.
Can profits keep the rally alive?
They could help, especially if earnings growth proves durable and broadens. But market outcomes will also depend on valuation, bond yields, policy uncertainty and what management teams say about future capital expenditure. The most productive question for investors is not whether Q3 growth looks large in isolation. It is whether the incremental profit justifies the market prices investors are already paying and whether cash flow supports further expansion.
For a finance news site, the editorial advantage is to follow those tests in real time. A disciplined tracker of estimates versus actual results can offer more repeat value than a one-off prediction about how high the S&P 500 will climb.
Frequently asked questions
What was FactSet’s Q3 2026 S&P 500 earnings-growth estimate on October 9?
The reported estimated growth rate was 29.6%.
Has S&P 500 Q3 earnings growth already exceeded 35%?
No final index-wide outcome was established by that analysis; FactSet said the rate might exceed 35% after companies report.
Why do banks matter early in earnings season?
Their reports can illuminate credit quality, deposit costs, corporate activity and risk appetite.
Does an earnings beat mean the stock will rise?
No. Market reaction depends on expectations, guidance, valuation and many other factors.
Discover more from The Economy
Subscribe to get the latest posts sent to your email.

Energy prices can move quickly through transportation costs, consumer inflation, political debate and expectations for interest rates. That is why an announcement about diesel shipments from Russia can matter far beyond the oil industry. On October 9, U.S. President Donald Trump announced an arrangement under which Russia would provide diesel to U.S. and global markets, with an initial amount reported as more than 300,000 metric tons and additional volumes proposed for later delivery. Reuters reporting.
The announcement is consequential, but editors must separate agreed or promised supplies from cargoes that have actually arrived and been processed. The arrangement is also politically contentious because it involves easing restrictions on Russian energy revenue while Russia continues its war in Ukraine. Understanding both parts is essential; a pure pump-price article would miss the diplomatic stakes, while a pure geopolitical article could overlook how households and manufacturers feel a fuel shock.
What has been announced—and what remains uncertain
Reuters reported an initial quantity exceeding 300,000 metric tons, with 500,000 tons in November and 1 million tons thereafter discussed as additional supplies. The exact rollout, cargo destinations and future deliveries depend on logistics and policy implementation. The Associated Press reported that the U.S. Treasury issued a temporary license easing relevant sanctions for the arrangement. A license is not the same thing as a permanent, unrestricted return to normal trading. Reuters; Associated Press.
The most useful next questions are practical. Which grades of diesel are eligible? Which ports and refineries can receive shipments? What insurance, shipping and payment channels will be used? Could other fuel trade be displaced rather than global supply increased? Without answers, it is premature to calculate a permanent reduction in pump prices from announced tonnage alone.
Why diesel prices are different from crude-oil prices
Crude oil is a raw feedstock; diesel is a refined product. Diesel availability depends on crude supply, refinery configuration, maintenance, fuel standards, transportation infrastructure and regional inventories. Diesel and crude prices often move together, but refining margins can expand or contract independently. A disruption to refineries or fuel exports may produce a sharp diesel-price shock even if crude prices move less dramatically.
Diesel is essential for commercial trucking, agriculture, heavy equipment and some industrial processes. Higher diesel costs can feed into freight rates and food-delivery expenses, though the timing and degree of pass-through depend on contracts and competition. Household inflation may also be affected indirectly through goods prices, making diesel a politically sensitive indicator even for people who never personally buy the fuel.
The market’s immediate response isn’t a long-term forecast
Reuters said U.S. diesel futures fell nearly 5% following the announcement. A futures move shows how traders adjusted near-term expectations; it does not prove the eventual physical shipments will achieve the stated pricing objective. Reuters October 9.
Markets move on surprises relative to what investors had expected. If traders had anticipated even more supply, prices could still rise despite the announcement. Conversely, an unexpected license can depress futures before a single new cargo is loaded. A fair article reports the change in futures separately from retail diesel prices, which are influenced by local taxes, inventories, refining margins and distribution conditions.
Iran adds a second layer of energy uncertainty
Regional instability involving Iran has intensified concerns about energy routes and supply availability. Risk to strategic waterways, shipping costs, tanker insurance and refinery operations can feed into global prices. But forecasts that any particular route will remain closed, reopen at a specified time or cause a precise percentage increase in inflation require reliable, current verification.
The October diesel plan has been discussed against the backdrop of high fuel prices and broader conflict-related disruptions. Reuters. These events should not be reduced to a single causal statement such as “Iran caused all fuel inflation.” Refinery outages, industrial demand, inventories, government policy and seasonal factors also matter. A successful news explainer distinguishes contributing factors rather than presenting an exclusively geopolitical cause.
Ukraine’s refinery strikes complicate the diplomacy
Ukrainian attacks on Russian energy infrastructure have become an important part of the conflict and the diplomatic debate over the diesel arrangement. Axios reported claims from a U.S. official about disagreements with Kyiv over those attacks and Washington’s decision to pursue a deal with Moscow. The report attributed its characterization of the president’s motives to that official; it should not be presented as an uncontested account of every participant’s intentions. Axios investigation.
Ukraine’s government has objected to measures it sees as providing Russia additional revenue during the war. AP and Reuters reported strong criticism of the sanctions relief. The administration’s stated rationale emphasizes lowering fuel costs. These are distinct policy positions, and a responsible treatment can explain both without treating an announced supply transaction as a negotiated peace settlement. Associated Press.
The sanctions trade-off is economic as well as strategic
Sanctions can restrict access to buyers, financing, shipping and technology. Easing them may improve market liquidity and encourage new fuel flows. But it may also reduce economic pressure on the sanctioned country and alter bargaining incentives. The relevant evaluation must include what was licensed, for how long, and whether the transaction can be reversed if conditions change.
Policy effects are not always immediate. A temporary legal authorization could unlock inventories already available elsewhere, making market prices react sooner than actual shipping. On the other hand, operational barriers can still slow delivery despite a license. Reporting should distinguish market permission from physical production capacity and avoid making unsupported claims about how revenue will be used by a government.
How fuel prices reach headline inflation
A fuel shock has direct and indirect channels. Direct effects show up in categories such as diesel and gasoline purchases. Indirect effects travel through freight, agricultural machinery, heating and the cost of distributing goods. For firms with thin margins, a prolonged fuel-price rise can reduce profitability before consumer prices fully adjust.
The macroeconomic response is more ambiguous. High energy costs can weaken demand, while simultaneously pushing measured inflation upward. Central banks must judge whether the shock will persist and influence broad wage and price expectations. The Fed’s September 2026 statement described inflation as elevated and raised the policy rate to 3.75%–4.00%, underscoring the importance of future energy outcomes for monetary conditions. Federal Reserve policy statement.
A balanced scenario framework
In an easing scenario, announced shipments arrive, existing inventories are accessible, and shipping disruptions diminish. Diesel prices could soften, with some relief passing into freight costs. In a stress scenario, logistics fail, sanctions arrangements face reversal or regional conflict interrupts supply, extending the inflation problem. A mixed scenario is also possible: near-term futures soften but consumer prices remain stubborn because local markets are slow to adjust.
These are scenarios, not verified outcomes. Publishing a precise fuel-price forecast without a model, input assumptions and uncertainty range would be misleading. A stronger publication follows actual cargo movements, inventory reports, refinery output, wholesale crack spreads and retail price data to see which scenario is materializing.
What journalists and readers should verify next
First, read the exact terms and expiration of the relevant U.S. Treasury license. Second, compare company and government announcements with cargo-tracking or customs evidence when available. Third, distinguish oil benchmarks from diesel futures and average retail pump prices. Fourth, update reporting on conditions affecting Iran-linked maritime routes. Fifth, document the responses of Ukraine, Russia and U.S. lawmakers with accurate attribution.
A brief daily update can be more useful than a speculative “end of the energy crisis” headline. It should state what changed since yesterday and what remains unknown. That discipline also helps readers distinguish temporary market relief from a lasting normalization of energy trade.
Frequently asked questions
Did the United States announce a Russian diesel arrangement in October 2026?
Yes. Reuters and AP reported the October 9 announcement and temporary sanctions relief. The delivery schedule still requires verification as supplies move.
Did diesel futures fall after the news?
Reuters reported an initial decline of nearly 5%. Retail prices will not necessarily change by the same amount or on the same day.
Why does Ukraine object?
Ukrainian officials have argued that easing restrictions could generate revenue benefiting Russia while the war continues.
Can a diesel agreement reduce inflation permanently?
Not on its own. Lasting effects depend on supply, demand, logistics, refinery conditions and broader inflation pressures.
Discover more from The Economy
Subscribe to get the latest posts sent to your email.

The S&P 500 is an index of large American companies, but it is not a democratic vote in which every stock contributes equally. In the familiar market-capitalization-weighted version, the largest companies have a disproportionate influence on the headline index. When major technology and AI businesses rise substantially, they can lift the benchmark even while the typical constituent delivers a much less impressive return.
That is the main idea behind “market breadth.” Breadth asks how widely a rally is distributed rather than how far the index has risen. It is especially important in a market where investors discuss AI leadership, high interest rates and uneven sector performance at the same time. Weak participation can reflect vulnerable concentration, but it can also create the conditions for a healthy rotation if lagging groups begin to catch up.
The October 9 close and the deeper split
According to the Associated Press, the S&P 500 ended Friday, October 9, at 7,811.54, up 0.6% for the session after a strong week. That tells readers the headline direction of the benchmark, but not how many companies had participated over preceding months. The S&P 500’s performance is compatible with both a broadly rising market and a narrowly led market, depending on the period and indicator examined. AP market close.
A separate Barron’s report highlighted that only 46% of S&P 500 constituents stood above their 200-day moving averages when the index set a record earlier in the week. That is an indicator observed at a particular time with a particular definition. It should not be carelessly extended to every U.S. listed stock or to a later trading session. Barron’s breadth analysis.
Why the 200-day moving average gets attention
A 200-day moving average smooths roughly ten months of daily trading prices. Analysts often treat a share price above that moving average as evidence that its longer-term trend is positive, although this is an imperfect and backward-looking measure. If a large share of an index’s constituents trade below that line, it indicates many individual stocks are struggling to maintain their own long-term trend even if the benchmark is holding up.
There is no universal rule that a particular percentage automatically predicts a market crash. Broad rallies can weaken before falling, but narrow markets can remain narrow for extended periods. Moving averages can be distorted by sharp drops followed by recoveries, by industry cycles and by seasonal trading. A reader should see breadth as a risk gauge and diagnostic tool, not an infallible timing signal.
Cap-weighted versus equal-weighted performance
One practical way to assess concentration is to compare a capitalization-weighted S&P 500 fund with an equal-weight version of the same constituents. In an equal-weight approach, each stock starts with approximately the same weight at scheduled rebalances. If a few mega-cap companies dominate, the cap-weighted index often outperforms. If gains spread to smaller members, equal weight may improve relative to market-cap weighting.
This difference also changes sector exposure and rebalancing costs. Equal weighting is not an automatically better investment strategy. It generally increases exposure to smaller index constituents, adds periodic rebalancing and can behave differently when interest rates rise or liquidity deteriorates. The comparison is useful because it reveals a hidden property of the rally rather than because one benchmark should always be preferred.
Friday provided a counterargument to the “breadthless” label
The latest weekly picture was not uniformly negative. MarketWatch reported an improvement in breadth after nearly two months of narrow AI-led leadership, with the equal-weight S&P 500 outperforming the cap-weighted benchmark over the week. That move matters because a broadening market could support a rally without depending entirely on the largest technology companies. MarketWatch breadth recovery.
One stronger week is not enough to declare a durable rotation. A genuine improvement would likely appear across multiple indicators, including the number of stocks setting new highs, sector leadership, advancing versus declining issues and performance beyond mega-cap technology. Analysts should measure whether the improvement lasts through earnings reports and changing bond yields.
Concentration can coexist with excellent fundamentals
A narrow rally is not always speculative. The largest firms can have stronger cash generation, more diversified customers and exceptional earnings growth. Investors may reasonably prefer them during uncertain periods. The challenge arises if prices incorporate so much favorable news that even strong results cannot meet expectations, while other stocks remain weak because financing conditions and end demand are deteriorating.
The divergence also produces a measurement problem. A highly profitable company may be expensive relative to realistic future growth, while an inexpensive cyclical business may remain cheap because its market is weakening. Breadth alone cannot decide which. Balance sheets, earnings guidance, valuation and sector demand are necessary complements.
Interest rates explain part of the divide
The bond market adds context. Higher Treasury yields can pressure businesses with heavy refinancing needs, property exposure or long-duration anticipated profits. In September, the Fed raised its short-term policy target to 3.75%–4.00%, while the 10-year Treasury yield was above 5% around the October close. Federal Reserve policy statement; H.15 Treasury data.
Large cash-rich businesses may be better equipped to absorb financing costs than weaker borrowers. That difference can cause stock-performance concentration even without a collapse in overall economic activity. If bond yields stabilize, lagging sectors might recover. If credit conditions deteriorate, the headline index could eventually face pressure from weakening profits beyond the biggest winners.
What would make the narrowness dangerous?
Concentration becomes more concerning when the leading companies also lose momentum, estimates are revised downward, credit spreads widen and breadth remains weak. A divergence in which the index climbs while most components trend lower is a warning to examine market fragility. But its interpretation depends on the period and context.
Investopedia reported analysts highlighting the historic narrowness of recent leadership while also considering opportunities in underperforming sectors. That two-sided framing is useful: weakness creates risks for passive headline interpretation, but it can also create pockets of relative value for investors whose horizons and risk tolerance differ. Investopedia market-breadth analysis.
A simple breadth dashboard for news readers
A credible weekly update could include five indicators: percentage of index constituents above their 50-day and 200-day averages; equal-weight versus cap-weight return; new 52-week highs against lows; fraction of sectors gaining over the month; and percentage of earnings estimates revised upward. These measures capture trend, leadership and business performance from different angles.
Publish a date and universe beside every chart. “Forty percent of stocks” is meaningless without specifying S&P constituents, all U.S. listed common shares or an exchange-specific sample. Similarly, price breadth measured on Tuesday should not be attached to Friday’s benchmark close without labeling both dates. A transparent methodology earns more trust than a dramatic title alone.
The practical takeaway
The October stock rally has a hidden divide, but it is not a single-direction forecast. Strong benchmark results and weak individual participation can both be true. The improvement during the latest week is encouraging for broader participation, yet it requires confirmation. Rather than treating the S&P 500 as a complete portrait of corporate America, readers should follow who is actually rising, whether earnings growth is spreading and whether financial conditions permit a durable recovery in lagging groups.
Frequently asked questions
What is market breadth?
A set of measures showing how many stocks participate in a market advance or decline.
Does an all-time S&P 500 high mean most stocks are at highs?
No. Because of index weighting, a minority of large companies can disproportionately drive the benchmark.
Is weak breadth proof a crash is coming?
No. It highlights potential fragility but is not a reliable stand-alone market-timing rule.
Why does equal-weight performance matter?
It offers a second view of index participation and can show when smaller constituents are catching up with mega-cap leaders.
Discover more from The Economy
Subscribe to get the latest posts sent to your email.

Q3 2026 Earnings Preview: Can Record Profit Expectations Keep Wall Street’s Rally Alive?

Russia Diesel Deal 2026: Oil Prices and Inflation Risks

Fed Rates 2026: Treasury Yields, Bonds and SGOV Explained

S&P 500 Market Breadth 2026: Weak Rally or Rotation?

The AI Capex Boom: Data Centers Reshaping Growth

Palantir Stock in 2026: Extraordinary AI Growth

Tesla Physical AI 2026: Robotaxis, Optimus and TSLA Risks

NVIDIA’s AI Grip in 2026: Record Revenue Is Only Half the Investment Story

Hormuz Diesel Shortage: Why Crude Oil Recovery Isn’t Enough

Social Security Extra $90 Deposit: Who Qualifies for the October 2026 Medicare Rebate?

Anthropic Bans Sustained Abuse of Claude AI Under New Usage Policy Effective November 12, 2026

Jeff Bezos Three-Day Workweek View: What He Really Said

Celeste Frozen Pizza Discontinued: What Conagra Confirmed

US–China Critical Minerals Competition: Why a Trade Deal Cannot Fix Every Supply Risk

Oil Prices Break $100 in 2026: Middle East Conflict & Energy Markets

Middle East War Economics 2026: Oil Prices & Energy Markets

China Stocks Today: Are Big Economies in Asia Nearing a Market Bottom?

PSX Forecast 2026: KSE-100, IMF Reviews & Geopolitics

Crypto Daily Outlook: Bitcoin, Altcoins, and the Future of Decentralized Finance

Global Pension Systems Ranked: The World’s Best and Worst Retirement Frameworks

World’s Largest Economies: Ranking the Top Global Powers

Elon Musk’s Next Moves: Disrupting the 2026 Global Economy

Pakistan Economy 2026: Inside the SBP’s Balancing Act

GasBuddy Market Insights: How Crude Price Shifts Impact Local Fuel Cost Averages

World Bank & IMF Reports 2026: Why the “3% Growth” Consensus Is Actually a Debate

Global Equity Market Divergence: US Tech vs. European Dividend Stocks vs. Asian Growth

IMF & World Bank Global Economic Outlook: Growth Forecasts Across Europe and Asia

Stock Market Today: Dow Climbs 500 Points as Markets Shake Off Inflation Jitters
-

 Markets & Finance9 months ago
Top 15 Stocks for Investment in 2026 in PSX: Your Complete Guide to Pakistan’s Best Investment Opportunities
-

 Analysis8 months ago
Johor’s Investment Boom: The Hidden Costs Behind Malaysia’s Most Ambitious Economic Surge
-

 Analysis8 months ago
Top 10 Stocks for Investment in PSX for Quick Returns in 2026
-

 Banks9 months ago
Best Investments in Pakistan 2026: Top 10 Low-Price Shares and Long-Term Picks for the PSX
-

 Analysis8 months ago
Brazil’s Rare Earth Race: US, EU, and China Compete for Critical Minerals as Tensions Rise
-

 Investment9 months ago
Top 10 Mutual Fund Managers in Pakistan for Investment in 2026: A Comprehensive Guide for Optimal Returns
-

 Global Economy10 months ago
15 Most Lucrative Sectors for Investment in Pakistan: A 2025 Data-Driven Analysis
-

 Global Economy10 months ago
Pakistan’s Export Goldmine: 10 Game-Changing Markets Where Pakistani Businesses Are Winning Big in 2025