
Policy
The Biggest Monetary Policy Shift Since the Financial Crisis May Already Be Underway

When PCE inflation — the Federal Reserve’s preferred price gauge — hit 4.1 percent on a year-over-year basis in May 2026, it registered the highest reading since April 2023. It arrived at a moment when global monetary policy is pulled between competing imperatives: the need to restrict demand to contain resurgent price pressures, the exposure of over-leveraged sovereign balance sheets to sustained high rates, and the recognition among some central banks that their economies cannot sustain the current rate environment much longer.
The result is a divergence among major central banks that is as pronounced as any since the post-2008 recovery — and the policy choices made in the next two quarters will shape financial conditions for years.
The US Inflation Resurgence
The Bureau of Economic Analysis data for May 2026 showed the headline PCE price index rising 0.4 percent month-on-month, matching April’s increase, while the core PCE measure — excluding food and energy — rose 0.3 percent. Year-over-year headline PCE accelerating to 4.1 percent, the highest in more than three years, confirms that the disinflation trend that characterised 2024 and early 2025 has materially reversed.
Personal income and personal spending both increased 0.7 percent in May, ahead of consensus estimates, pointing to continued consumer resilience despite elevated prices. Spending increases were led by financial services, healthcare, housing, and energy — categories with limited demand elasticity that do not respond readily to interest rate tightening.
The cityam.com analysis of UK monetary conditions characterised the current juncture as potentially “one of the biggest shifts in monetary policy since the financial crisis” — reflecting both the scale of the inflation resurgence and the degree to which central banks have limited room to manoeuvre given the sovereign debt environment.
Japan: Tightening Into a Spending Plan
Japan presents perhaps the sharpest tension in global monetary policy. The Bank of Japan, under Governor Kazuo Ueda, has been signalling continued rate normalisation. Tokyo’s core CPI — considered a leading indicator of nationwide trends — rose 1.6 percent year-over-year in June, accelerating from 1.3 percent in May, partly due to higher water service fees following the expiration of government subsidies. The first pickup in Tokyo consumer inflation in eight months reinforced BoJ rate-hike expectations.
Simultaneously, Prime Minister Takaichi’s government has unveiled a ¥370 trillion investment programme that requires sustained fiscal expenditure and private capital mobilisation. A central bank tightening into an expansionary fiscal programme creates the sovereign yield tension that is already visible in Japan’s superlong government bond markets, where yields have hit multi-decade highs.
The BoJ has said it sees “upside risks to inflation relative to its 2 percent target” and expects to continue adjusting policy while monitoring risks from the Iran conflict and other factors. The Bank of Japan’s dilemma — normalise rates and complicate the government’s investment agenda, or hold rates and risk entrenching above-target inflation — has no comfortable resolution.
Europe’s Growth Crisis
Germany’s private sector activity contracted in June for the third consecutive month, with the S&P Global Flash Composite PMI declining to 48 — below the 49.9 forecast. UK retail sales fell at a sharp pace in June, with the Confederation of British Industry’s Distributive Trades Survey showing retail volumes drop to a weighted balance of -54, down from -46 in May.
The political instability compounds the economic challenge. Keir Starmer resigned as UK Prime Minister in June following months of political pressure, with the Labour Party now selecting a successor — currently expected to be Andy Burnham. Political transition in the middle of economic deterioration and inflationary pressure creates an uncertain policy environment precisely when clarity is most needed.
The ECB is projected to hold its policy rate at current levels, with expected inflation having stabilised close to the 2 percent target in the eurozone. That relative stability provides more room for European monetary policy than either Japan or the United States currently possess — but Germany’s contraction represents a direct challenge to the eurozone’s growth foundation.
The BIS Warning on Inflation Persistence
The BIS’s 2026 Annual Economic Report included a specific warning about inflation’s potential return that jars with earlier optimism. BIS General Manager Pablo Hernández de Cos noted that the most recent cost-of-living shock “is still in the memory of economic agents” — meaning that inflation expectations are not fully anchored, and that a second energy shock or food price spike could trigger second-round effects more quickly than central banks might anticipate.
The BIS’s concern is that the geopolitical disruption to energy supplies from the Middle East conflict may not have fully worked through the system, that infrastructure damage takes time to rebuild, and that existing price impacts could linger even as political negotiations progress. If that assessment is correct, the current 4.1 percent US PCE reading may not represent a peak — it may represent an early stage of a second inflationary episode arriving before the first has fully resolved.
For markets, the implication is that the rate-cut cycle that many investors have been anticipating may be significantly delayed — and that the interaction between persistent inflation, record sovereign debt, and an AI sector showing early signs of financial strain could constitute the convergence that creates the next systemic stress event.
Discover more from The Economy
Subscribe to get the latest posts sent to your email.


China’s real estate sector, the single largest drag on the world’s second‑largest economy for over three years, is showing the first consistent signs of life. According to the National Bureau of Statistics, new‑home prices in the four tier‑1 cities—Beijing, Shanghai, Guangzhou, and Shenzhen—ticked up 0.2% month‑on‑month in May, the third consecutive monthly increase (National Bureau of Statistics of China, May 2026 Housing Data). While the uptick is modest, it represents a psychological turning point after prices fell for 24 of the previous 30 months. The catalyst: a government‑engineered “white‑list” model that channels credit exclusively to healthy, systemically important developers while allowing weaker players to exit.
The White‑List Project Funding Mechanism
In early 2025, the People’s Bank of China and the Ministry of Housing and Urban‑Rural Development jointly launched the “Real Estate Sector Normalization Facility,” commonly called the white‑list. The mechanism designates about 60 developers—both state‑owned and private—as eligible for new bank lending, bond issuance, and equity refinancing, provided they meet strict criteria: no default history, completion of at least 80% of presold units, and a commitment to “reasonable” pricing. As of May 2026, 1.4 trillion yuan ($195 billion) in new credit had been approved, with 900 billion yuan actually disbursed (PBoC Monetary Policy Implementation Report, Q1 2026). The funds are escrowed and released only against verified construction milestones, a safeguard that prevents the diversion of capital that plagued the Evergrande and Country Garden crises.
This targeted approach is a departure from the indiscriminate liquidity injections of 2023 and 2024. The government has allowed some 35 mid‑tier developers, burdened with unviable projects in third‑ and fourth‑tier cities, to enter bankruptcy restructuring. The message is clear: moral hazard is being contained, and the state will backstop only the core of the housing supply chain. The strategy echoes the US TARP program of 2008, but with Chinese characteristics—directed credit rather than equity injections.
Developer Bond Revival and Equity Rebound
The credit market has responded with surprising enthusiasm. Dollar‑denominated bonds of white‑listed developers have returned 18% year‑to‑date in 2026, making Chinese property high‑yield debt the top‑performing sector in emerging markets (J.P. Morgan EMBI Global China Property Index, June 2026). China Vanke, the bellwether state‑backed firm, saw its 2029 bond price rally from 60 cents on the dollar in January to 92 cents by June. The Shanghai Composite Real Estate Index has climbed 22% from its February lows, though it remains 55% below its 2020 peak.
Investor confidence is being slowly rebuilt by the white‑list’s transparency. Regular updates on fund disbursement, project completion rates, and sales data create a data‑driven narrative that contrasts with the opacity of the Evergrande era. Analysts at UBS now forecast that the sector’s contribution to GDP, which swung from a positive 1% to a negative 2.5% drag between 2021 and 2025, could be nearly neutral by Q4 2026 (UBS China Real Estate Outlook, June 2026).
Fragile Recovery: Tier‑City Divergence
Beneath the headline stabilization, a stark divergence persists. Tier‑1 and strong tier‑2 cities like Hangzhou and Nanjing are seeing inventory drawdowns, and some have even reinstated cooling measures to prevent a rapid rebound. In contrast, tier‑3 and tier‑4 cities, which account for 60% of national housing stock by area, remain oversupplied. Inventories in these cities stand at 28 months of sales, against a healthy benchmark of 12–14 months. The government has recently approved a 500‑billion‑yuan relending facility for local government‑owned platforms to purchase unsold completed apartments and convert them into affordable rental housing, a measure reminiscent of the Spanish “bad bank” (Sareb) model (State Council of China, Notice on Affordable Housing Facility, April 2026). This should gradually absorb excess stock, but the process will take years.
The consumer side remains hesitant. Despite the PBOC cutting the five‑year loan prime rate to 3.6%, household leverage is already elevated, and the “precautionary savings” motive is strong. A People’s Bank survey found that 63% of urban households consider now a “bad time” to buy a home, down from 72% in 2024 but still high. The culture of speculative property investment, which drove decades of growth, has been broken—perhaps permanently. The market is transitioning to one driven by genuine end‑user demand and demographic fundamentals.
The Macro Impact and Policy Outlook
A stable housing market removes the largest downside risk to China’s 2026 GDP growth target of “around 5%.” Construction‑related industries, from steel to appliances, are seeing restocking demand. The financial system’s exposure to real estate, estimated at 40% of bank collateral, becomes less perilous if prices cease falling and transaction volumes recover. The PBOC, now more comfortable with the property outlook, can focus on managing the exchange rate and domestic liquidity without being forced into ad‑hoc bailouts.
Going forward, the test will be whether the white‑list model can catalyze a self‑sustaining recovery. Key indicators to monitor are floor space sold (recovering slowly), new starts (still contracting), and the time taken to complete presold homes (improving). The government’s commitment to “housing is for living, not speculation” remains unchanged, but the policy toolkit has evolved from crackdown to calibrated support. If the tier‑1 price stabilization spreads to second‑tier cities in the autumn, China’s housing market turnaround will be confirmed, providing a significant tailwind to global commodity demand and emerging market sentiment.
Discover more from The Economy
Subscribe to get the latest posts sent to your email.
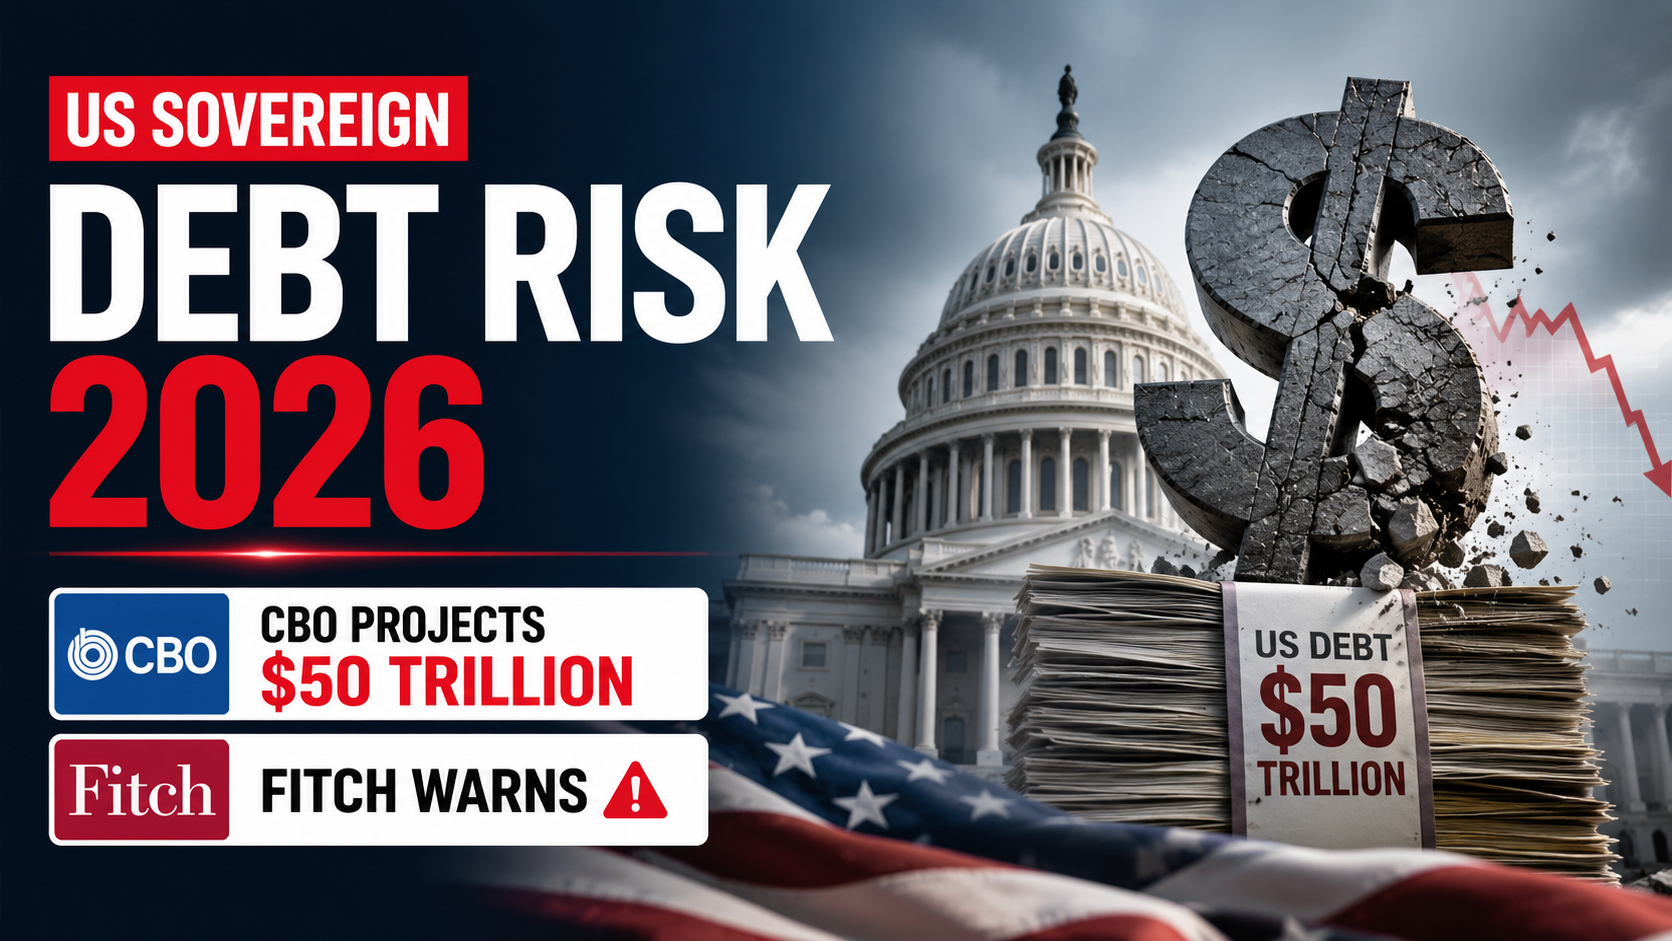
The United States government’s gross debt has crossed the $50 trillion threshold, reaching 120% of GDP, according to the Congressional Budget Office’s Long‑Term Budget Outlook released on June 10, 2026 (CBO Long‑Term Budget Outlook, June 2026). The sheer size of the number is arresting, but the market’s focus is on the trajectory: the CBO projects that, under current law, debt will hit 140% of GDP by 2036 and that net interest costs will exceed defense spending by 2029. In response, Fitch Ratings placed the United States’ AAA sovereign rating on negative watch, citing “entrenched political polarization that prevents timely and credible fiscal consolidation” (Fitch Ratings, June 2026). This is the most serious warning on US sovereign credit since the 2011 debt‑ceiling standoff.
The Debt Dynamics
The drivers of the debt surge are not a secret. Mandatory spending—Social Security, Medicare, Medicaid, and other health programs—now consumes 65% of federal outlays. Net interest, propelled by higher rates and a larger debt stock, accounts for another 16%. Discretionary spending on defense, infrastructure, education, and everything else has been squeezed to just 19%. The CBO notes that the retirement of the baby‑boom generation is accelerating: by 2026, the Social Security trust fund’s outlays exceed its payroll‑tax revenue by $350 billion annually, and the Hospital Insurance trust fund is on track to be depleted by 2032.
The Treasury market, the deepest and most liquid in the world, has started to signal discomfort. The term premium on 10‑year notes—the extra yield investors demand to hold longer‑term bonds instead of rolling short‑term bills—has risen to 0.6 percentage points, up from near zero in 2021. This is partly a function of increased supply: the Treasury auctioned a record $4.5 trillion in gross marketable debt in fiscal 2025, and the figure for 2026 is on pace to exceed $5 trillion. A recent auction of 20‑year bonds tailed by three basis points, indicating weaker‑than‑expected demand (US Treasury Department, June 2026 Auction Results).
Foreign Official Buyers Step Back
A critical source of Treasury demand—foreign central banks and sovereign wealth funds—has been pulling back. Data from the Treasury International Capital (TIC) system show that Japan and China, the two largest foreign holders, reduced their combined holdings by $210 billion over the 12 months through April 2026 (US Treasury TIC Data, June 2026). Japan is selling to finance intervention in the yen, while China is diversifying into gold and strategic commodities. OPEC nations, led by Saudi Arabia, have also been net sellers, redirecting petrodollar surpluses into real estate, private credit, and gold (see Article 18). The share of US Treasury debt held by foreigners has fallen to 23%, the lowest since 2003.
This retreat is not a panic sell‑off, but it changes the character of demand. It leaves a greater burden on domestic buyers—pension funds, insurance companies, and mutual funds—who are more price‑sensitive and constrained by regulatory limits. The Fed, which is still reducing its balance sheet through quantitative tightening at a pace of $60 billion per month, is no longer a buyer. The residual buyer of last resort is the Treasury market’s own depth, but episodes of illiquidity, such as the March 2025 flash crash, highlight the fragility under the surface.
The Fitch Warning and Political Paralysis
Fitch’s negative watch is a procedural step that gives the US government a six‑month window to demonstrate credible fiscal reforms before a formal downgrade. The 2011 precedent, when S&P downgraded the US, led to a sharp equity sell‑off and an ironic rally in Treasuries as risk‑aversion spiked. But 2026 is different: inflation is higher, global capital is more mobile, and there is a credible alternative in the euro and digital payment systems. A downgrade this time could trigger a sustained sell‑off in long‑duration bonds and push the 10‑year yield above 6%, according to a stress scenario modeled by the Brookings Institution (Brookings, “Fiscal Risks in an Era of High Debt”, June 2026).
The political response has been underwhelming. The June 2026 budget resolution passed by the House calls for a commission to study “fiscal sustainability options,” a mechanism that has failed repeatedly in the past. The Senate is gridlocked over whether to raise revenues through tax increases on corporations and high‑income individuals—the Biden administration’s preferred path—or to cut mandatory entitlements, which remains a political third rail. The debt limit, suspended in June 2023 until January 2025, was extended again until March 2027 in a late‑night deal that avoided default but added $1.2 trillion in new spending over two years. “We are in the classic ‘too little, too late’ danger zone,” noted a former CBO director in an op‑ed for the Wall Street Journal.
Treasury Market Stress and Investor Hedges
For investors, the rising risk of a sovereign credit scare is translating into portfolio adjustments. The classic hedge—gold—has rallied to $2,500 per ounce, supported not just by geopolitical uncertainty but also by a structural shift in central bank reserve management. Treasury Inflation‑Protected Securities (TIPS) have underperformed due to weak inflation breakeven demand, but short‑duration nominal Treasuries are still viewed as safe. The real innovation is in outcome‑based hedging: several large institutional investors have purchased long‑dated options on US rates volatility, betting that a fiscal confidence shock will cause a spike in the MOVE index (CME Group, June 2026 Options Open Interest Data).
Equity‑wise, sectors with pricing power and low reliance on government contracts are favored. Defense stocks are a paradox: they benefit from rising budgets but are vulnerable to a fiscal crunch that targets discretionary spending. International diversification, particularly into Indian and Southeast Asian assets, is being pitched as a hedge against a US‑centric debt problem.
The Bottom Line
America’s $50 trillion debt is not an immediate crisis, but it is a steadily tightening vice. The CBO’s projections are not worst‑case scenarios; they assume no recession, no major war, and interest rates that gradually moderate—all optimistic assumptions. The Fitch warning is a shot across the bow, a reminder that the world’s reserve currency issuer does not have an infinite credit card. The path to stabilization requires an unlikely combination of political courage and economic luck. Without it, the US will find itself in a slow‑motion fiscal trap that erodes the dollar’s primacy and raises borrowing costs for every American household and business.
Discover more from The Economy
Subscribe to get the latest posts sent to your email.
Having lost its most powerful tariff tool in the Supreme Court, the Trump administration has found a new one — and it comes with a moral argument attached.
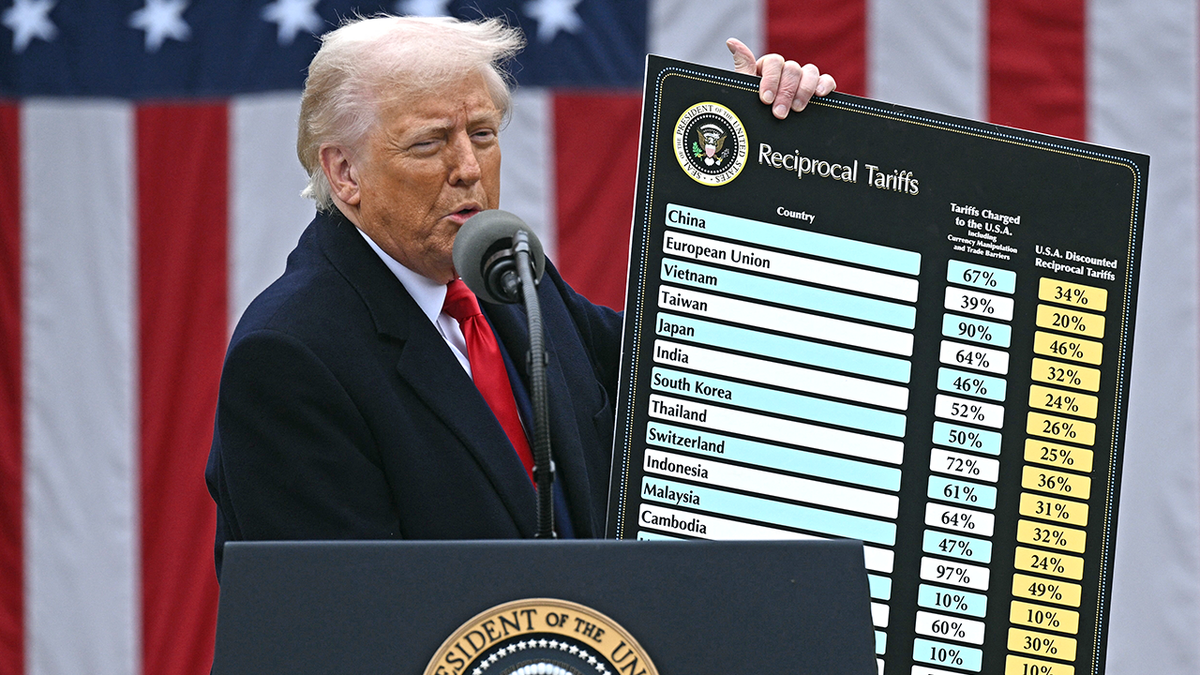
On June 2, 2026, the Office of the United States Trade Representative concluded 60 simultaneous Section 301 investigations, finding that each of the targeted economies had failed to impose or effectively enforce a prohibition on the importation of goods produced with forced labour. The proposed remedy: additional tariffs of 10% to 12.5% on all imports from those economies, covering 99.4% of total US imports by origin. The scope is unprecedented. It sweeps in China, the European Union, Japan, India, Vietnam, Australia, South Korea, and 52 other trading partners in a single action.
The Legal Architecture Post-Supreme Court
The context matters. In February 2026, the US Supreme Court struck down most of President Trump’s “Liberation Day” emergency tariffs, ruling that they exceeded the executive’s authority under the International Emergency Economic Powers Act (IEEPA). That decision dismantled the headline tariff architecture the administration had built over 2025. Rather than abandon the strategy, the Trump administration pivoted to legal frameworks with stronger statutory grounding. Section 301 of the Trade Act of 1974 authorises the president to impose levies to counter foreign trade practices that are “unreasonable or discriminatory and burden or restrict U.S. commerce” — a standard that the USTR has now applied to forced labour enforcement failures.
The investigations were formally initiated on March 12, 2026, with public hearings drawing testimony from nearly 60 witnesses and 500 written comments over April and May. The USTR’s findings drew a direct causal link between inadequate forced labour enforcement and competitive harm to US companies and workers.
The Rate Architecture
The proposed tariff structure creates two tiers. Economies that have adopted full or partial forced labour import prohibitions — notably Canada, Mexico, and a handful of others — would face 10% additional duties. The remaining 45 economies, including China, India, Japan, Vietnam, Australia, and New Zealand, would face 12.5% additional duties. A separate textile mechanism would allow a capped volume of apparel and textile imports from certain economies at a reduced rate. Electronics and AI-related products are widely expected to carry significant exemptions, according to the Economist Intelligence Unit.
The public comment period closes July 6, 2026, with hearings beginning July 7. The duties are not yet in effect — but for companies sourcing from any of the 60 targeted economies, the window to map exposure and file comments is rapidly closing.
Trading Partners Push Back
Responses from affected governments were swift and uniformly dismissive of the USTR’s reasoning. Beijing‘s commerce ministry spokesperson stated flatly that “there is no so-called forced labor in China,” and that Washington and Beijing should “meet each other halfway.” China’s foreign ministry called the accusations politically motivated.
The European Union is in a particularly complex position. Brussels signed a broad bilateral trade agreement with Washington in 2025, which the European Parliament ratified. The proposed new tariffs — which the EU called “unjustified” — would come on top of the existing 15% tariff framework from that deal. The USTR’s own report acknowledged that the EU’s anti-forced-labour regulation only entered into force in December 2027 and lacks certain enforcement elements — giving the administration its statutory foothold. The chair of the European Parliament’s trade committee described the determination as “utterly absurd” given the 2024 EU forced labour import ban law.
France‘s government questioned whether the investigation reflected genuine concerns, with officials suggesting a tariff measure was “sought first, and only then is a suitable legal justification found.”
The Supply Chain Reality for Multinationals
For global supply chain managers, the practical implications are immediate regardless of the final duty levels. The Clark Hill law firm’s trade practice advised clients to map exposure against the 60 targeted economies by HTS code, model the 10% and 12.5% rate scenarios, and test exclusion eligibility before assuming coverage — noting that even partial exposure in electronics supply chains could run to billions in added costs at scale.
Nick Marro of the Economist Intelligence Unit told CNBC that he expects the Trump administration to “unleash further investigations and tariff announcements in preparation for renewed rounds of trade talks,” characterising the Section 301 action as part of a broader pattern of building leverage ahead of bilateral negotiations. The July 24 expiration of the separate 10% baseline tariff imposed under Section 122 adds another inflection point to the calendar.
For the global trading system, the implication is clear: the US high-tariff era is not over; it has simply found a new statutory vehicle.
Discover more from The Economy
Subscribe to get the latest posts sent to your email.

Russia’s Sanctioned Oil Giants Regain 57% Export Share via Shadow Fleet

UBS Report: Billionaire Wealth Up 25% on AI Boom as Median Wealth Falls

Private Credit Warning: Most BDCs Turn Unprofitable in 2026, Reuters Finds

Bank of England AI Kill Switch vs Singapore MAS Agentic AI Rules

China Hedge Funds Warn Global AI Stocks Are a ‘Super Bubble’

JPMorgan Warns AI Cyberattacks Could Trigger Next Banking Crisis

The Biggest Monetary Policy Shift Since the Financial Crisis May Already Be Underway

The $2 Trillion Shadow: Private Credit’s Quiet Crisis and What It Means for Global Markets

Climate Change Is No Longer a Future Risk to Finance. It Has Arrived.

$109 Trillion and Counting: How the World’s Sovereign Debt Crisis Is Being Built in Plain Sight

South Korea’s Won Slides to Its Weakest Since Lehman: Asia market impact

Japan’s $2.3 Trillion Bet: Takaichi’s AI-Semiconductor Moonshot and the Fiscal Tightrope It Requires

A 13% Surge in Billionaires, a Falling Median: The AI Boom’s Wealth Paradox

The Next Banking Crisis Won’t Come From Bad Loans. JPMorgan Says It Will Come From Hackers.

PwC China Partner Payouts Cut Amid Evergrande Audit Fraud

Investors Pile Into Bullish Dollar Bets as ‘US Exceptionalism’ Trade Returns

Broadcom Market Value Loss: Revenue Forecast Disappoints

Here’s How Much It’ll Cost You to Be Part of SpaceX’s Record-Breaking $75 Billion IPO

Nasdaq Tumbles 4% as Chip and Memory Stocks Sink: A $1.2 Trillion Wipeout

How to Fix Pakistan’s Debt Economy: A Structural Blueprint

Japan’s Nikkei Scales Record Peak as AI Shares Track US Chip Rally

Grinding the Already Ground: Pakistan’s Inflation Crisis

Smash Capital Leads $200M Funding for Allen Control Systems

Democrats Draw a Red Line Around Military AI — And the Pentagon Is Already Pushing Back

JPMorgan Cuts Anthropic AI Access in Hong Kong

New Investment Super-Cycle: AI, Green Energy & Re-Shoring

Xponential Fitness Franchise Lawsuit: The $3.97M Judgment

Middle East Conflict Oil Prices: The $4 Surge Explained
-

 Markets & Finance6 months ago
Top 15 Stocks for Investment in 2026 in PSX: Your Complete Guide to Pakistan’s Best Investment Opportunities
-

 Analysis4 months ago
Top 10 Stocks for Investment in PSX for Quick Returns in 2026
-

 Analysis5 months ago
Brazil’s Rare Earth Race: US, EU, and China Compete for Critical Minerals as Tensions Rise
-

 Analysis4 months ago
Johor’s Investment Boom: The Hidden Costs Behind Malaysia’s Most Ambitious Economic Surge
-

 Banks6 months ago
Best Investments in Pakistan 2026: Top 10 Low-Price Shares and Long-Term Picks for the PSX
-

 Investment6 months ago
Top 10 Mutual Fund Managers in Pakistan for Investment in 2026: A Comprehensive Guide for Optimal Returns
-

 Global Economy6 months ago
15 Most Lucrative Sectors for Investment in Pakistan: A 2025 Data-Driven Analysis
-

 Global Economy6 months ago
Pakistan’s Export Goldmine: 10 Game-Changing Markets Where Pakistani Businesses Are Winning Big in 2025