
Policy
The Biggest Monetary Policy Shift Since the Financial Crisis May Already Be Underway


When PCE inflation — the Federal Reserve’s preferred price gauge — hit 4.1 percent on a year-over-year basis in May 2026, it registered the highest reading since April 2023. It arrived at a moment when global monetary policy is pulled between competing imperatives: the need to restrict demand to contain resurgent price pressures, the exposure of over-leveraged sovereign balance sheets to sustained high rates, and the recognition among some central banks that their economies cannot sustain the current rate environment much longer.
The result is a divergence among major central banks that is as pronounced as any since the post-2008 recovery — and the policy choices made in the next two quarters will shape financial conditions for years.
The US Inflation Resurgence
The Bureau of Economic Analysis data for May 2026 showed the headline PCE price index rising 0.4 percent month-on-month, matching April’s increase, while the core PCE measure — excluding food and energy — rose 0.3 percent. Year-over-year headline PCE accelerating to 4.1 percent, the highest in more than three years, confirms that the disinflation trend that characterised 2024 and early 2025 has materially reversed.
Personal income and personal spending both increased 0.7 percent in May, ahead of consensus estimates, pointing to continued consumer resilience despite elevated prices. Spending increases were led by financial services, healthcare, housing, and energy — categories with limited demand elasticity that do not respond readily to interest rate tightening.
The cityam.com analysis of UK monetary conditions characterised the current juncture as potentially “one of the biggest shifts in monetary policy since the financial crisis” — reflecting both the scale of the inflation resurgence and the degree to which central banks have limited room to manoeuvre given the sovereign debt environment.
Japan: Tightening Into a Spending Plan
Japan presents perhaps the sharpest tension in global monetary policy. The Bank of Japan, under Governor Kazuo Ueda, has been signalling continued rate normalisation. Tokyo’s core CPI — considered a leading indicator of nationwide trends — rose 1.6 percent year-over-year in June, accelerating from 1.3 percent in May, partly due to higher water service fees following the expiration of government subsidies. The first pickup in Tokyo consumer inflation in eight months reinforced BoJ rate-hike expectations.
Simultaneously, Prime Minister Takaichi’s government has unveiled a ¥370 trillion investment programme that requires sustained fiscal expenditure and private capital mobilisation. A central bank tightening into an expansionary fiscal programme creates the sovereign yield tension that is already visible in Japan’s superlong government bond markets, where yields have hit multi-decade highs.
The BoJ has said it sees “upside risks to inflation relative to its 2 percent target” and expects to continue adjusting policy while monitoring risks from the Iran conflict and other factors. The Bank of Japan’s dilemma — normalise rates and complicate the government’s investment agenda, or hold rates and risk entrenching above-target inflation — has no comfortable resolution.
Europe’s Growth Crisis
Germany’s private sector activity contracted in June for the third consecutive month, with the S&P Global Flash Composite PMI declining to 48 — below the 49.9 forecast. UK retail sales fell at a sharp pace in June, with the Confederation of British Industry’s Distributive Trades Survey showing retail volumes drop to a weighted balance of -54, down from -46 in May.
The political instability compounds the economic challenge. Keir Starmer resigned as UK Prime Minister in June following months of political pressure, with the Labour Party now selecting a successor — currently expected to be Andy Burnham. Political transition in the middle of economic deterioration and inflationary pressure creates an uncertain policy environment precisely when clarity is most needed.
The ECB is projected to hold its policy rate at current levels, with expected inflation having stabilised close to the 2 percent target in the eurozone. That relative stability provides more room for European monetary policy than either Japan or the United States currently possess — but Germany’s contraction represents a direct challenge to the eurozone’s growth foundation.
The BIS Warning on Inflation Persistence
The BIS’s 2026 Annual Economic Report included a specific warning about inflation’s potential return that jars with earlier optimism. BIS General Manager Pablo Hernández de Cos noted that the most recent cost-of-living shock “is still in the memory of economic agents” — meaning that inflation expectations are not fully anchored, and that a second energy shock or food price spike could trigger second-round effects more quickly than central banks might anticipate.
The BIS’s concern is that the geopolitical disruption to energy supplies from the Middle East conflict may not have fully worked through the system, that infrastructure damage takes time to rebuild, and that existing price impacts could linger even as political negotiations progress. If that assessment is correct, the current 4.1 percent US PCE reading may not represent a peak — it may represent an early stage of a second inflationary episode arriving before the first has fully resolved.
For markets, the implication is that the rate-cut cycle that many investors have been anticipating may be significantly delayed — and that the interaction between persistent inflation, record sovereign debt, and an AI sector showing early signs of financial strain could constitute the convergence that creates the next systemic stress event.
Discover more from The Economy
Subscribe to get the latest posts sent to your email.


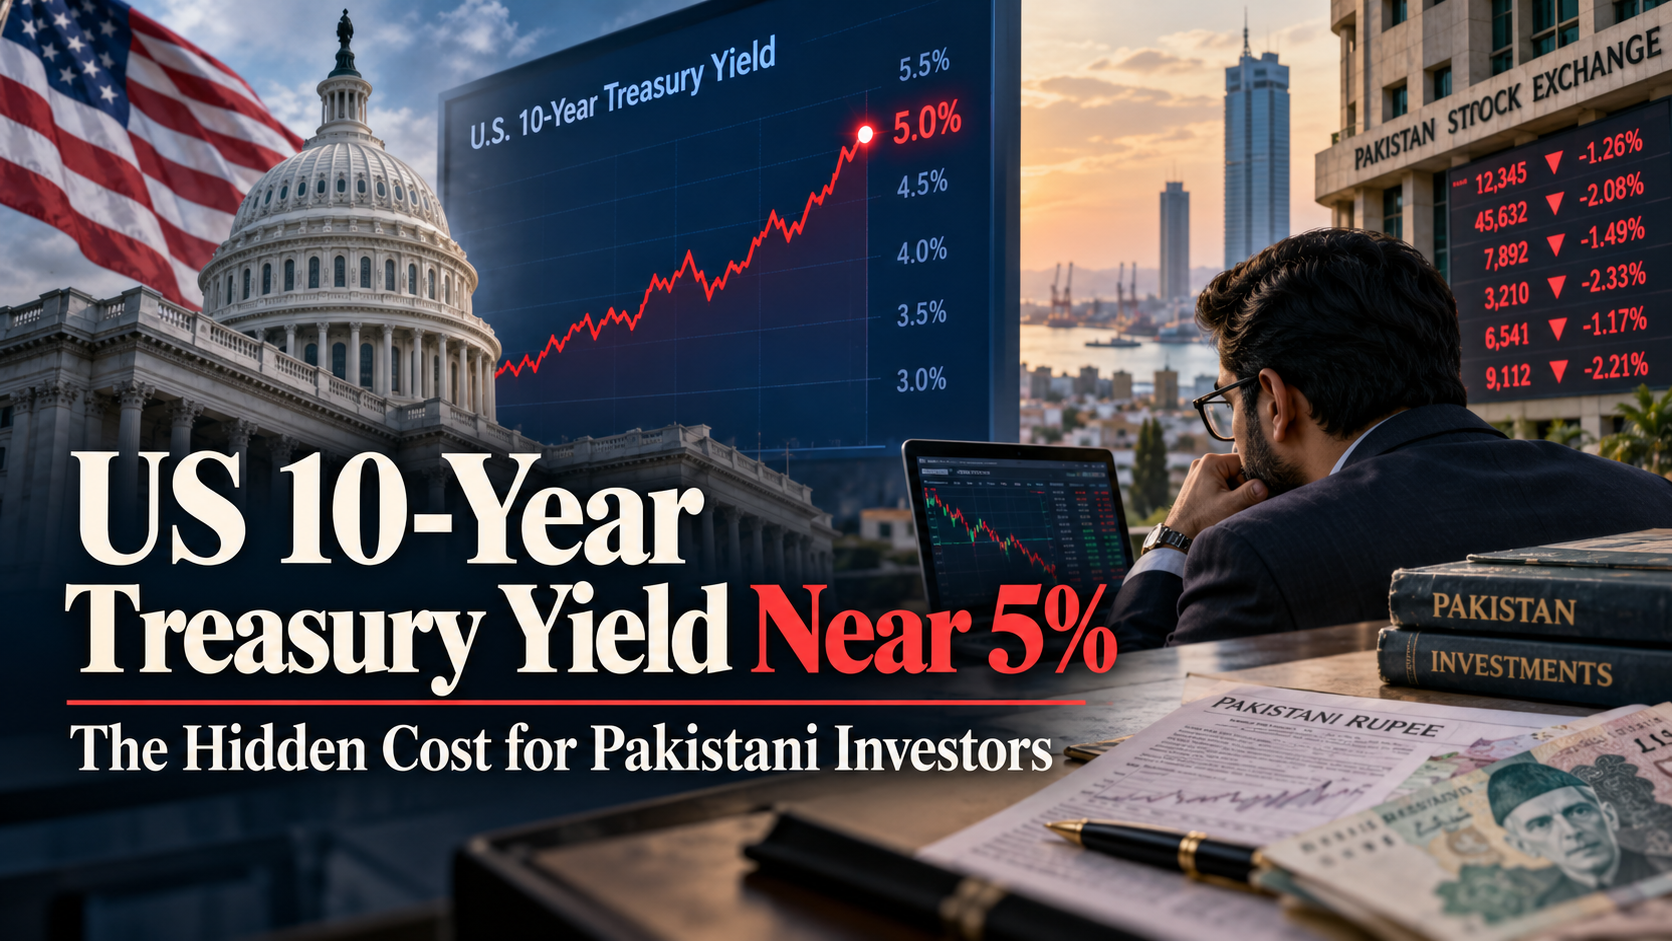
A US government bond can change the required return on a Pakistani investment without a single dollar physically crossing the border. The link runs through a basic idea: when a benchmark asset yields more, investors demand a stronger reason to take additional currency, liquidity and credit risks elsewhere.
The yield on the US 10-year Treasury stood near 5.00% on October 23, 2026, after reaching about 5.24% on October 9, according to historical Treasury-yield data. The user-friendly phrase above 5% should therefore be treated as a description of much of October, not a guaranteed quote for every moment of the latest trading day.
A bond yield is not a savings-account rate
A government-bond yield is the return implied by its market price and promised cash flows, assuming the relevant payment and holding assumptions. When investors sell an existing fixed-coupon bond and its price falls, its yield typically rises. That inverse relationship is central to interpreting the US Treasury market.
The 10-year yield reflects a mixture of expected short-term policy rates, expected inflation and a term premium for holding longer-dated debt. It can fall even while central-bank inflation concerns persist, for example if growth fears rise or investor demand for safe securities strengthens. Reading any single yield move as a pure Fed forecast is a mistake.
Four ways it reaches Pakistan
1. Dollar funding becomes a tougher benchmark. Investors weighing dollar-denominated assets may compare emerging-market returns with those available in US government debt. Pakistani external bonds must compensate for additional sovereign and market risk, although observed spreads change independently of benchmark yields.
2. Currency calculations shift. A domestic bond offering a high rupee yield can still disappoint a foreign investor if depreciation erodes converted returns. For Pakistani investors with future dollar obligations, currency exposure is similarly relevant.
3. Valuations face a higher discount rate. Equity valuations are sensitive to the interest rate used to discount expected future earnings. Companies promising distant profits may be more exposed than businesses generating cash immediately, but there is no perfect sector rule.
4. Sovereign refinancing risk draws scrutiny. Global debt investors assess not only current yields but also how costly it will be for governments to refinance existing obligations. Local T-bills and PIBs are nevertheless priced mainly by Pakistan-specific inflation, liquidity, central-bank policy and credit conditions; US yields do not mechanically set auction cutoffs.
The price-risk example
Imagine a fixed-coupon bond with a duration of seven years. A one-percentage-point increase in yields would imply an approximate 7% price decline, all else equal, using the basic duration approximation. That is not a prediction and not an exact valuation; convexity, yield-curve changes and cash-flow structure matter. It illustrates why holding a bond fund is different from locking in a bank deposit.
Duration risk also works in reverse: bond prices can rise when market yields fall. An investor buying only because the quoted coupon looks attractive may discover later that the resale price has moved against them.
What the latest global backdrop adds
The Federal Reserve raised its policy range to 3.75%–4.00% in September, amid persistent inflation concerns. At the same time, oil-market instability has made imported inflation a more acute concern for Pakistan. The IMF’s October World Economic Outlook forecasts 3.1% world growth for 2026 and highlights downside risks from conflict and financing strains.
This combination means bond yields may be high for reasons that are not benign. A superficially attractive yield could reflect inflation anxiety, fiscal uncertainty or a global risk premium. Investors need to ask why the yield is high, not just how high it is.
A useful comparison table
| Asset | Return quoted in | Main extra risk to examine |
|---|---|---|
| US 10-year Treasury | USD | Duration, inflation, reinvestment |
| Pakistan T-bill | PKR | Domestic rate/inflation, reinvestment |
| Pakistan Investment Bond | PKR | Duration, inflation, liquidity |
| Pakistan dollar bond | USD | Sovereign credit spread, liquidity, duration |
| PSX equity | PKR | Earnings, valuation, currency and market risk |
Currency hedging is not a free lunch
A Pakistani saver comparing foreign-currency investments with domestic government paper must think about more than headline yield. Converting rupees to dollars and back can involve spreads, banking charges, legal requirements and foreign-exchange movement. A hedging instrument, where available and suitable, usually embeds a cost related to interest-rate differences and market conditions. It cannot simply erase currency risk without consequence.
Tax treatment also matters. A quoted yield before withholding tax, custody expense or fund fees is not comparable with an after-tax return from another product. Similarly, a dollar asset can generate a positive dollar return but a different return in rupees. The investor should calculate both if future expenses are split between currencies.
For institutional portfolios, bond duration and liquidity become central. A long-maturity bond may have an attractive yield to maturity but be unsuitable for liabilities due next month. For individuals, the ability to meet an emergency expense without selling at a loss may be worth more than an extra percentage point of advertised return.
The sound comparison is liability-matched, not headline-driven: decide when the money is needed, in what currency and how much market-price movement is tolerable before selecting an asset.
Does a 5% US yield mean Pakistan must offer 5% plus a fixed margin?
No. Each instrument differs in currency, maturity, credit, liquidity and taxation; spreads vary with markets and policy.
Are US Treasuries risk-free?
They are commonly treated as a benchmark for dollar credit risk, but their market prices are not risk-free. Inflation and interest-rate changes can erode purchasing power and resale value.
What should a Pakistani retail investor do first?
List liabilities by currency and timing, then compare instruments on an after-tax, after-inflation and liquidity-adjusted basis. Seek licensed guidance where suitable.
The takeaway: a 5% US benchmark changes the world’s price of patience. Pakistani investors should respond by measuring real cash flows and risks, not by chasing whichever country advertises the biggest nominal yield.
Discover more from The Economy
Subscribe to get the latest posts sent to your email.

The Federal Reserve’s next interest-rate decision is scheduled for October 28, 2026, at the conclusion of a two-day Federal Open Market Committee meeting. For investors in Karachi, New York or Kuala Lumpur, the question is bigger than whether the Fed raises rates by another quarter point. It is whether persistent inflation and an energy shock will keep global financing conditions restrictive for longer.
The Federal Reserve’s September 16 statement confirmed a 25-basis-point increase in the federal funds target range to 3.75%–4.00%. The official October calendar fixes the next announcement for Wednesday, October 28. Predictions about the decision remain predictions until the statement is published.
Why the market cannot simply assume a hold
The Fed faces two forces pulling in different directions. A resilient US economy can withstand tighter financial conditions better than a slowing one, while high energy prices can feed inflation expectations. At the same time, tightening further risks increasing pressure on rate-sensitive sectors and debt-servicing costs. The September meeting minutes describe concern about elevated inflation and the geopolitical backdrop.
Traders often express their expectations through futures pricing, but a specific percentage quoted earlier in October may no longer be representative on October 25. A responsible preview should avoid presenting an old implied probability as a live market estimate. The announcement, accompanying statement and press conference deserve more attention than any one probability screen.
The three policy scenarios
Hold, with a hawkish message. The Fed leaves its target at 3.75%–4.00% but stresses persistent inflation. Treasury yields and the dollar could remain firm if investors infer that further increases are possible. A hold is not necessarily dovish.
Another 25-basis-point rise. A new increase could push short-term dollar funding costs higher, depending on whether it is already priced in. For emerging markets, this may sharpen competition for capital and raise the hurdle rate for risky assets.
Hold, with a softer outlook. If the language signals growing confidence on inflation, longer yields might ease and investors could reassess the attractiveness of emerging-market equities and bonds. Any such response would also depend on earnings, geopolitics and risk appetite.
How the Fed reaches the Pakistan Stock Exchange
The direct transmission is limited by Pakistan’s domestic policy and market structure, but there are real channels. The first is the US dollar: a stronger dollar can raise the local price of imports and influence emerging-market currency expectations. The second is global yields: investors compare returns across sovereign debt markets and require compensation for currency and credit risks. The third is equity valuation: higher discount rates can reduce the present value of future corporate earnings, particularly for expensive growth assets.
For Pakistan, imported energy complicates that picture. If a Fed hike reflects sticky US inflation linked to oil, local investors must evaluate both international monetary tightening and Pakistan’s own fuel-import exposure. The World Bank’s Pakistan Development Update reports improving macroeconomic conditions but also acknowledges conflict-related pressure.
Bonds versus stocks: the difference matters
Pakistan Treasury bills and investment bonds primarily respond to domestic rates, inflation expectations, liquidity and sovereign risk. Their yields need not mirror US Treasuries day for day. PSX sectors also differ: banks, exporters, highly leveraged firms and energy producers can react quite differently to the same exchange-rate or interest-rate surprise.
A simplistic Fed hikes, PSX falls formula misses positioning. Prices often move on the gap between expectations and the actual decision. Even a rate hike can coincide with a stock rally if the market expected a larger move or welcomes clarity.
A practical announcement-day checklist
| Watch | Why |
|---|---|
| Fed funds target range | Immediate policy decision |
| Statement language on inflation | Signal for coming meetings |
| Treasury yield reaction | Changing dollar discount rates |
| Dollar index and EM currencies | Cross-border risk sentiment |
| Brent crude | Separate but powerful inflation channel |
| Pakistan KIBOR, rupee and SBP communications | Local transmission |
The IMF’s October outlook cautions that energy importers outside the AI investment value chain have a difficult growth outlook. This makes risk diversification and the distinction between nominal yields and real returns especially relevant.
Why the press conference may matter more than the quarter-point move
Central-bank announcements bundle several messages. A policy-rate decision tells markets what the committee did today. The statement signals which risks officials emphasise. The chair’s subsequent explanations can change expectations about the next several meetings. Traders may initially react to the rate itself, then reverse direction as they digest the path implied by the language.
For emerging-market investors, that distinction is crucial. A 25-basis-point increase accompanied by confidence that inflation pressure is subsiding may prove less restrictive for global risk appetite than an unchanged rate accompanied by warnings of more tightening. The yield curve, dollar and market-implied path are useful contemporaneous checks, although each has competing drivers.
Pakistan-based investors should also consider market hours. US decisions may arrive after domestic exchanges have closed, while other Asian markets trade the following session. A next-day index move can reflect overnight global earnings or geopolitical events as well as the Fed. Attribution requires comparing the timing of all material news.
For a rigorous post-meeting update, include the exact target range, vote, key wording changes and a timestamped Treasury yield. Replace the scenarios with the actual decision rather than leaving the preview to masquerade as a live result.
When will the Fed decision be released?
The Fed lists the October 27–28 meeting and a 2 p.m. Eastern announcement on October 28. Verify time conversion and possible schedule changes before publishing a live ticker.
Is a rate hike guaranteed?
No. September’s action and October’s risks do not predetermine the committee’s vote.
Should Pakistani investors sell stocks because of the Fed?
There is no universal answer. Investment time horizon, portfolio concentration, company balance sheets and currency exposure matter more than a one-day headline.
Bottom line: October 28 is a test of the Fed’s inflation tolerance. For Pakistan, the most important signal will be how the decision reshapes the dollar, energy costs and global demand for emerging-market risk—not the label hike or hold alone.
Discover more from The Economy
Subscribe to get the latest posts sent to your email.
The global economic growth is becoming more uneven, capital is increasingly sensitive to financing costs, and investors must distinguish a convincing story from an investable price. This guide focuses on research methods and risks rather than predictions of guaranteed returns. The IMF October 2026 outlook projects 3.1% global growth and 4.7% inflation for 2026, while the IMF financial-stability assessment warns that market resilience coexists with important vulnerabilities.
Key takeaways
- Match each investment decision to its time horizon, currency and ability to withstand losses.
- Separate observable earnings or contractual cash flows from optimistic forecasts.
- Compare diversification, fees, taxes, liquidity and regulatory restrictions before committing capital.
- Track primary institutional evidence and update assumptions when conditions change.
- Readers in Pakistan should consider rupee exposure and availability of regulated investment channels.
Why this matters now
The central question behind gold vs dollar vs bitcoin 2026 is not merely what may happen next. It is which economic mechanisms could change cash flow, purchasing power or risk. The Bank for International Settlements’ 2026 review describes an economy supported by technological investment but constrained by geopolitical and fiscal pressures. A robust financial plan must therefore survive both a favourable and an adverse scenario.
Three assets, three different economic functions
Gold is a scarce physical asset without a contractual cash flow. The dollar is a currency used for transactions, reserve holdings and dollar liabilities; holding dollars is not the same as owning an inflation-protected investment. Bitcoin is a highly volatile digital asset whose long-run response to inflation cannot be assumed stable. The comparison depends on which inflation and which home currency the investor faces. See the primary institutional research.
For practical analysis, separate the baseline, the upside case and the downside case. Document the specific development that would change your assessment. Assess timing: a promising long-term theme may still be inappropriate for cash needed within twelve months.
Why gold has attracted investment demand
The World Gold Council reported resilient investment demand during 2026 and a recovery in central-bank purchasing in the second quarter. That is evidence of demand, not a promise of rising prices. Gold can fall when real interest rates rise, the dollar strengthens or investors liquidate positions. Storage, spreads and insurance matter for physical buyers. See the primary institutional research.
For practical analysis, separate the baseline, the upside case and the downside case. Document the specific development that would change your assessment. Assess timing: a promising long-term theme may still be inappropriate for cash needed within twelve months.
The dollar: liquidity versus purchasing power
Foreign-currency balances may reduce exposure to a depreciation of the investor’s home currency, but US inflation still erodes dollar purchasing power. Cash in a bank has different legal protection and returns from banknotes held privately. A Pakistani household paying future US-dollar tuition has a genuine dollar liability; a household buying groceries in rupees has different currency matching needs.
For practical analysis, separate the baseline, the upside case and the downside case. Document the specific development that would change your assessment. Assess timing: a promising long-term theme may still be inappropriate for cash needed within twelve months.
Bitcoin: upside narratives and drawdown risk
Bitcoin supply rules do not make its market price stable. Liquidity conditions, leverage, custody arrangements, regulatory changes and speculative activity can dominate short-run returns. Investor.gov warns that crypto assets involve substantial loss and fraud risks. Treat any allocation as a speculative risk decision, not a guaranteed inflation hedge. See the primary institutional research.
For practical analysis, separate the baseline, the upside case and the downside case. Document the specific development that would change your assessment. Assess timing: a promising long-term theme may still be inappropriate for cash needed within twelve months.
How to compare hedges in rupees
Measure the purchase price and exit value after exchange rates, fees and taxes. Consider the needed holding period and worst plausible drawdown. Diversification is more credible than trying to select one universally superior asset. The right benchmark is the real purchasing power of the specific future expense, not whichever asset had the best recent performance. See the primary institutional research.
For practical analysis, separate the baseline, the upside case and the downside case. Document the specific development that would change your assessment. Assess timing: a promising long-term theme may still be inappropriate for cash needed within twelve months.
Comparison and decision framework
| Question | Stronger evidence | Warning sign |
|---|---|---|
| What drives returns? | Audited cash flows, clear contract or transparent index | Undefined or projected returns |
| What can go wrong? | Explicit scenario and downside analysis | Claims of guaranteed gains |
| Is it affordable to hold? | Low transparent fees and adequate liquidity | Leverage, costly spreads or lockups |
| Is access legitimate? | Appropriate licensing and clear legal rights | Unverified brokers or custody |
| Is the exposure diversified? | Multiple independent sources of return | One company, sector or currency |
What it means for Pakistani savers and investors
A Pakistani reader faces both international investment risk and local purchasing-power risk. For example, a foreign asset can rise in US-dollar terms while the rupee conversion and transaction costs alter the realized local outcome. The opposite can also occur. Record the starting exchange rate, applicable taxes, custody charges and capital-transfer restrictions, and confirm current requirements with the State Bank of Pakistan and the relevant securities regulator. Overseas access should not be assumed universally available.
An emergency reserve, expensive consumer debt and near-term family obligations deserve attention before any speculative allocation. A portfolio that cannot meet a sudden cash requirement may force sales at the worst moment. The objective is not to remove risk—impossible in markets—but to choose risks that fit the investor’s actual liabilities.
Risks, limitations and uncertainty
Institutional forecasts are conditional and can change after policy decisions, commodity shocks, conflict escalation or unexpectedly weak earnings. Historic correlations are not binding promises about future asset performance. The analysis does not provide live stock prices, current investment product quotes, real-time exchange rates or individualized tax advice. Prices, regulations and product eligibility should be checked on the transaction date.
Frequently asked questions
Is this a guaranteed investment opportunity?
No. Every financial asset or strategy involves uncertainty. The existence of a popular investment theme is not evidence that an individual security is fairly priced.
What should beginners examine first?
Understand the product, the financial loss you could tolerate, fees and liquidity. Verify the provider and decide whether the money may be needed soon.
How do interest rates affect the analysis?
They influence financing costs, discount rates, exchange rates and demand. The effect differs by sector, maturity and business balance sheet.
Can Pakistani residents invest in foreign markets?
Access depends on current foreign-exchange, banking, brokerage, securities and tax rules, and on the investor’s individual circumstances. Check current regulations and regulated providers rather than assuming access.
How often should this analysis be refreshed?
Review institutional economic releases monthly and re-evaluate immediately after material earnings, regulatory or policy changes. Avoid reacting mechanically to every daily market movement.
Is diversification enough to prevent losses?
No. Diversification may reduce company-specific risk but cannot eliminate broad market, currency, inflation or systemic risks.
Conclusion
Sound financial decisions begin with verifiable evidence, reasonable valuation, awareness of uncertainty and a plan that survives adverse outcomes. Readers should compare multiple independent sources and avoid letting a compelling headline substitute for due diligence.
Discover more from The Economy
Subscribe to get the latest posts sent to your email.

Russia Sanctions Waiver: What Asian Oil Buyers Gain

Asia Markets Weekly: How Oil, US Yields and the Fed Reach Tokyo, Kuala Lumpur and Karachi

Gold Near $4,000: Buy, Hold or Wait? A Pakistan Tola Price Guide

US 10-Year Treasury Yield Near 5%: The Hidden Cost for Pakistani Investors

Fed Meeting on October 28: Hike or Hold—and Why Pakistan Investors Should Care

Can Pakistan Turn US–Iran Mediation Into an Economic Dividend?

Oil Above $100: How Higher Crude Prices Reach Pakistan’s Rupee, Petrol and Imports

SBP Interest Rate at 11.5%: What Will Decide Pakistan’s Next Policy Move?

The Global South: Debt, Climate Finance and Investment in 2026

Energy Security Is the New Economic Security

Can Global Tourism Survive Geopolitical Shocks?

Global Maritime Hegemony: How China Secured Over 81% of All New Shipbuilding Orders

The Coming Battle Over AI, Jobs and Wages

Why Developing Economies Face a Sharper Inflation Problem

Crude Oil & Petroleum Market Analysis: OPEC+ Decisions and Price Forecasts

Silver Price Today: Why the Xi-Trump AI Standoff Is Fueling a Safe-Haven Rally

Algorithmic Dogfights: Why the U.S. and China Must Establish Rules of Engagement for Autonomous Air Power

Top US Convenience Store Chains: Store Counts, EV Charging, and Sales Trends

Who Is Shivon Zilis? The Neuralink Executive at the Center of the Musk–OpenAI Trial

Social Security Extra $90 Deposit: Who Qualifies for the October 2026 Medicare Rebate?

Corporate America Faces a New Debt Test as US Borrowing Costs Surge

Global Economic Outlook 2026: 7 Forces Reshaping Markets, Trade and Business

Gold Falls 3.7% as Yields Surge: Is Gold Still a Safe Haven in 2026?

Stock Market Today: Dow, S&P 500, and Nasdaq Retreat as Treasury Yields

MAS Allocates S$1.45 Billion to Five Asset Managers in Third EQDP Batch: Total Deployment Reaches S$5.4 Billion

Anthropic Bans Sustained Abuse of Claude AI Under New Usage Policy Effective November 12, 2026

Gold Price Outlook 2026: The Forces Behind the Forecasts—and What Could Reverse Them

US 10-Year Yield Hits 5.24%: What the Historic Bond Market Sell off Means for Mortgages and Investors
-

 Markets & Finance10 months ago
Top 15 Stocks for Investment in 2026 in PSX: Your Complete Guide to Pakistan’s Best Investment Opportunities
-

 Analysis8 months ago
Johor’s Investment Boom: The Hidden Costs Behind Malaysia’s Most Ambitious Economic Surge
-

 Analysis8 months ago
Top 10 Stocks for Investment in PSX for Quick Returns in 2026
-

 Banks9 months ago
Best Investments in Pakistan 2026: Top 10 Low-Price Shares and Long-Term Picks for the PSX
-

 Analysis9 months ago
Brazil’s Rare Earth Race: US, EU, and China Compete for Critical Minerals as Tensions Rise
-

 Investment10 months ago
Top 10 Mutual Fund Managers in Pakistan for Investment in 2026: A Comprehensive Guide for Optimal Returns
-

 Global Economy10 months ago
15 Most Lucrative Sectors for Investment in Pakistan: A 2025 Data-Driven Analysis
-

 Global Economy10 months ago
Pakistan’s Export Goldmine: 10 Game-Changing Markets Where Pakistani Businesses Are Winning Big in 2025