
Analysis
The Tax That Quietly Grew: OECD Wage Levies Hit Their Highest Point in Nearly a Decade

Across 38 developed economies, the average tax wedge on wages climbed to 34.9 per cent in 2024 — its highest mark since 2017. Workers who survived the inflation shock now face a new form of fiscal attrition. The question is whether governments have the will to respond.
Key Statistics
| Metric | Value | Note |
|---|---|---|
| OECD Average Tax Wedge (2024) | 34.9% | Highest since 2017 (35.1%) |
| Belgium — Highest Tax Wedge | 52.6% | Followed by Germany at 47.9% |
| Countries Where Wedge Rose | 20/38 | OECD member states in 2024 |
| EU Average Tax Burden (2025) | 38.9% | EU-27 + UK single avg-wage worker |
There is a peculiar cruelty in recovering from one crisis only to be slowly bled by another. For millions of workers across the OECD’s 38 member economies, the years since the COVID-19 shock have followed this precise emotional arc. Inflation clawed back real wages through 2022 and 2023. Now, just as price growth has eased and nominal pay has begun recovering, a quieter mechanism — the structural ratchet of the tax wedge — has pushed the effective burden on wages to its highest level in nearly a decade.
The OECD’s Taxing Wages 2025 report, released in April 2025 and drawing on verified 2024 data across all member states, puts the headline number at 34.9 per cent of labour costs — the average tax wedge borne by a single worker without children earning the national mean wage. That figure, modest on first reading, represents the combined weight of personal income taxes, employee social security contributions (SSCs), and employer SSCs, net of any cash transfers received. It is, in short, the distance between what a job costs an employer and what an employee actually keeps. And it has now climbed back to where it stood in 2017, erasing what progress had been made during the pandemic years when temporary relief measures briefly compressed the wedge.¹
The Anatomy of a Squeeze: How the Wedge Widened
To understand the present moment, one must first appreciate the mechanics of fiscal creep. When wages rise — as they have, in nominal terms, in 37 of 38 OECD countries between 2023 and 2024 — progressive income tax systems extract a proportionally larger share unless thresholds are explicitly adjusted for inflation or earnings growth. In the absence of such indexation, the tax burden rises silently, through bracket creep, without a single parliament passing a new rate.²
In 2024, this dynamic was particularly visible. Of the 20 countries where the single worker’s tax wedge increased, the rise was driven by higher personal income taxes in 14 — attributable not to legislative change but to average wages outpacing static bracket thresholds. In countries such as Australia, Greece, Korea, Latvia, Mexico, Poland, Slovenia and Spain, nominal wage growth alone dragged workers into heavier effective tax territory.³ The remaining increases were led by social security contribution rate hikes, most notably in Italy — where a payroll threshold was breached — and Slovenia, where a new flat-rate health insurance levy of €420 per year was introduced. Italy recorded the sharpest single-country increase: 1.61 percentage points.⁴
Key Definition — Tax Wedge The tax wedge measures the total tax cost of employing a worker relative to their net take-home pay. It combines personal income tax, both employee and employer social security contributions, and subtracts any cash benefits. A higher wedge signals a wider gap between labour costs and disposable income.
This is not, strictly speaking, a crisis of government malice. Public finances across the OECD are under multi-directional pressure: ageing populations are enlarging pension and healthcare liabilities; defence budgets are rebuilding after decades of contraction; and the legacy debts of pandemic-era stimulus remain on sovereign balance sheets. Revenue needs are real. The question is whether wages — and wages alone — should bear the burden.
“For the average single worker across the OECD, more than a third of what they cost their employer never reaches their pocket. In Belgium, that figure exceeds half — a ratio that strains the very social contract taxation is meant to uphold.”
— Editorial Analysis, The Policy Tribune, April 2026
The Geography of Burden: Country-by-Country Disparities
The aggregate masks a divergence that is itself a policy story. Belgium’s tax wedge of 52.6 per cent — the highest in the OECD — means that for every €100 of labour cost incurred by a Belgian employer, the worker takes home less than €48. Germany (47.9%), France (47.2%), Italy (47.1%) and Austria (47.0%) complete the quintet of countries where the tax wedge exceeds 47 per cent, a threshold that would once have been considered a fiscal outlier.⁵
OECD Tax Wedge Rankings — Single Average Worker, 2024 (% of Labour Costs)
| Country | Tax Wedge |
|---|---|
| 🇧🇪 Belgium | 52.6% |
| 🇩🇪 Germany | 47.9% |
| 🇫🇷 France | 47.2% |
| 🇮🇹 Italy | 47.1% |
| 🇦🇹 Austria | 47.0% |
| 🌍 OECD Average | 34.9% |
| 🇨🇭 Switzerland | ~23.5% |
| 🇨🇱 Chile | 7.2% |
| 🇨🇴 Colombia | 0.0% |
Source: OECD Taxing Wages 2025 — Data for 2024 fiscal year.
At the other end of the spectrum, Switzerland, Israel, and New Zealand occupy a different fiscal philosophy — one that combines lower aggregate wedges with comparatively generous targeted reliefs for families. Colombia, uniquely, records a 0% tax wedge for the average single worker, partly a function of how its social security contributions are classified, and partly a reflection of its lower formal employment base.⁶
Research from the Tax Foundation — drawing on both OECD and EUROMOD modelling — reinforces that higher tax wedges correlate with subdued employment growth, particularly at the lower end of the wage distribution. A one-percentage-point rise in the tax wedge is associated, in panel analyses of EU labour markets, with a 0.05 percentage-point decline in employment growth.⁷ Over a decade, across a continent, those fractions compound.
Families vs. Singles: A Diverging Fiscal Experience
The one genuinely hopeful finding in the Taxing Wages 2025 data is a sustained and deliberate policy pivot toward protecting households with children. For the second consecutive year, the only household type for which the OECD average tax wedge declined was the single parent earning 67 per cent of the average wage — down 0.38 percentage points to 15.8 per cent. In Portugal and Poland, single parents saw their tax burden fall by 7.2 and 4.1 percentage points respectively, driven in part by expanded cash benefit programmes.⁸
The gap between single workers and couples with children is, in some countries, staggering. In the Slovak Republic, Poland, Luxembourg and Belgium, the tax wedge for a single childless worker at average earnings exceeds that of a one-earner married couple with two children by more than 15 percentage points.⁹ These differentials reflect deliberate family-support design — but they also highlight how thoroughly the standard single worker has become the system’s principal revenue base.
The Fiscal Pressure Valve: Why This Is Unlikely to Reverse Soon
Several structural forces suggest that the upward drift in the tax-to-wage ratio will persist in the medium term. Population ageing is not a trend that governments can legislate away: the OECD’s own demographic projections indicate that dependency ratios across most member states will worsen materially through the 2030s, placing direct upward pressure on pension and healthcare contributions — precisely the social security levies that constitute the largest component of the tax wedge for many workers.
Meanwhile, between 2024 and 2025, sixteen European countries increased their effective tax burden on labour while only nine reduced it.¹⁰ The direction of travel, while not uniform, is weighted toward expansion. Several nations — including a number in Central and Eastern Europe — have not indexed their income tax thresholds to inflation, creating a permanent background mechanism by which nominal wage growth continuously generates real tax increases without political accountability.
Policy Context — Bracket Creep When income tax thresholds are not indexed to inflation or wage growth, rising nominal wages push workers into higher brackets automatically. This “silent tax increase” generates additional revenue for governments without explicit parliamentary approval and is particularly prevalent in fiscally stretched OECD members.
What Policymakers Must Do: The Competitiveness Imperative
The policy implications converge on three interconnected challenges: labour market competitiveness, income redistribution, and fiscal sustainability. On competitiveness, the data is unambiguous. Countries with lower tax wedges — Switzerland, New Zealand, Israel — consistently demonstrate that lighter burdens on labour do not preclude high-quality public services; they are funded instead through broader-based consumption and wealth taxes. The lesson for high-wedge European economies is not that public services must be dismantled, but that the financing mix requires rebalancing.
On redistribution, the evidence suggests that targeted credits and allowances — rather than flat rate reductions — deliver the most efficient compression of inequality. The OECD’s own analysis finds that tax credits and allowances collectively enhance the progressivity of labour taxation by between 28 and 44 per cent, depending on household type.¹¹ Credits, in particular, have an outsized progressive effect precisely because they benefit lower earners disproportionately. Expanding refundable credit systems — as Ireland, the United States and several Nordic countries have demonstrated — can simultaneously reduce headline wedges and sharpen the incentive to enter formal employment.
Finally, on fiscal sustainability, the most pragmatic reform available to most OECD governments in the near term is mandatory indexation. Linking income tax thresholds to either inflation or a wage index — as Lithuania has done with payroll visibility, and as Latvia has done by simplifying its tax schedule — removes the silent ratchet of bracket creep and forces any genuine tax increase to proceed through democratic deliberation rather than administrative attrition.¹²
Conclusion: The Worker Is Not a Fiscal Residual
The OECD tax wedge at 34.9 per cent is not, in isolation, an alarming number. What is alarming is the trajectory, the context, and the distribution. Workers who absorbed a pandemic, endured an inflation shock, and watched real wages fall in 21 countries in 2023 are now, in their recovery, finding that the state takes a larger share of the nominal gains they have clawed back. That is not a sustainable settlement.
The countries that will attract talent, sustain birth rates, and maintain civic trust in their fiscal contracts over the coming decade are those that treat wage taxation not as an instrument of passive revenue extraction but as a deliberate and legible social compact — one that workers can see, understand, and believe is fair. The OECD’s data this year tells us that too many governments have drifted from that standard. The question for 2026 and beyond is how many have the political courage to return to it.
Citations & Primary Sources
- OECD (2025). Taxing Wages 2025: Decomposition of Personal Income Taxes and the Role of Tax Reliefs. OECD Publishing, Paris. doi: 10.1787/b3a95829-en
- OECD (April 2025). Labour Taxes Edge Up in the OECD as Real Wages Recover in 2024. OECD Press Release.
- OECD (2025). Taxing Wages 2025 — Summary Brochure. OECD Publishing.
- Ibid. — Italy tax wedge increase: +1.61 p.p., attributed to SSC threshold breach at €35,000.
- OECD (2025). Effective Tax Rates on Labour Income in 2024. Chapter 3, Taxing Wages 2025.
- Ibid. — Colombia classification note on SSC reclassification.
- Tax Foundation (2024). A Comparison of the Tax Burden on Labor in the OECD, 2024.
- OECD Taxing Wages 2025 — Single parent household section; Portugal and Poland data.
- OECD Taxing Wages 2025 — Table comparing single vs. one-earner couple tax wedge differentials.
- Tax Foundation Europe (April 2026). Tax Burden on Labor in Europe. EUROMOD J2.0+, UKMOD B2026.01.
- OECD Taxing Wages 2025 — Chapter 2: Decomposing Personal Income Taxes; credits and allowances progressivity analysis.
- Tax Foundation Europe (2026) — Latvia and Lithuania bracket reform case studies.
Discover more from The Economy
Subscribe to get the latest posts sent to your email.


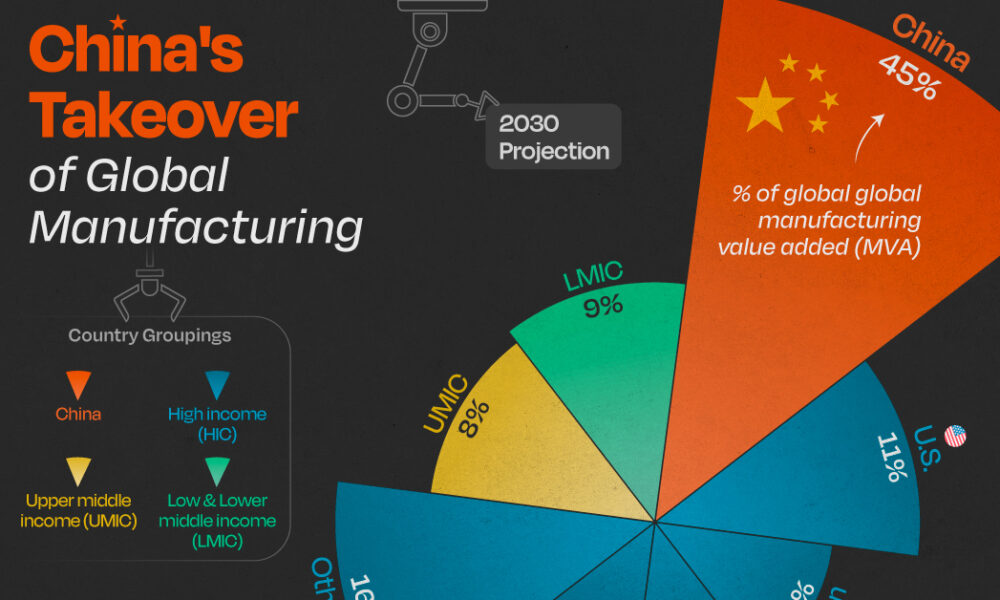
China’s exports have been the good-news story in an otherwise mixed economic picture. They’re not just holding up; through the first four months of 2026 they were running about 14% to 15% above the same period a year earlier, according to figures cited by the US-China Economic and Security Review Commission and Vanguard’s economic outlook. That’s the kind of number that would normally signal a healthy economy. The complication is what’s happening underneath it.
A growth model showing its age
Manufacturing capacity utilization fell to 73.9% in early 2026 — near a decade low outside of the pandemic shutdowns, per the Commission’s bulletin. That’s the tell. China is producing and shipping more, but a growing share of its industrial base is running under capacity, which points to a structural mismatch: the country’s manufacturing engine has outgrown both its domestic consumption and, increasingly, what the rest of the world is willing to absorb without pushback.
Goldman Sachs Research, in a report cited by Goldman Sachs’ own analysis, forecasts 4.8% real GDP growth for 2026 — above consensus expectations of 4.5% — driven substantially by continued export strength and a softening drag from the property downturn. But that same report flags the labor market as a genuine weak spot: hiring, measured across a weighted average of PMI employment sub-indexes, is at its most depressed level in a decade outside Covid, and urban nominal wage growth slowed to just 3.8% year-on-year in Q3 2025.
Why Beijing isn’t reaching for stimulus
Given the export strength, one might expect policymakers to feel less urgency about consumption-side stimulus. That’s roughly what’s happening — and it’s a deliberate choice, not an oversight. Xi Jinping’s government remains committed to dominating high-value manufacturing, which means comprehensive fiscal stimulus aimed at consumers remains unlikely even as domestic demand stays soft, according to the Commission’s bulletin.
The People’s Bank of China is expected to hold its policy rate steady through the rest of the year, preferring targeted structural tools over a broad-based rate cut, per Vanguard’s forecast. That’s a notably cautious stance given how weak the property sector remains — property investment indicators are down 50% to 80% from their 2020–21 peaks, and a “meaningful domestic-demand turnaround remains elusive,” in Vanguard’s own words.
The regulatory push to keep capital at home
Two moves by Chinese regulators in mid-2026 point to where Beijing’s real priority sits: keeping household savings and private capital funneled toward domestic industrial policy rather than flowing overseas. New rules taking effect July 1 restrict outbound investment that could be used to export restricted technology or expertise under the guise of ordinary capital flows, with violations carrying fines, visa restrictions and industry blacklisting, according to the Commission’s bulletin. The regulations follow Beijing’s move to block the founders of AI firm Manus from completing a sale to Meta, even after the company had relocated its headquarters from China to Singapore — a signal that Beijing is willing to reach across borders to keep promising tech assets tethered to domestic or Hong Kong listings.
The currency and trade angle
Goldman’s team makes an out-of-consensus call worth flagging: it expects China’s current account surplus to rise to 4.2% of GDP in 2026, up from 3.6% in 2025, while the broader analyst consensus surveyed by Bloomberg expects a decline to 2.5%. The divergence comes down to export resilience — falling export prices are making Chinese goods more competitive even as the yuan is expected to appreciate slightly, with export-price inflation in dollar terms forecast to turn positive, rising to 0.7% from -2.7% the prior year.
The bottom line
China’s economy in 2026 is a study in contrasts: robust headline export growth sitting on top of underutilized factories, a weak labor market, and a property sector still in its fifth year of decline. The World Bank’s own baseline, published in its country program materials, projects growth moderating toward 4.0% by 2026 — a more conservative read than Goldman’s. Either way, the consensus across forecasters is the same: exports are carrying more of China’s growth than is healthy for the long run, and Beijing’s policy choices this year suggest it’s betting on technological dominance to eventually solve the demand problem, rather than opening the stimulus taps to solve it directly.
Discover more from The Economy
Subscribe to get the latest posts sent to your email.
There’s a number that keeps showing up in every conversation about Pakistan’s economy, and it keeps getting bigger: circular debt. As of early July 2026, the gas sector’s share of that debt alone has topped Rs 3.44 trillion, and Islamabad has missed a deadline the IMF set for tariff reforms meant to arrest the slide, according to Dawn.
What circular debt actually is, and why it won’t go away
Circular debt is the chain of unpaid obligations that builds up when the price consumers pay for electricity or gas doesn’t cover what it actually costs to produce and deliver it. Someone in the chain — a power producer, a gas utility, a state-owned enterprise — ends up carrying an IOU, and that IOU gets passed down the line. Earlier this year, IMF officials pressed Pakistan on exactly this dynamic, questioning the government’s plan to zero out gas-sector circular debt, according to Aaj English. At the time, officials said around Rs 150 billion remained payable to companies including Oil and Gas Development Company Limited and Pakistan Petroleum Limited.
Islamabad’s proposed fix included a Rs 5-per-unit levy on gas, dividends from state-owned companies redirected toward debt reduction, and the sale of 35 LNG cargoes annually on the international market. The IMF, per that same reporting, raised pointed questions about whether the plan was actually viable.
The commitments Pakistan has already made
Under its Extended Fund Facility, Pakistan has committed to capping circular debt growth at Rs 300 billion for FY2027 and cutting power-sector subsidies from 0.7% of GDP to 0.6%, according to details reported by ProPakistani. The government has also shifted Nepra’s annual tariff-rebasing cycle from July to January, and Ogra now revises gas tariffs twice a year instead of once.
Structurally, some of this is working. The IMF’s own review in May 2026 credited Pakistan with a primary fiscal surplus of 1.6% of GDP for FY26, broadly in line with program targets, and noted gross reserves had climbed to $16 billion by end-December, up from $14.5 billion six months earlier, according to the IMF’s own press release. That progress unlocked roughly $1.1 billion under the EFF and $220 million under a parallel climate-resilience facility, bringing total disbursements under the two arrangements to about $4.8 billion.
Where the fault lines actually are
The uncomfortable part of this story, laid out by commentary reported in The Hans India, is that revenue targets get IMF scrutiny with great precision, while structural reform of loss-making public enterprises — Pakistan International Airlines and Pakistan Steel Mills chief among them — moves far more slowly. Those enterprises’ losses are absorbed by the national exchequer through subsidies, guarantees, and debt restructuring year after year, and privatization plans keep slipping because the political cost of confronting them is high.
Distribution company inefficiency compounds the problem. In FY25, Discos posted Rs 265 billion in losses, an improvement on FY24’s Rs 276 billion but still a substantial drag, according to Geo News, with Quetta, Peshawar and Hyderabad among the worst-performing utilities.
What happens if the pattern holds
Pakistan’s debt-to-GDP ratio sits between 70% and 80% as of 2026, according to Wikipedia’s economic summary, with debt servicing occasionally consuming two-thirds of government spending. That’s the backdrop against which every circular-debt conversation happens: there is very little fiscal room left to absorb another missed deadline.
The missed gas tariff deadline doesn’t automatically trigger a program breakdown — Pakistan has weathered similar friction points before during its current EFF arrangement. But with the IMF’s own documentation showing persistent concern about the credibility of debt-reduction plans, and with global energy prices still elevated in the aftermath of the Iran war, the margin for further slippage is thin. The next review will likely hinge less on the rhetoric around reform and more on whether the Rs 5 levy and LNG cargo sales actually show up in the numbers.
Discover more from The Economy
Subscribe to get the latest posts sent to your email.
Analysis
Malaysia Bets Its 2026 on “Execution” — And the Semiconductor Upcycle Is Doing the Heavy Lifting
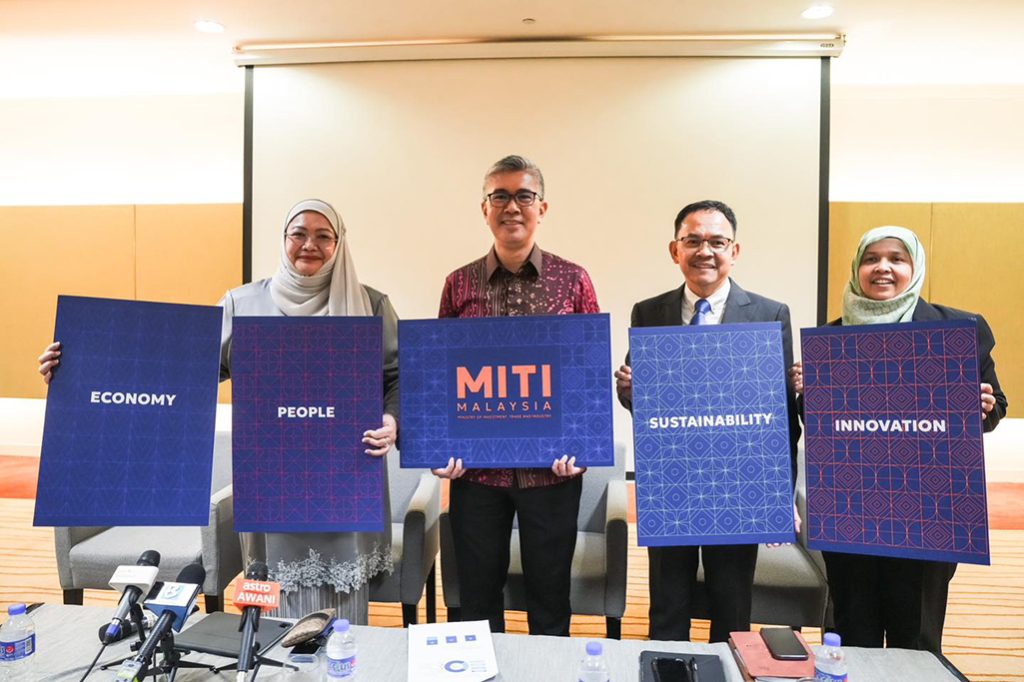
Malaysia’s government has declared 2026 a year of “execution” and “discipline” as the Anwar Ibrahim administration races to deliver on the 13th Malaysia Plan (RMK13) ahead of elections that could come as early as February 2028, according to Fortune’s interview with economy minister Akmal Nasrullah Mohd Nasir.
A Strong Base to Build From
Malaysia’s economy grew 4.9% in 2025 following 5.1% growth the year before, with unemployment falling to 2.9% — the lowest in a decade — and the ringgit trading at its strongest level in five years. HSBC’s ASEAN economist Yun Liu forecasts 4.6% growth for 2026, citing strength in electrical equipment manufacturing, tourism, and sound government policy, while Nomura economists have projected an even more bullish 5.2%, pointing to infrastructure spending under RMK13.
The ASEAN+3 Macroeconomic Research Office (AMRO) projects growth moderating slightly to 4.6% from an estimated 4.9% in 2025, describing Malaysia’s performance as reflecting its “entrenched position in global semiconductor and electronics value chains” and the broader global tech upcycle, according to AMRO’s assessment of Malaysia’s investment upcycle.
Navigating Washington Without Picking Sides
Malaysia’s trade relationship with the US has been turbulent. Washington imposed 25% tariffs on Malaysian goods in April 2025, rattling the country’s export-led economy, before a deal reduced US duties to 19% in exchange for Malaysia lowering tariffs on select American products, with exemptions carved out for aviation components and electrical equipment. Malaysia’s trade hit a record high of more than 3 trillion ringgit (roughly $780 billion) last year despite the friction.
Deputy finance minister Liew Chin Tong has framed Malaysia’s positioning explicitly around neutrality: the country is “not China, not the US,” a stance he argues gives Malaysia a strategic advantage in both geopolitical and supply-chain terms, according to Fortune’s reporting from the Forum Ekonomi Malaysia summit.
Capital Is Flowing In — From Everywhere
Malaysia recorded 22.8 billion ringgit (about $5.8 billion) in foreign direct investment in the first quarter of 2026, a 6.0% year-on-year increase, moderating from the prior quarter’s 48.7% surge. Inflows into information and communication technology services remained particularly strong, with China, Hong Kong, and Singapore serving as the primary capital sources, according to McKinsey’s Southeast Asia quarterly economic review. Bank Negara Malaysia has held its policy rate steady following a pre-emptive 25 basis-point cut in July 2025, with headline inflation projected to average just 2.0% in 2026.
The Long Game: Semiconductors, Rare Earths, and Nuclear Power
Beyond RMK13’s near-term targets, Malaysian officials are positioning the country’s industrial strategy around decades, not years. Minister Akmal has reiterated commitments to eliminate coal use by 2044 and reach net zero by 2050, while confirming Malaysia is actively “exploring the potential” of nuclear power to meet the energy demands of its expanding data-center and semiconductor sectors. AMRO’s structural policy guidance urges Malaysia to develop domestic semiconductor and rare-earth capabilities as a hedge against ongoing US-China “geoeconomic fracturing,” positioning the country as a trusted neutral hub for global manufacturers diversifying away from concentrated exposure to either superpower.
Discover more from The Economy
Subscribe to get the latest posts sent to your email.

China Economy 2026: Export Growth Masks Manufacturing Overcapacity

Pakistan Iran-US Ceasefire Mediation 2026: Diplomatic Gains, Economic Risks

Pakistan Circular Debt Crisis 2026: IMF Deadline Missed, Rs 3.44 Trillion

Indonesia Russian Oil Imports 2026: Why Jakarta Is Diversifying Crude Supply

Russia Bans Diesel Exports 2026: Global Fuel Market Impact Explained

Gulf Sovereign Wealth Funds Hit Record $53.9B in H1 2026 Despite Iran War

America’s Workers Are Vanishing From the Labor Force — And It’s Not the Usual Reasons

ASEAN+3 Enters 2026 From a Position of Strength — But Two Storms Are Building Offshore

US Tariff Investigation 2026: 60 Countries, Forced Labor Claims and the EU Trade Fight

UK Digital Identity Framework 2026: The £5bn Plan to Reshape Financial Verification

The Money Is Drying Up: How US Pressure Is Choking Off Russia-China Payment Channels

Indonesia GDP Growth 2026: 5.61% Expansion Marks Fastest Pace in Three Years

Singapore Makes Its Move to Become Asia’s Precious-Metals Capital

Malaysia Bets Its 2026 on “Execution” — And the Semiconductor Upcycle Is Doing the Heavy Lifting

Top 20 PSX Stocks for Investment in 2027: Your Complete Guide to Pakistan’s Best Investment Opportunities

Investors Pile Into Bullish Dollar Bets as ‘US Exceptionalism’ Trade Returns

Carry Trade Unwind 2026: How the Yen’s Snapback Triggered a Global Margin Call

Pakistan Textile Body Welcomes FY27 Budget, Seeks FTR

Japan’s Nikkei Scales Record Peak as AI Shares Track US Chip Rally

Why China’s Demand Stimulus Still Isn’t Working

Grinding the Already Ground: Pakistan’s Inflation Crisis

JPMorgan Cuts Anthropic AI Access in Hong Kong

Weak Demand at Treasury Auctions Is Quietly Rattling Bond Investors

China Tungsten Export Curbs: Is Japan’s AI Chip Supply at Risk?

Xponential Fitness Franchise Lawsuit: The $3.97M Judgment

SpaceX IPO opens door for retail savers via X Money

SpaceX IPO: Musk Raises $75bn in History’s Largest Listing

Bank Indonesia Rate Hike 2026: New Mandate’s First Market Test
-

 Markets & Finance6 months ago
Top 15 Stocks for Investment in 2026 in PSX: Your Complete Guide to Pakistan’s Best Investment Opportunities
-

 Analysis5 months ago
Top 10 Stocks for Investment in PSX for Quick Returns in 2026
-

 Analysis5 months ago
Brazil’s Rare Earth Race: US, EU, and China Compete for Critical Minerals as Tensions Rise
-

 Analysis5 months ago
Johor’s Investment Boom: The Hidden Costs Behind Malaysia’s Most Ambitious Economic Surge
-

 Banks6 months ago
Best Investments in Pakistan 2026: Top 10 Low-Price Shares and Long-Term Picks for the PSX
-

 Investment6 months ago
Top 10 Mutual Fund Managers in Pakistan for Investment in 2026: A Comprehensive Guide for Optimal Returns
-

 Global Economy6 months ago
15 Most Lucrative Sectors for Investment in Pakistan: A 2025 Data-Driven Analysis
-

 Global Economy6 months ago
Pakistan’s Export Goldmine: 10 Game-Changing Markets Where Pakistani Businesses Are Winning Big in 2025