
Auto
EU vs UK Electric Vehicle Tariffs: Impact on Automotive Supply Chains & Consumer Prices

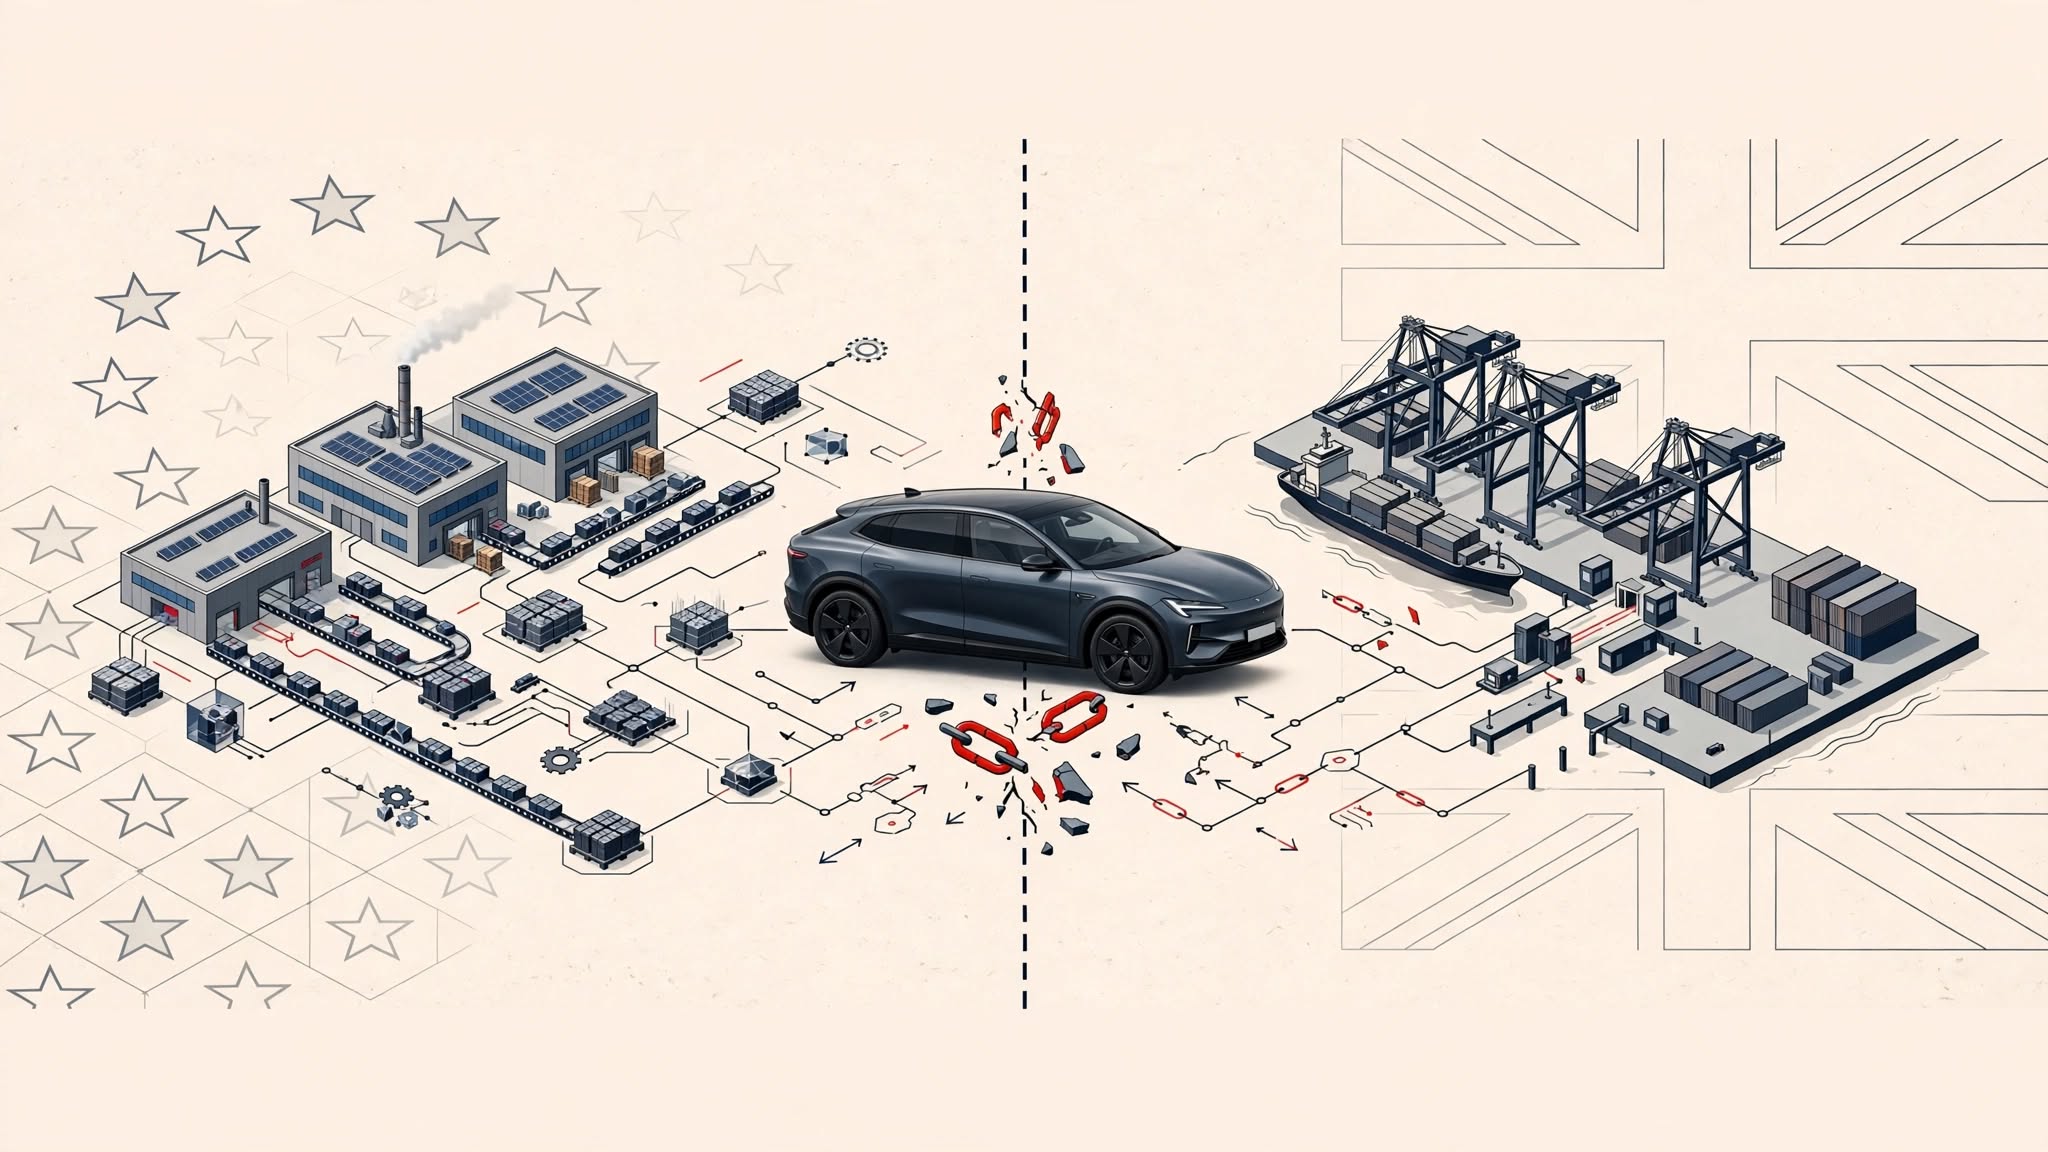
EU duties on Chinese EVs reach 45.3% while the UK charges 10%. Here’s how the tariff gap works, what the 2027 rules change, and who pays.
Key Takeaways
- The EU applies countervailing duties on Chinese-built battery electric vehicles of 17.0% (BYD), 18.8% (Geely), and 35.3% (SAIC), on top of the 10% standard tariff. Non-cooperating exporters face 35.3%.
- The UK has not adopted EU-style duties on Chinese EVs. Chinese-built cars pay the standard 10% rate.
- Under the EU-UK Trade and Cooperation Agreement, EVs made in either market can enter the other tariff-free only if they meet local-content thresholds. Those transitional rules expire at the end of 2026.
- Stricter rules from 2027 could expose roughly 82% of EU battery-electric car exports to the UK to a 10% tariff, according to industry estimates.
- Tariffs are paid by importers, so their effect on shoppers depends on how manufacturers price and source their cars.
Search Intent Summary
Readers searching this topic usually want to know one thing: why does the same electric car cost different amounts in Europe and Britain, and will that change? This article covers the current duty rates, the rules-of-origin deadline, and what each market’s policy means for supply chains and prices.
The EU’s Anti-Subsidy Duties on Chinese EVs
The European Commission’s dispute with China began with an investigation into Chinese state subsidies. The Commission found that subsidies were distorting prices and threatening European carmakers. In October 2024, it imposed definitive countervailing duties on imports of battery electric vehicles from China, applicable from 30 October 2024 under Regulation 2024/2754. The duties apply for five years.
The rates vary by manufacturer. Sampled producers BYD, Geely, and SAIC were assigned 17.0%, 18.8%, and 35.3%. Other cooperating companies face 20.7%. Companies that did not cooperate with the investigation face 35.3%. Those rates stack on the existing 10% MFN tariff, so the highest total is 45.3%.
The EU has since amended those rates. In February 2026, the Commission adopted Implementing Regulation (EU) 2026/330, which amended the original regulation following a partial interim review. Check the amended schedule before quoting any specific rate, because the figures above come from the original 2024 decision.
The duties apply to fully electric passenger cars made in China. Plug-in hybrids and cars built outside China fall outside the measure.
The UK’s Different Approach
Britain left the EU’s trade defence system after Brexit and has made a different choice. Chinese-built electric cars entering the UK pay the standard 10% tariff, with no additional anti-subsidy duty. Reporting in the Financial Times and elsewhere in 2026 describes the UK as keeping this position under review rather than committing to match Brussels.
That gap has become a bargaining issue. Reporting in September 2026 says Brussels has pressed London to align its China policy as a condition for British manufacturers to take part in the EU’s “Made in Europe” industrial initiatives. London has responded that the tariffs remain under review, without committing to a change.
The UK’s position has a practical logic. Chinese manufacturers have not yet pushed large volumes into the British market. Trade press has noted that Chinese brands account for a growing share of new registrations, which gives policymakers a reason to weigh investment against protection.
The Rules-of-Origin Deadline
The more immediate issue for manufacturers is the Trade and Cooperation Agreement’s rules of origin. Under that deal, electric vehicles traded between the UK and the EU avoid tariffs only when they contain enough local content.
The IEA’s summary of the EU-UK rules set the thresholds for the second phase, January 2024 to December 2026, at 45% of vehicle value, 60% for battery packs, and 50% for battery cells. The thresholds were originally due to rise further in 2027, but the two sides agreed to hold the current rules through 2026 to give manufacturers time.
That transitional period ends on 31 December 2026. The European Automobile Manufacturers’ Association, ACEA, has warned that the stricter rules will be hard to meet. Its estimates, reported by trade publication electrive in September 2026, suggest around 520,000 battery-electric cars and light commercial vehicles worth €17.9 billion would be exported from the EU to the UK in 2027. About 82% of those, roughly 426,000 vehicles, could fail the new thresholds. At a 10% tariff, ACEA calculates that would cost €1.47 billion. ACEA has asked for battery-specific rules to be delayed until 2029, while keeping the vehicle rules tightening on schedule.
ACEA’s figures are an industry estimate, not an official forecast. Whether the UK and EU agree another extension is the key open question for 2027.
How the Tariffs Reach Supply Chains
The tariff gap changes where manufacturers choose to build and source. Three effects stand out.
Manufacturers importing Chinese-built cars into the EU face a total duty that can reach 45.3%. That pushes carmakers to build in Europe, source batteries locally, or shift volume to the UK, which currently charges 10%.
Carmakers building cars in the UK for export to the EU face their own problem. A UK-built electric car that fails the rules of origin pays a 10% duty when entering the EU. Nissan’s Sunderland plant, which builds the Leaf, is one example of a site where the rules matter directly.
Battery supply is the pinch point. Meeting the 60% and 50% battery thresholds requires cell and pack production in the EU or UK, and the industry says that capacity is still being built.
The Consumer Price Question
Tariffs are paid by importers, not directly by shoppers. A duty raises the cost of importing a car, and the importer decides whether to pass that cost on through the price, absorb it, or cut the car’s spec.
A simple example shows the scale. Suppose a Chinese-built EV has a customs value of €30,000. At the 10% standard rate, the duty is €3,000. At a combined 27% (17% anti-subsidy plus 10% standard), it rises to €8,100. The extra €5,100 is a cost the importer must recover somehow. This example is hypothetical, and the real figure depends on the car’s customs valuation and the manufacturer’s rate.
Competition shapes the outcome. Industry analysts have noted that the EU’s duties averaged around 20% for many Chinese producers, which carmakers in China argued would have a limited effect on sales. Price impact is therefore uneven across brands and models.
Practical Strategy for Buyers and Businesses
For buyers, the most useful step is checking a car’s country of origin and manufacturer before comparing prices across markets. A model built in one country can carry very different duty costs in another, even if the badge is the same.
For fleet operators and importers, the 2027 deadline is the priority. Confirm whether a model qualifies under the current rules of origin, and ask suppliers for documented local-content figures. Build a contingency for a 10% tariff on any cars that fail.
For policy watchers, track three signals: whether the UK decides on China tariffs, whether the EU and UK agree to extend or modify the rules of origin, and whether the EU’s price-undertaking talks with Chinese manufacturers produce a settlement. Any of these could shift the picture quickly.
Future Outlook
The likely direction is toward more alignment, but not uniformity. The EU has tied its “Made in Europe” access to tougher China policy, and the UK has every incentive to protect access to its largest trading partner’s industrial programs. At the same time, the UK’s market has been more open, and some British policymakers want to keep it that way.
The 2027 rules of origin are the first hard test. Whether they tighten as scheduled, get delayed, or are softened for batteries will determine how much duty lands on cars that cross the Channel.
Frequently Asked Questions
Why are Chinese electric cars more expensive in the EU than in the UK?
The EU imposes countervailing duties of 17% to 35.3% on China-built battery electric cars, on top of a 10% standard tariff. The UK charges the standard 10% without the extra anti-subsidy duty. The difference comes from the EU’s subsidy investigation, which the UK has not replicated.
Do EU electric car tariffs apply to plug-in hybrids?
No. The anti-subsidy duties cover new battery electric vehicles designed for transporting people, and the regulation names vehicles propelled solely by electric motors, including those with a range extender. Plug-in hybrids fall outside the measure, and cars built outside China are not subject to the countervailing duties.
What happens to UK-EU electric car trade in 2027?
The current transitional rules of origin expire on 31 December 2026, and stricter local-content requirements apply from 2027 unless the two sides agree otherwise. Industry estimates suggest many EU exports to the UK would fail the new thresholds and face a 10% tariff. Watch for an extension or modification before the deadline.
Who pays electric car tariffs?
The importer pays the duty when the car enters the market. Whether the cost reaches the buyer depends on the importer’s pricing decisions, competition, and the manufacturer’s sourcing choices. The tariff does not appear as a line item on a shopper’s invoice.
Discover more from The Economy
Subscribe to get the latest posts sent to your email.


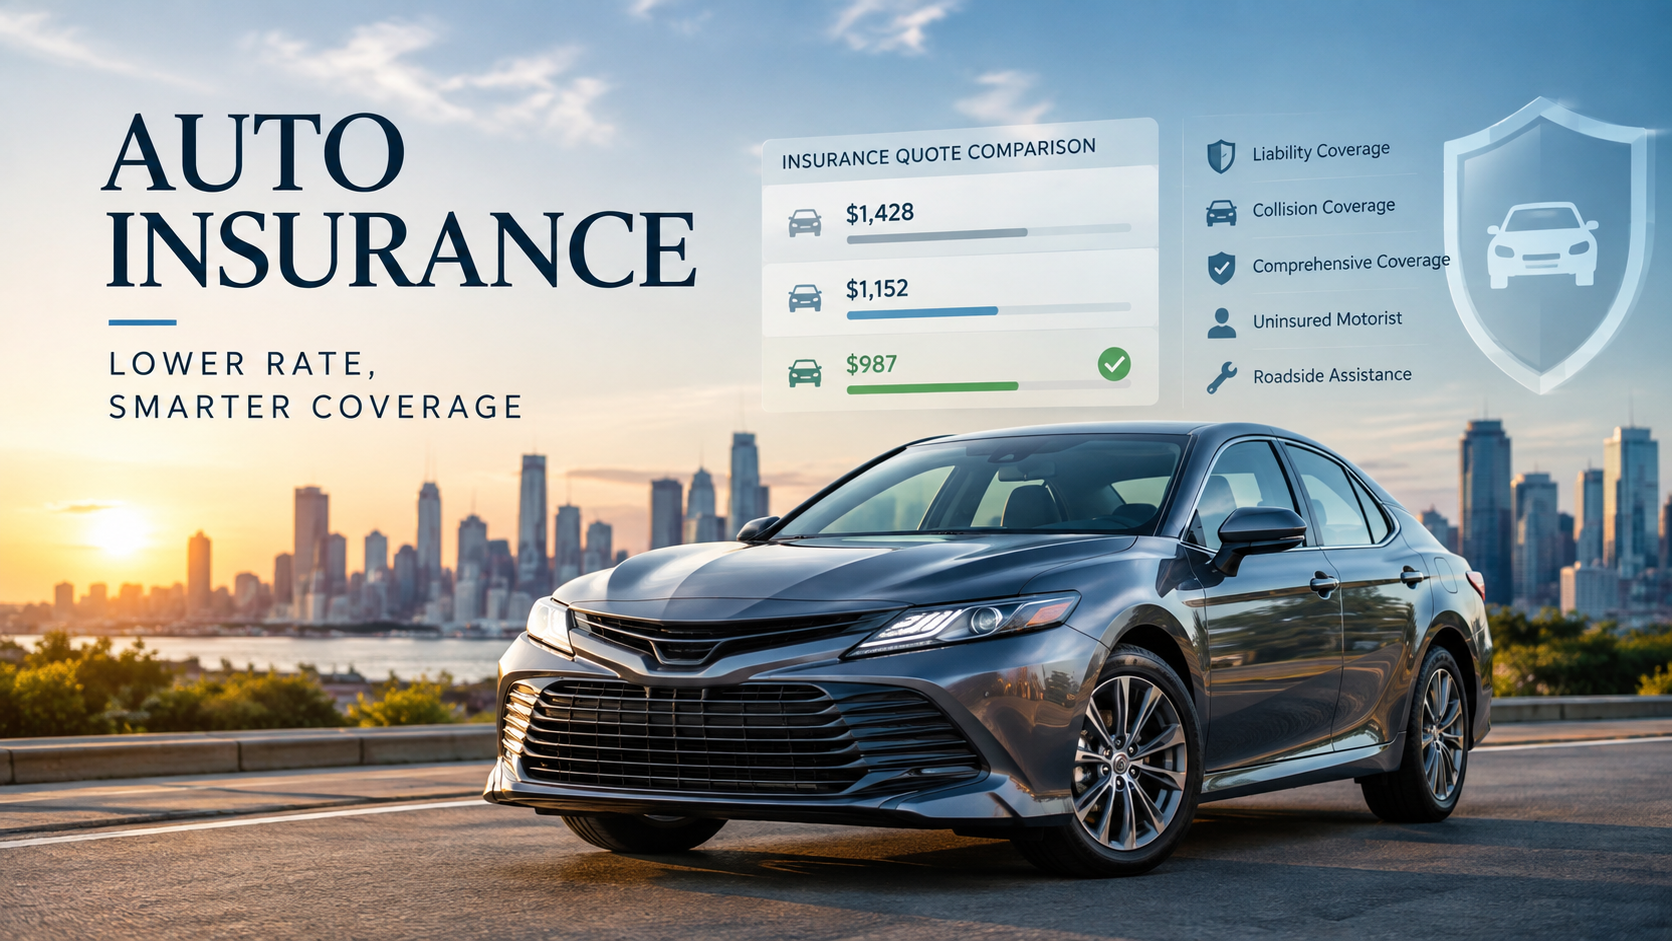
The gap between the cheapest and most expensive auto insurer for the exact same driver and the exact same coverage can exceed $500 a year — meaning the single highest-leverage financial decision most drivers never make is simply comparing quotes before renewal.
Auto insurance pricing isn’t a fixed number set by the market; it’s a highly individualized calculation that varies dramatically between insurers for identical coverage. Two drivers with the same age, location, and driving record can receive wildly different quotes from the same set of companies, which is precisely why shopping multiple quotes — rather than auto-renewing with a single carrier — remains one of the most reliable ways to reduce a major recurring household expense.
This guide covers how auto insurance quotes are actually calculated, current 2026 rate benchmarks, and how to compare quotes effectively without accidentally under-insuring yourself.
How Auto Insurance Quotes Are Actually Calculated
Insurers use dozens of variables to price a policy, and because each company weighs these factors differently, the “best” insurer for one driver is frequently not the best for another.
Key takeaway: The national average cost of full coverage car insurance is $2,315 per year, or about $193 per month, while minimum coverage averages $621 per year, according to NerdWallet’s 2026 rate analysis — but your own quote will likely differ substantially based on factors specific to you.
The Core Factors That Drive Your Quote
- Location — state and even ZIP code meaningfully affect rates, with full coverage ranging from roughly $128 per month in the cheapest states to over $330 per month in the most expensive.
- Driving record — accidents, violations, and DUIs are among the largest individual rate drivers.
- Credit-based insurance score — used in most states (though prohibited in a handful) as a statistically validated predictor of claims likelihood.
- Age and driving experience — younger, less experienced drivers consistently pay significantly more.
- Vehicle make, model, and year — repair costs, safety ratings, and theft rates all factor into pricing.
- Coverage limits and deductibles — higher liability limits and lower deductibles increase premiums.
Step-by-Step: How to Shop Auto Insurance Quotes Effectively
- Gather your current policy details — coverage limits, deductibles, and driver information — so you’re comparing equivalent coverage across quotes.
- Get quotes from at least three to five insurers, including both large national carriers and regional companies, since regional insurers frequently beat national rates in specific states.
- Request identical coverage limits on every quote — comparing a $500 deductible quote against a $1,000 deductible quote will produce a misleading price comparison.
- Ask about all available discounts explicitly, since not every discount is applied automatically.
- Compare the final out-the-door price, including fees, not just the advertised premium.
- Review coverage details, not just price — the cheapest quote sometimes reflects lower liability limits or missing coverage types.
Financial and Strategic Implications: 2026 Rate Benchmarks
Understanding current market rates helps you evaluate whether a quote you’ve received is actually competitive.
| Coverage Level / Company | 2026 Rate Benchmark | Source |
|---|---|---|
| National average, full coverage | $193/month ($2,315/year) | NerdWallet April 2026 analysis |
| National average, minimum coverage | $52/month ($621/year) | NerdWallet April 2026 analysis |
| Cheapest large insurer, full coverage | Travelers, ~$139/month | NerdWallet March 2026 analysis |
| Cheapest large insurer, liability-only | GEICO, ~$41/month | NerdWallet March 2026 analysis |
| Most expensive state (full coverage) | Nevada, ~$335/month | ValuePenguin 2026 State of Auto Insurance |
| Cheapest state (full coverage) | Vermont, ~$128/month | ValuePenguin 2026 State of Auto Insurance |
Expert insight: 2026 is shaping up to be the calmest year for auto insurance pricing since 2022, with national rates projected to rise less than 1% on average — following double-digit annual increases in 2023 and 2024. That relative stability makes this a favorable year to shop aggressively, since insurers competing for market share in a flatter-rate environment are often more willing to offer competitive new-customer pricing.
Why Identical Coverage Can Still Produce Very Different Quotes
Because each insurer’s underwriting model weighs risk factors differently — one company might penalize a recent speeding ticket heavily while barely adjusting for credit score, while another does the reverse — your price can vary meaningfully between insurers even for the same driver and coverage, which is exactly why comparison shopping consistently produces savings that simply renewing with the same insurer does not.
How to Choose the Right Auto Insurance Quote
- Don’t default to price alone — verify the liability limits, comprehensive/collision deductibles, and any exclusions match across every quote you’re comparing.
- Ask about bundling discounts — combining auto with homeowners or renters insurance frequently produces a meaningful discount with the same carrier.
- Check for usage-based/telematics programs — safe drivers can often secure additional discounts through an insurer’s driving-monitoring app.
- Re-shop annually, not just at renewal notice, since insurer pricing models shift and a company that was competitive last year may not be this year.
- Confirm the insurer’s claims-handling reputation, not just price, using state insurance department complaint ratios or third-party satisfaction surveys.
- Review minimum coverage carefully — the cheapest liability-only policy may leave you underinsured relative to your actual assets in a serious at-fault accident.
Key takeaway: The single biggest mistake drivers make isn’t picking the wrong insurer — it’s not requoting at all. Insurance pricing models change frequently enough that a policy competitive two years ago can quietly become overpriced relative to the current market, with no notification from your current insurer.
Future Outlook: Auto Insurance Rate Trends Through 2027
- Rate growth is expected to remain unusually flat. ValuePenguin projects national auto insurance rates to rise by less than 1% on average in 2026, the smallest increase since 2022, though state-level trends diverge significantly — some states are projected to see rates fall by several percentage points while others, led by New Jersey, are projected to rise more sharply.
- State-level divergence is widening. More than half of states are expected to see rates decline in 2026, even as a handful of states see continued increases, making location-specific comparison shopping more valuable than ever.
- Usage-based insurance adoption continues to grow. As more insurers expand telematics-based discount programs, safe drivers increasingly have access to meaningfully lower rates than standard pricing models would otherwise offer.
- Credit-based insurance scoring remains a contested policy issue. Several states continue to debate restricting or eliminating the use of credit history in auto insurance pricing, a change that could meaningfully shift relative pricing among insurers if enacted more broadly.
Frequently Asked Questions
How many auto insurance quotes should I get before choosing a policy? Most experts recommend comparing quotes from at least three to five insurers, including a mix of large national carriers and regional companies, since regional insurers can significantly undercut national pricing in specific states.
Will getting multiple auto insurance quotes hurt my credit score?
Generally no. Auto insurance quotes typically use a “soft pull” that doesn’t affect your credit score, unlike a hard inquiry from a loan or credit card application.
Why did my auto insurance quote go up even though I haven’t had any accidents?
Rate changes can reflect broader factors unrelated to your personal driving record, including inflation in vehicle repair costs, regional claims trends, and insurer-wide rate filings approved by state regulators.
Is the cheapest auto insurance quote always the best choice?
Not necessarily. A lower price can reflect reduced liability limits, higher deductibles, or missing coverage types, so it’s important to confirm you’re comparing genuinely equivalent coverage before choosing based on price alone.
How often should I shop for new auto insurance quotes?
Annually is a reasonable standard practice, since insurer pricing models and competitive positioning change over time, and a policy that was competitively priced in a prior year may no longer be.
Discover more from The Economy
Subscribe to get the latest posts sent to your email.

Elon Musk’s ambitious underground transit venture is officially scaling up its global footprint. The Boring Company has closed a massive $3 billion Series D funding round, catapulting its valuation to $23 billion. This represents a staggering four-fold increase from its $5.7 billion valuation in 2022.
Led by the United Arab Emirates (UAE) alongside a syndicate of heavyweight tech investors, this capital injection signals a decisive shift from a localized Las Vegas demonstration project to an international, multi-city infrastructure enterprise.
The Middle Eastern Pivot: A $3 Billion War Chest
The Series D round wasn’t just a capital raise; it was a strategic alignment. The UAE spearheaded the investment, joined by a roster of tier-one venture capital and private equity firms, including Sequoia Capital, Andreessen Horowitz (a16z), and Singapore’s state-owned Temasek. Additional participation came from Valor Equity Partners, Vy Capital, and Baron Capital.
The UAE’s role as the lead investor is deeply intertwined with its status as The Boring Company’s premier international customer. The funding is earmarked to deploy over 150 kilometers of underground infrastructure across the Emirates. This massive undertaking builds upon the foundation of the Dubai Loop, a project that was solidified at the World Governments Summit.
| Project Phase | Details | Estimated Cost |
| Dubai Pilot | 6.4 km route with 4 stations linking DIFC and Dubai Mall | ~$154 Million |
| Full UAE Network | >150 km of interconnected underground transit | TBD |
Manufacturing of precast tunnel segments for the Dubai pilot has already commenced, with active tunnel boring expected to begin in late 2026.
Scaling the Loop: Vegas, Nashville, and Beyond
While the Middle East represents the frontier of expansion, The Boring Company is simultaneously aggressively scaling its domestic operations in the United States.
- The Vegas Loop Expansion: Las Vegas remains the company’s operational showcase. Having already transported over four million passengers, the network recently added Tesla Cybertrucks to its autonomous fleet. Clark County regulators have greenlit a massive expansion, entitling the network to 123 stations, complete with a dedicated connector to the Harry Reid International Airport.
- Music City Loop (Nashville): Moving beyond the softer soils of Nevada, the company has broken ground in Nashville, Tennessee. Following regulatory approval in early 2026, crews are actively operating two Prufrock machines concurrently. This marks the company’s first foray into complex, hard-rock tunneling.
Prufrock and the Autonomous R&D Push
A significant portion of the new capital is allocated for aggressive hiring across engineering, operations, and production to scale the Prufrock tunnel-boring platforms.
The Boring Company’s core value proposition isn’t just digging holes—it’s automating the excavation process to drastically reduce costs and timelines. Recent milestones indicate that ring-building has become fully autonomous. Heavy concrete segments are now placed with millimeter precision via remote monitoring from the company’s Global Operations Control Center in Texas, effectively demonstrating “Zero-People-in-Tunnel” continuous mining.
For Musk, the mission remains philosophical as much as it is mechanical. In a statement accompanying the funding announcement, he noted: “Defeating traffic is the ultimate boss battle. Even the most powerful humans in the world cannot defeat traffic.”
With a $23 billion valuation and sovereign wealth backing, The Boring Company now has the financial firepower to test whether silicon valley automation can finally conquer legacy urban congestion.
Discover more from The Economy
Subscribe to get the latest posts sent to your email.

Nvidia CEO Jensen Huang called it the “ChatGPT moment for physical AI” at CES in early 2026 — and by September, the capital markets have taken the claim seriously. Physical AI robotics has moved decisively from research demo to commercial deployment: PepsiCo is running 35 driverless trucks on public Arizona highways, Tesla has committed $20 billion in capital expenditure to convert Model S/X production lines into Optimus humanoid robot manufacturing, and venture capital poured $47.4 billion into physical AI startups across 521 deals in just the first half of 2026. This is not a speculative technology narrative anymore — it is an industrial IoT and supply chain automation software buildout with real revenue, real deployed hardware, and a credible multi-trillion-dollar addressable market.
Key Takeaways
- The global physical AI market was valued at $81.4 billion in 2025 and is projected to reach roughly $1.145 trillion by 2035 (33.5% CAGR), with some more conservative estimates putting the narrower AI-robotics segment at $15.24 billion by 2032.
- Humanoid robot shipments in China were revised sharply upward by Morgan Stanley — from 14,000 units at the start of 2026 to a projected 50,000 units by year-end, following Tesla’s own Optimus Gen 3 production ramp.
- Autonomous trucking has crossed from pilot to paid commercial operation: Gatik has completed 60,000 driverless orders incident-free with $600 million in contracted revenue, and Volvo plans to remove safety drivers entirely on U.S. highways by Q1 2027.
- Full trucking automation could save the U.S. economy an estimated $300 billion annually in labor costs, with $100–125 billion in net savings after accounting for technology costs.
- Roland Berger projects the humanoid robot industry alone could reach $750 billion by 2035 and $4 trillion by 2050 — a scale comparable to today’s global automotive industry.
From Pilot to Production: The 2026 Inflection Point
For years, physical AI robotics and driverless tech lived in the same category as flying cars — perpetually five years away. That changed in mid-2026, when a cluster of commercial milestones landed within days of each other. PepsiCo became the first major U.S. consumer-goods company to disclose large-scale autonomous truck use on public roads, running driverless vehicles between bottling plants, storage facilities, and retail customers including Walmart and Dollar General. Simultaneously, Einride completed its business combination and began trading on Nasdaq, and multiple autonomous trucking developers — Aurora, PlusAI, Waabi, Kodiak Robotics — began preparing factory-built, driver-out trucks for mass production rather than retrofitted pilot vehicles.
| Milestone | Company | 2026 Status |
|---|---|---|
| Driverless highway trucking at scale | PepsiCo / Aurora | 35 trucks operating in Arizona |
| Fully driver-out commercial deliveries | Gatik | 60,000 orders completed, $600M contracted revenue |
| 1,000-mile validated driverless lane | Aurora Innovation | Fort Worth–Phoenix, 250,000+ driverless miles, zero system-attributed collisions |
| Long-haul paid delivery with no human in cab | Bot Auto | Houston–Dallas (230 miles) completed |
| Full safety-driver removal target | Volvo Autonomous Solutions | Q1 2027, U.S. Sunbelt corridor, 300+ trucks by end of 2027 |
| Humanoid production scale-up | Tesla Optimus | $20B capex; Gen 3 with 22 degrees of freedom, 50 actuators |
The Regulatory Map Is Catching Up
Autonomous freight is no longer operating in a legal gray zone in its core markets. Over half of U.S. states now have autonomous truck testing or operation rules, and 24+ states explicitly permit self-driving trucks, led by Texas, Arizona, Florida, Arkansas, and Nebraska — where the majority of current commercial operations run. Both Aurora and Gatik briefed the FMCSA and NHTSA ahead of launching driverless operations, establishing a federal engagement pattern other operators are now following. Internationally, Japan is targeting Level 4 autonomous trucks in 2026, UN regulatory harmonization for autonomous vehicles is expected by mid-2026, and Dubai has launched Apollo Go robotaxis via Uber with an explicit goal of 25% autonomous transportation by 2030.
The Humanoid Robot Market: From Demonstrators to Factory Floors
The industrial IoT story of 2026 isn’t just wheels — it’s hands. Hyundai Motor Group debuted its Atlas humanoid robot for production settings at CES 2026, and BMW Group is deploying Figure AI’s Figure 02 humanoid to improve productivity, safety, and consistency in automotive operations. Tesla’s Optimus Gen 3, now in production at the Fremont facility, features 22 degrees of freedom and 50 actuators — a meaningful dexterity leap that is the underlying justification for Tesla’s unprecedented $20 billion capex commitment to convert core vehicle production lines toward robot manufacturing, the single largest physical-AI capital investment made by any automotive OEM to date.
| Market Sizing Estimate | 2025/2026 Baseline | Long-Term Projection | Source Methodology |
|---|---|---|---|
| Broad physical AI market | $81.4B (2025) | $1.145T by 2035 (33.5% CAGR) | Kaiso Research |
| Narrower AI-robotics component | $0.89B (2025) | $15.24B by 2032 (47.2% CAGR) | Edge AI/perception-focused definition |
| Humanoid robotics specifically | ~$4.2B (2026) | $40.5B by 2033 (38.2% CAGR) | Industrial + service applications |
| Humanoid industry (long-run) | — | $750B by 2035 / $4T by 2050 | Roland Berger |
The variance across these estimates — spanning more than a factor of three — reflects genuine definitional disagreement in the industry: some trackers count only AI-native perception/planning software, others include the full hardware, sensor, and actuator supply chain. What’s consistent across every methodology is the direction and steepness of the growth curve, not the exact terminal number.
Where the Capital Is Actually Flowing
Investment in supply chain automation software and industrial IoT is concentrated in a few clear categories:
- Logistics and warehousing — the single largest application vertical by 2026 market share, spanning autonomous forklifts, pick-and-pack robotics, and warehouse fleet orchestration software.
- Automotive manufacturing — both as a deployment site (BMW, Hyundai) and as a capital source (Tesla’s Optimus pivot).
- Long-haul freight — Aurora, Gatik, Kodiak, Waabi, Bot Auto, and Volvo Autonomous Solutions collectively represent the most commercially mature driverless segment.
- Compute infrastructure — Nvidia’s Isaac GR00T and Cosmos models underpin a large share of the perception and planning stack across multiple manufacturers, making Nvidia a structural beneficiary regardless of which individual robotics vendor wins.
Amazon, notably, already operates over 1 million robots handling roughly 75% of its global fulfillment volume, illustrating that at true hyperscale, physical AI has already moved well past the pilot stage into core operational infrastructure — a preview of where the broader industrial economy is heading.
Risk Factors Every Investor and Operator Should Price In
| Risk Category | Detail |
|---|---|
| Deployment pace overstatement | IFR (International Federation of Robotics) takes a more conservative view than industry vendors, noting real-world humanoid deployment remains largely limited to demonstrators/pilots, with true commercialization sitting later in China’s 2026–2030 plan period |
| Battery and power limitations | Cited as a persistent technical constraint on humanoid endurance and continuous operation |
| Labor market disruption framing | Industry voices like Gatik’s VP of Government Relations argue automation is complementing, not replacing, the existing truck-driver workforce — a narrative distinction with real policy implications |
| Capital concentration risk | A small number of players (Tesla, Nvidia, Amazon, Figure AI, Aurora) account for a disproportionate share of both funding and deployed units |
| Cybersecurity and compliance readiness | Analysts now cite this as mandatory for global and regional market access, not an optional add-on |
FAQ
How large is the physical AI market expected to become? Estimates vary by methodology, but the most-cited long-run figures point to roughly $1.1–1.15 trillion by 2035 for the broad physical AI market, with the humanoid robotics segment alone potentially reaching $750 billion by 2035 and $4 trillion by 2050.
Are driverless trucks actually operating commercially today, or is this still a pilot technology? Both, depending on the operator. Companies like Gatik and Aurora have moved beyond pilots into paid, driver-out commercial operations with real contracted revenue, while others are still in supervised testing phases. Volvo has publicly committed to full driverless highway operations by Q1 2027.
Which industries are adopting physical AI robotics fastest? Logistics and warehousing hold the largest current market share, followed closely by automotive manufacturing and long-haul freight. Amazon’s fulfillment network, handling roughly 75% of its volume via over 1 million robots, represents the most mature large-scale deployment today.
What is the biggest risk to the physical AI investment thesis? Deployment-pace overstatement is the most commonly cited risk — more conservative industry bodies like the IFR note that real-world humanoid deployment remains largely limited to demonstrators and pilots, with full commercialization likely later in the decade than some vendor projections suggest.
Discover more from The Economy
Subscribe to get the latest posts sent to your email.

Social Security $90 Payment Claims: What’s Real, What’s a Scam, and What Your 2027 COLA Could Be

EU vs UK Electric Vehicle Tariffs: Impact on Automotive Supply Chains & Consumer Prices

Complete Guide to Home Loan Refinancing: Interest Rate Trends & Loan Calculation Strategies

Algorithmic Dogfights: Why the U.S. and China Must Establish Rules of Engagement for Autonomous Air Power

Stock Market Today: Dow, S&P 500, and Nasdaq Retreat as Treasury Yields

Global Economic Outlook 2026: 7 Forces Reshaping Markets, Trade and Business

Geopolitics and Your Portfolio: How International Affairs Move Global Markets

Conservative Party Conference 2026: What Badenoch’s Tax and Deregulation Pitch Means for the UK Economy

Planet Labs and Goldman: How Satellite Geospatial Data Is Reshaping Wall Street

Red Dye Diesel in 2026: Tax Exemptions, Regulations, and the Real Agricultural Impact

Student Loans in 2026: Forgiveness Updates, Consolidation, and Repayment Strategies

Why Did I Get $90 From Social Security? 8 Reasons Behind an Unexpected SSA Payment

Corporate America Faces a New Debt Test as US Borrowing Costs Surge

Goldman vs. Citi: Which Banking Giant Leads Modern Global Finance in 2026?

Oil Prices Break $100 in 2026: Middle East Conflict & Energy Markets

IMF & World Bank 2026 Global Economic Outlook: Growth, Inflation, Debt

Middle East War Economics 2026: Oil Prices & Energy Markets

China Stocks Today: Are Big Economies in Asia Nearing a Market Bottom?

High-CPM Finance Niches 2026: Publisher Monetization Blueprint

Crypto Daily Outlook: Bitcoin, Altcoins, and the Future of Decentralized Finance

PSX Forecast 2026: KSE-100, IMF Reviews & Geopolitics

Global Pension Systems Ranked: The World’s Best and Worst Retirement Frameworks

Enterprise AI Platforms Disrupting B2B SaaS in 2026: Full Analysis

Elon Musk’s Next Moves: Disrupting the 2026 Global Economy

Social Security Trust Fund 2032: OASI Depletion Timeline Explained

World’s Largest Economies: Ranking the Top Global Powers

GasBuddy Market Insights: How Crude Price Shifts Impact Local Fuel Cost Averages

World Bank & IMF Reports 2026: Why the “3% Growth” Consensus Is Actually a Debate
-

 Markets & Finance9 months ago
Top 15 Stocks for Investment in 2026 in PSX: Your Complete Guide to Pakistan’s Best Investment Opportunities
-

 Analysis8 months ago
Johor’s Investment Boom: The Hidden Costs Behind Malaysia’s Most Ambitious Economic Surge
-

 Analysis8 months ago
Top 10 Stocks for Investment in PSX for Quick Returns in 2026
-

 Banks9 months ago
Best Investments in Pakistan 2026: Top 10 Low-Price Shares and Long-Term Picks for the PSX
-

 Analysis8 months ago
Brazil’s Rare Earth Race: US, EU, and China Compete for Critical Minerals as Tensions Rise
-

 Investment9 months ago
Top 10 Mutual Fund Managers in Pakistan for Investment in 2026: A Comprehensive Guide for Optimal Returns
-

 Global Economy9 months ago
15 Most Lucrative Sectors for Investment in Pakistan: A 2025 Data-Driven Analysis
-

 Global Economy9 months ago
Pakistan’s Export Goldmine: 10 Game-Changing Markets Where Pakistani Businesses Are Winning Big in 2025