
Debt
Corporate America Faces a New Debt Test as US Borrowing Costs Surge


US Treasury yields have climbed to multi-year highs, pushing corporate financing costs higher and creating a growing refinancing challenge for American companies. The immediate pressure is concentrated among weaker borrowers, but a prolonged high-rate environment could eventually affect investment, mergers, buybacks and economic growth across corporate America.
The US bond market has entered a more difficult phase for corporate borrowers.
A sharp rise in Treasury yields is increasingly feeding into the cost of corporate debt, forcing companies to reconsider when and how they borrow. The impact is most severe for highly leveraged and lower-rated businesses, but even investment-grade companies are facing a more expensive capital market than they enjoyed during the ultra-low-rate era of the early 2020s.
The issue is no longer simply whether the Federal Reserve raises or cuts short-term interest rates. The bigger question for corporate America is how long long-term borrowing costs remain elevated.
That distinction matters because companies refinancing debt today are replacing old financing obtained at substantially lower rates with new debt priced in a very different market.
The Treasury market is setting a tougher price for corporate debt
The starting point is the US government bond market.
The 10-year Treasury yield has climbed to levels not seen in more than two decades, increasing the baseline rate against which much of the corporate bond market is priced. Recent market reporting has put the 10-year yield above 5%, with investors demanding greater compensation for holding long-duration government debt.
The Federal Reserve has warned that higher interest rates can increase debt-servicing costs for businesses with substantial leverage and upcoming refinancing requirements. The central bank has also noted that the corporate sector entered 2026 with relatively strong investment-grade credit quality, meaning the current environment should not automatically be interpreted as an economy-wide credit crisis.
That distinction is crucial.
The problem is increasingly concentrated in companies that have some combination of high leverage, weak cash flow, floating-rate liabilities or large amounts of debt coming due.
Federal Reserve financial-stability analysis supports the view that corporate credit vulnerabilities remain uneven rather than universal.
Why refinancing is becoming the central risk
Many companies borrowed heavily when interest rates were exceptionally low.
As those bonds mature, companies must either repay the debt from existing cash, refinance it at prevailing rates, sell assets, raise equity or reduce spending.
The refinancing arithmetic can be painful.
Suppose a company borrowed $10 billion at an average interest rate of 3%. Its annual interest bill would be approximately $300 million.
If that debt has to be refinanced at 6%, the annual interest expense rises to approximately $600 million.
The company has not borrowed another dollar, yet its annual financing burden has doubled.
That is why refinancing can become a hidden earnings shock.
Reuters estimates that approximately $4.3 trillion of US non-financial corporate bonds will mature between 2027 and 2031. Annual maturities are expected to rise from roughly $572 billion in 2027 to approximately $1.03 trillion in 2030.
This creates what investors increasingly describe as a corporate refinancing wall.
The weakest companies are feeling the pressure first
The deterioration is not evenly distributed.
Companies with investment-grade balance sheets can generally access capital markets more easily and often have diversified sources of funding.
Highly leveraged companies have fewer options.
According to the Financial Times, borrowing costs for companies rated CCC or lower have risen to approximately 17%, while their risk premium has reached about 12 percentage points.
That level of financing can fundamentally change corporate decision-making.
A project that looked profitable when money cost 5% may no longer make economic sense when financing costs move substantially higher.
This can lead companies to postpone:
- acquisitions;
- share buybacks;
- expansion projects;
- capital expenditure;
- hiring;
- new factories;
- technology investments;
- refinancing transactions.
The consequences can therefore spread beyond bond investors into the real economy.
Corporate America is not facing one uniform debt crisis
One of the most important nuances missing from many discussions about higher borrowing costs is that corporate America is highly divided.
At one end are highly profitable technology companies and other large investment-grade borrowers with enormous cash flows and strong access to capital markets.
At the other are highly leveraged companies whose earnings leave relatively little room to absorb a major increase in interest expense.
The Federal Reserve’s 2026 Financial Stability Report found that investment-grade corporate credit quality remained robust, although some riskier firms, particularly those dependent on private credit, were experiencing greater debt-servicing challenges.
That suggests the current environment is better described as a credit-selection problem than a generalized corporate solvency crisis.
The longer yields remain elevated, however, the greater the probability that today’s refinancing pressure becomes tomorrow’s default problem.
The corporate bond market is already sending signals
Market pricing provides an important window into this transition.
FRED data show Moody’s seasoned Baa corporate bond yield at approximately 6.73% on October 1, 2026. The Baa spread over the 10-year Treasury was about 1.49 percentage points at the beginning of October.
This distinction is important.
Corporate borrowing costs consist broadly of two components:
Treasury yield + corporate credit spread = corporate borrowing yield
The Treasury component compensates investors for the time value of money and government interest-rate risk.
The credit spread compensates investors for taking corporate credit risk.
When both rise simultaneously, companies experience a much more powerful increase in financing costs.
So far, much of the pressure has come from the Treasury side, although credit spreads for weaker borrowers have also widened substantially.
Paramount’s enormous financing illustrates the new reality
The Paramount Skydance transaction provides a particularly useful case study.
Paramount disclosed plans for tens of billions of dollars of debt financing connected with its acquisition of Warner Bros. Discovery. Its SEC filings show that the transaction involved substantial debt commitments, including a large bridge financing facility that was expected to be replaced or reduced through permanent financing.
The transaction demonstrates a broader challenge facing corporate finance teams.
When financing costs are uncertain, companies increasingly have to think about:
How much should we borrow?
For how long?
At what fixed rate?
How much floating-rate exposure should we accept?
Should we refinance now or wait?
Can the acquisition generate enough additional cash flow to justify the higher financing expense?
Those questions become especially important for highly leveraged mergers and acquisitions.
Why companies are shortening maturities
One logical response to high long-term interest rates is to avoid locking in today’s expensive financing for decades.
Companies may therefore prefer shorter maturities.
The strategy has an obvious advantage: if rates fall later, the company can refinance at a lower cost.
But it also creates another risk.
Shorter maturities mean more refinancing requirements in the future.
If interest rates remain high, companies could find themselves repeatedly refinancing debt at elevated rates.
That creates a difficult trade-off between paying more today for long-term certainty and accepting refinancing risk in exchange for shorter-term flexibility.
AI is creating an important exception
One of the most interesting features of the current credit market is the enormous borrowing associated with artificial intelligence infrastructure.
Technology companies are spending unprecedented amounts on data centres, chips, networking infrastructure and electricity capacity.
The Financial Times has reported estimates that hyperscalers could borrow around $1 trillion through 2030 to support AI infrastructure expansion.
For these companies, the calculation is different.
If management believes that failing to invest in AI infrastructure would result in losing a strategic position, higher financing costs may be treated as the price of maintaining competitive advantage.
This creates a strange two-speed corporate credit market.
AI-related investment can remain aggressive while other companies cut capital spending.
That divergence could become one of the defining characteristics of the next phase of the US corporate bond market.
The refinancing wall could become an earnings problem
The most important transmission mechanism is straightforward:
Higher Treasury yields → higher corporate borrowing costs → higher interest expense → lower free cash flow → reduced investment or weaker credit quality.
For companies with strong margins, the increase may be manageable.
For companies operating with thin margins, it can be decisive.
Consider a company generating $1 billion in annual operating cash flow and paying $300 million in interest.
If refinancing raises annual interest expense to $500 million, the company’s interest burden consumes a much larger share of its cash flow.
Management then has fewer resources available for investment, acquisitions, dividends and buybacks.
If revenues simultaneously weaken, the problem becomes more serious.
Could this trigger a wave of corporate defaults?
Not necessarily.
The Federal Reserve’s earlier 2026 assessment showed that corporate bond issuance remained strong and investment-grade credit quality was generally solid.
That provides an important cushion.
Large corporations have also had years to prepare for higher rates by extending maturities and locking in fixed-rate financing.
But the risk is asymmetric.
A stable economy can allow heavily indebted companies to refinance successfully.
A combination of high interest rates, slowing economic growth and falling corporate profits would be much more dangerous.
That is when refinancing pressure can turn into covenant breaches, distressed exchanges, restructurings and defaults.
The Federal Reserve has explicitly warned that higher rates can amplify vulnerabilities associated with leverage and upcoming refinancing needs.
What investors should watch next
Investors should focus on five indicators rather than Treasury yields alone.
1. The 10-year Treasury yield
A sustained move above current levels would increase the baseline cost of corporate financing.
2. High-yield credit spreads
A sharp widening would indicate that investors are demanding substantially greater compensation for corporate credit risk.
3. Corporate refinancing volumes
If companies begin delaying bond issuance, it could signal that borrowers consider market pricing too expensive.
4. Interest coverage ratios
Companies with declining earnings and rising interest expense are particularly vulnerable.
5. Default and distressed-debt indicators
A sustained increase in defaults would suggest that the refinancing problem is becoming a solvency problem.
The bigger issue is the cost of capital
The most important consequence of the bond sell-off may not be a sudden wave of bankruptcies.
It may be a gradual repricing of corporate decision-making.
For more than a decade, exceptionally low interest rates encouraged companies to borrow cheaply, refinance frequently, acquire competitors and return capital to shareholders.
That model becomes less attractive when the cost of capital rises substantially.
The result could be a more disciplined corporate environment in which companies demand higher returns from acquisitions and capital projects.
That may ultimately be healthy.
But the transition could be painful for companies that built their business models around cheap debt.
A new test for corporate America
The US economy has already demonstrated considerable resilience in the face of higher rates.
The question now is whether that resilience extends to a corporate sector facing a large refinancing cycle.
The numbers suggest that the pressure will build gradually rather than arrive as a single shock.
The immediate danger is concentrated among highly leveraged and lower-rated companies. Investment-grade borrowers remain considerably better positioned.
But the refinancing calendar means the issue cannot simply be dismissed.
With roughly $4.3 trillion of non-financial corporate bonds coming due between 2027 and 2031, the cost of money over the next several years will matter enormously.
If Treasury yields eventually decline, many companies could refinance more comfortably.
If yields remain elevated while earnings weaken, the pressure could move steadily up the credit spectrum.
That makes the current bond-market sell-off more than a story about government debt.
It is becoming a test of how much corporate America can adapt to a world in which capital is no longer cheap.
Bottom line
The US corporate sector is not yet facing a systemic debt crisis. The stronger borrowers retain substantial market access, while investment-grade credit quality remains relatively resilient.
But the refinancing cycle is creating a growing divide between companies that can absorb higher interest costs and those that cannot.
The crucial variable is therefore not simply whether the Federal Reserve raises or lowers its policy rate.
It is whether long-term borrowing costs remain high long enough for the refinancing wall to become an earnings and solvency problem.
For investors, the next phase of the credit cycle will be about separating companies that can grow their cash flows faster than their financing costs from those whose balance sheets were built for the era of cheap money.
Discover more from The Economy
Subscribe to get the latest posts sent to your email.


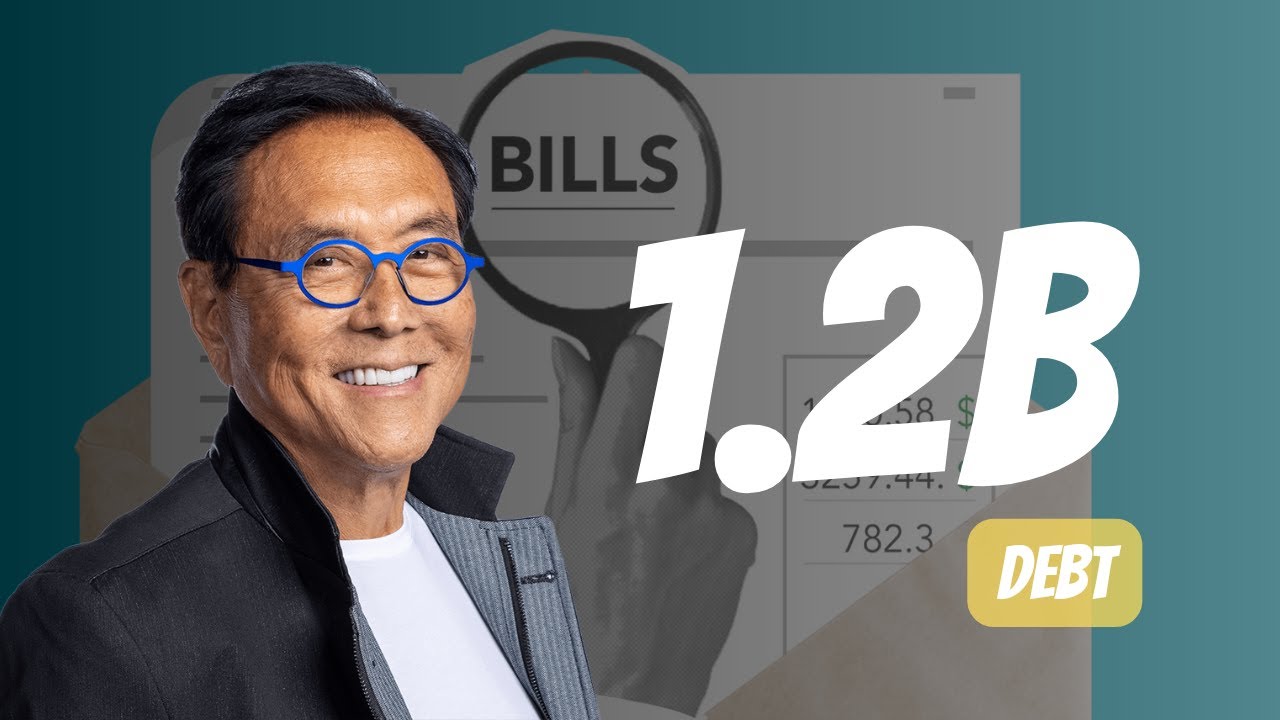
A disclosure putting Robert Kiyosaki’s real-estate-linked debt at $1.2 billion has renewed scrutiny of the “Rich Dad Poor Dad” author’s leveraged investing philosophy, but the figure needs context: it represents financing tied to roughly 1,500 apartment units, not personal liability, with Kiyosaki’s own equity stake estimated by Vanity Fair at just $30–60 million. The debt story lands alongside Kiyosaki’s continued bullish public calls on silver (targeting $200/oz from a recent level near $85) and Bitcoin, both framed as hedges against what he calls an unsustainable US debt and currency picture.
Kiyosaki’s Balance Sheet vs. Asset Predictions
| Metric | Figure | Context |
|---|---|---|
| Reported total real-estate-linked debt | $1.2 billion | Financing roughly 1,500 apartment units (non-recourse, asset-backed structure) |
| Kiyosaki’s personal equity stake (est.) | $30–60 million | Per Vanity Fair, as relayed by his former wife/business partner Kim Kiyosaki |
| Silver spot price (recent) | ~$85/oz | As of Kiyosaki’s public commentary, mid-2026 |
| Kiyosaki’s long-term silver target | $200/oz | Public statements, 2026 |
| Bitcoin price at time of debt disclosure | ~$77,476 | Early September 2026 |
| Bitcoin 2026 year-to-date low point (July) | -33% YTD | Before August recovery |
| Bitcoin YTD performance after August rebound | -10.91% YTD | Trimmed from -33% low |
| US spot Bitcoin ETF inflows (August 2026) | $3.5 billion | Strongest monthly inflow since July 2025 |
| Kiyosaki’s cited US national debt figure | ~$39 trillion | Public commentary basis for currency-devaluation thesis |
| Kiyosaki’s 2024 Bitcoin prediction ($350,000 by Aug. 25, 2024) | Did not materialize | Disclosed as a prediction, not a guarantee, per his own framing |
Sources: Hokanews and COINOTAG (Sept. 1–2, 2026), CoinCentral and Pluang (May 2026), Yahoo Finance (Nov. 2025, cited for prior-year price-target context).
Deep Dive: Separating the Debt Headline From the Investment Thesis
What the $1.2 Billion Debt Figure Actually Represents
The headline number is attention-grabbing, but the underlying structure matters more than the total. According to reporting that traces back to comments from Kim Kiyosaki — Robert’s former wife and long-time business partner — the $1.2 billion in liabilities sits against a portfolio of approximately 1,500 apartment units, and represents financing secured by those income-generating properties rather than unsecured personal debt. Vanity Fair separately estimated Kiyosaki’s own equity share of the underlying real estate at a considerably smaller $30 million to $60 million.
This distinction is central to understanding Kiyosaki’s own stated investment philosophy, which has for decades drawn a sharp line between what he calls “productive” debt — borrowing secured by cash-flowing assets that can service the loan through rental income — and consumer debt used to finance depreciating purchases. Whether or not one agrees with the framework, the reporting is consistent that the $1.2 billion is not money Kiyosaki personally owes in full, and the properties themselves generate rental income that is structured to service the debt.
The Risk the Structure Doesn’t Eliminate
Asset-backed, non-recourse-style borrowing can preserve liquidity and let an investor retain ownership of underlying properties without needing to sell assets to raise cash — a genuine advantage of the approach in a rising or stable property market. But the structure does not eliminate risk: heavy leverage of this kind exposes the investor to higher financing costs when rates rise and to potential impairment if property performance (occupancy, rents, or valuations) softens. A $1.2 billion debt load against a $30–60 million personal equity stake implies substantial leverage — a structure that amplifies both potential returns and potential losses if the underlying 1,500-unit portfolio’s performance were to deteriorate.
The Silver Thesis: A Decades-Old Position, Not a New Trade
Kiyosaki has repeatedly emphasized that his silver position dates back to 1965, when he began accumulating the metal at age 18, at a time when it traded for pennies per ounce. With spot silver recently trading near $85 an ounce, he has set a long-term target of $200, framing the metal as both a monetary hedge against currency devaluation and a bet on industrial demand. He is not alone in flagging silver as undervalued: multiple market commentators have pointed to depleted CME warehouse inventories and rising industrial consumption (driven substantially by solar panel and electronics manufacturing) as structural supports for higher prices, independent of Kiyosaki’s own commentary.
The Bitcoin Thesis, and a Track Record Worth Weighing Honestly
Kiyosaki has for years ranked among Bitcoin’s most vocal price bulls, and it’s worth being direct about his track record on specific price calls: a June 2024 prediction that Bitcoin would reach $350,000 by August 25 of that year did not materialize, a point he has acknowledged while maintaining that the level would eventually be reached — a framing that treats missed timelines as a delay rather than an invalidation of the underlying thesis. Bitcoin’s own 2026 trading history adds relevant context for anyone weighing his current calls: the asset fell roughly 33% year-to-date by July under tight monetary conditions before a V-shaped August recovery trimmed that loss to roughly 11%, a rebound that coincided with $3.5 billion in US spot Bitcoin ETF inflows for the month — the strongest since July 2025.
The Macro Thesis Tying It Together
Kiyosaki’s public framing consistently returns to the same structural argument: roughly $39 trillion in US national debt, combined with what he describes as ongoing dollar devaluation dating back to 1974 (a reference to the post-Bretton Woods fiat currency era), creates conditions he believes will culminate in a broader economic reckoning. He has also flagged fragility in baby boomer retirement portfolios — heavily concentrated in traditional stocks and bonds — as a systemic vulnerability if his broader crash thesis were to play out. It’s worth noting plainly that this crash-timing call is not new; Kiyosaki has made similar warnings across multiple years, and mainstream forecasters, per available reporting, largely continue to project moderate rather than crisis-level economic conditions, even while acknowledging genuine risks around sovereign debt levels and geopolitical tensions.
Reading Leverage as a Philosophy, Not Just a Number
Perhaps the more durable, transferable lesson from the Kiyosaki debt story — independent of whether his specific silver or Bitcoin price targets prove accurate — is the framework itself: asset-backed leverage against cash-flowing real estate is a genuinely different risk profile than unsecured personal debt, but “different” does not mean “risk-free.” Investors evaluating any leveraged real estate strategy, their own or a public figure’s, should look past the headline debt total to the underlying loan-to-value ratios, income coverage, and personal-versus-asset-level liability structure before drawing conclusions about how exposed the equity holder actually is.
Actionable Takeaways for Investors
- Separate headline debt figures from personal liability exposure in any leveraged real estate story. A $1.2 billion portfolio-level debt figure against a $30–60 million personal equity stake tells you about leverage ratio, not about what the individual investor stands to lose in an absolute-dollar sense.
- Track CME silver inventory levels as an independent check on the undervaluation thesis. This is a verifiable, non-Kiyosaki-specific data point that multiple analysts have cited separately from his commentary.
- Weigh any specific price target against the forecaster’s own disclosed track record. Kiyosaki’s 2024 Bitcoin call that did not materialize by its stated deadline is public, documented context worth factoring into how much weight to place on his current $200 silver target or ongoing Bitcoin bullishness.
- Distinguish asset-backed leverage from consumer debt when evaluating your own portfolio’s risk. The productive-versus-consumer debt framework Kiyosaki popularizes is a genuinely useful mental model, applicable well beyond his specific real estate holdings.
- Monitor Bitcoin ETF flow data as a more immediate sentiment gauge than any single commentator’s price target. The $3.5 billion August 2026 inflow figure is a concrete, trackable data point that offers a more current read on institutional positioning than any individual’s long-term price call.
Frequently Asked Questions
How much debt does Robert Kiyosaki actually have?
Reporting places Kiyosaki’s total real-estate-linked debt at approximately $1.2 billion, financing roughly 1,500 apartment units, but this is asset-backed portfolio debt rather than personal liability — his own equity stake in the underlying properties is estimated at $30 million to $60 million by Vanity Fair.
What is Robert Kiyosaki’s silver price prediction for 2026?
Kiyosaki has set a long-term target of $200 per ounce for silver, up from a recent trading level near $85, framing the metal as both a currency-devaluation hedge and an industrial-demand play, consistent with a position he says he began building in 1965.
Did Robert Kiyosaki’s past Bitcoin price predictions come true?
Not always — a June 2024 prediction that Bitcoin would reach $350,000 by August 25, 2024 did not materialize, a target he has acknowledged missed its timeline while maintaining he believes the price level will eventually be reached.
Why does Robert Kiyosaki think a global economic crash is coming?
Kiyosaki attributes his crash prediction to roughly $39 trillion in US national debt combined with dollar devaluation he traces to 1974, along with what he views as fragile baby boomer retirement portfolios overexposed to traditional financial assets — though mainstream economic forecasters generally project moderate rather than crisis-level growth.
Discover more from The Economy
Subscribe to get the latest posts sent to your email.
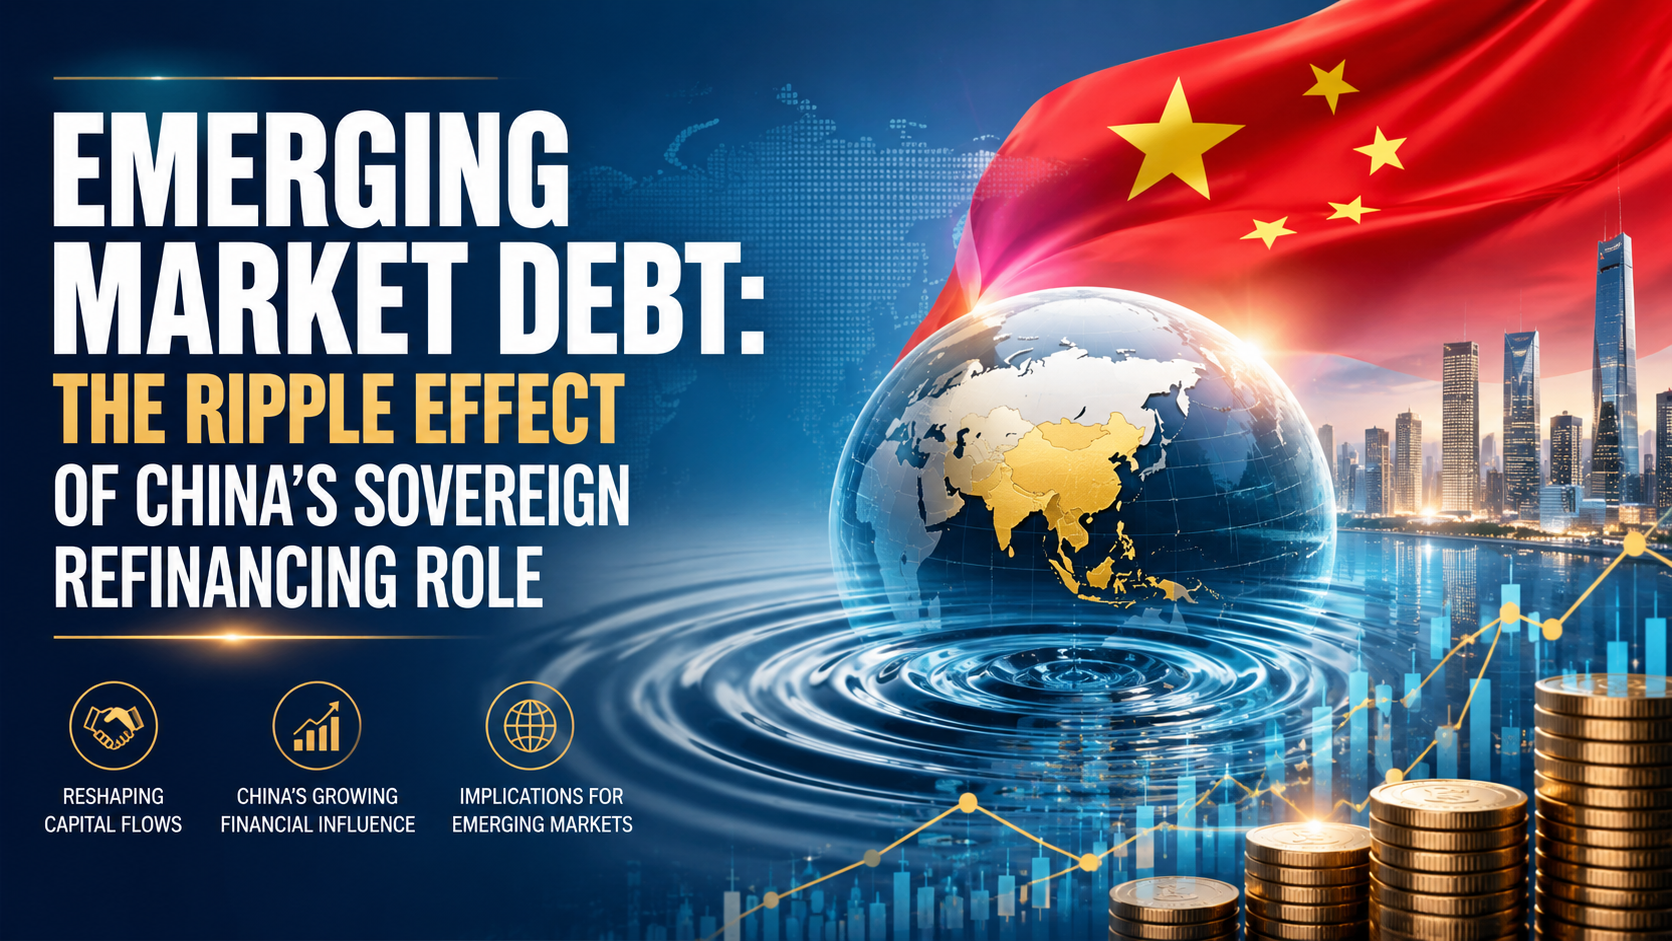
Emerging and developing economies face refinancing needs of more than $9 trillion in 2026, according to the Institute of International Finance’s Global Debt Monitor — the largest wall of maturing sovereign and corporate debt these markets have ever faced simultaneously. At the center of that system sits China, now the single largest issuer of emerging-market sovereign debt and, increasingly, the largest bilateral lender of last resort when smaller economies can’t refinance on their own. For institutional investors and foreign-policy-adjacent business strategists, understanding China’s dual role — dominant issuer and dominant creditor — is now a prerequisite for pricing emerging-market risk correctly.
Editorial note on sourcing: a specific figure describing a discrete “$1.3 billion” China sovereign refinancing transaction could not be independently verified against primary reporting at the time of writing. This article instead builds its analysis on verified, dated figures from the OECD, IIF, Moody’s, and peer-reviewed research, and any deal-level claim should be confirmed against primary sources (finance ministry statements, rating-agency releases) before publication or citation.
China’s Dual Role: Issuer and Creditor of Last Resort
China accounted for 45% of total EMDE sovereign bond issuance in 2024, up sharply from just 17% in the 2007–2014 period, according to the OECD’s Global Debt Report 2025. By 2025, China remained the top borrower among a concentrated group — China, India, Brazil, Egypt, and Argentina together represented 78% of EMDE central-government borrowing, per the OECD’s Global Debt Report 2026.
Domestically, Beijing has simultaneously executed one of the largest local-government debt refinancing programs in history: a 6 trillion yuan (roughly $839 billion) swap of “hidden” local-government debt into standardized bonds, approved in late 2024 and implemented through 2026, according to VOA News. By mid-2026, Chinese provinces had used nearly 94% of that swap allowance, according to Bloomberg.
Internationally, China has also re-entered dollar sovereign bond markets at scale — its 2026 international offering was reported as its largest ever, oversubscribed well beyond target, according to Business Standard/Reuters reporting on the prior comparable issuance. This dual positioning — massive domestic refinancing plus expanding international issuance — gives China outsized influence over EM bond-market liquidity and pricing benchmarks that smaller sovereigns then reference for their own issuance.
The $9 Trillion Wall: Why 2026 Is Different
The scale of what’s coming due matters more than any single deal. Key figures from the IIF’s Global Debt Monitor and OECD’s 2026 report:
- Gross EMDE central-government borrowing crossed $4 trillion in 2025, up from roughly $3 trillion in 2024.
- Around 36% of outstanding EMDE bond stock matures within three years.
- Low-income countries face the sharpest cliff: 52% of their outstanding bonds mature by 2028, with 29% due by the end of 2026 alone.
- Secondary-market yields on maturing debt now exceed 10% for non-investment-grade sovereigns, meaning refinancing at current rates locks in materially higher debt-service costs than the original issuance.
Refinancing Cost Comparison: Then vs. Now
| Issuer Tier | Original Issuance Yield (illustrative range) | 2026 Refinancing Yield | Refinancing Risk |
|---|---|---|---|
| Investment-grade EMDEs (e.g., select Gulf, Southeast Asia sovereigns) | 3–5% | 5–7% | Moderate — absorbable within fiscal space |
| Non-investment-grade EMDEs | 6–8% | 10%+ | High — debt-service costs rising faster than revenue growth |
| Low-income issuers (heavy China bilateral exposure) | Concessional/below-market | Market-rate or restructured terms | Severe — 29% of debt stock matures by end of 2026 |
Source: OECD Global Debt Report 2025/2026 (see citations above); ranges are illustrative of documented tier-level trends, not specific bond issues.
The Restructuring Precedent: What Happens When Refinancing Fails
China’s response to sovereign distress has evolved into a distinct pattern that investors increasingly price into risk premiums. Research published via the National Bureau of Economic Research documents a rising trend of “re-structurings” — repeated restructurings of the same debt with the same creditor — echoing the drawn-out resolution patterns of prior global debt crises. Angola, Ecuador, Seychelles, Sri Lanka, and Venezuela have each undergone two or more restructurings with Chinese state creditors.
Sri Lanka’s case is illustrative of the mechanics: China Development Bank extended a $500 million financing facility in 2020, and a subsequent equity-linked arrangement brought in $1.12 billion in cash that Colombo used to repay non-Chinese creditors, according to Oxford Academic’s International Affairs journal. These bilateral bridge arrangements illustrate how China’s rescue lending functions as a parallel track to traditional Paris Club-style restructuring — often faster to arrange, but less transparent to third-party bondholders pricing the same sovereign’s risk.
Regional Ripple Effects: Where Investors Should Watch Closely
Direct Exposure Zones
- Sub-Saharan Africa: Heaviest concentration of low-income issuers facing near-term maturity walls and prior China restructuring history (Angola, Zambia).
- South Asia: Sri Lanka’s precedent shapes how markets price Pakistan and Bangladesh refinancing risk.
- Latin America: Ecuador and Venezuela carry documented repeat-restructuring histories; Argentina remains among the top-five EMDE borrowers by volume.
Indirect / Second-Order Exposure
- Gulf and Southeast Asian investment-grade sovereigns face rising benchmark yields even without direct restructuring risk, simply because China’s issuance volume moves the EM bond-pricing benchmark broadly.
- Enterprise B2B lenders and trade-finance providers operating in these corridors should treat sovereign-refinancing stress as a leading indicator of counterparty and currency risk, not a lagging one.
An Investor Risk-Monitoring Framework
- Track maturity-wall concentration, not headline debt-to-GDP. A country with moderate debt-to-GDP but a heavy 2026–2028 maturity cliff carries more near-term risk than a higher-leverage country with a smoothed maturity profile.
- Distinguish China’s domestic refinancing (yuan-denominated, largely contained) from its role as an external EM creditor (dollar/foreign-currency exposure, higher spillover risk).
- Watch for repeat-restructuring signals. Countries with a prior China restructuring are statistically more likely to require another, per the NBER research above — treat this as a standing risk flag, not a one-time resolved event.
- Monitor secondary-market yield spreads on maturing debt versus issuance-year yields as the clearest real-time signal of refinancing stress building in a specific sovereign.
The Bottom Line
China’s simultaneous role as the largest domestic debt-refinancer in EM history and the most influential external creditor to distressed sovereigns makes it the single most important variable in the 2026 emerging-market debt outlook. The $9 trillion refinancing wall isn’t a uniform risk — it’s concentrated in low-income issuers with the heaviest prior China bilateral exposure, and that concentration is exactly where enterprise investors, trade-finance providers, and sovereign-risk analysts should be focusing due diligence through the remainder of 2026.
Discover more from The Economy
Subscribe to get the latest posts sent to your email.

There’s a number that keeps showing up in every conversation about Pakistan’s economy, and it keeps getting bigger: circular debt. As of early July 2026, the gas sector’s share of that debt alone has topped Rs 3.44 trillion, and Islamabad has missed a deadline the IMF set for tariff reforms meant to arrest the slide, according to Dawn.
What circular debt actually is, and why it won’t go away
Circular debt is the chain of unpaid obligations that builds up when the price consumers pay for electricity or gas doesn’t cover what it actually costs to produce and deliver it. Someone in the chain — a power producer, a gas utility, a state-owned enterprise — ends up carrying an IOU, and that IOU gets passed down the line. Earlier this year, IMF officials pressed Pakistan on exactly this dynamic, questioning the government’s plan to zero out gas-sector circular debt, according to Aaj English. At the time, officials said around Rs 150 billion remained payable to companies including Oil and Gas Development Company Limited and Pakistan Petroleum Limited.
Islamabad’s proposed fix included a Rs 5-per-unit levy on gas, dividends from state-owned companies redirected toward debt reduction, and the sale of 35 LNG cargoes annually on the international market. The IMF, per that same reporting, raised pointed questions about whether the plan was actually viable.
The commitments Pakistan has already made
Under its Extended Fund Facility, Pakistan has committed to capping circular debt growth at Rs 300 billion for FY2027 and cutting power-sector subsidies from 0.7% of GDP to 0.6%, according to details reported by ProPakistani. The government has also shifted Nepra’s annual tariff-rebasing cycle from July to January, and Ogra now revises gas tariffs twice a year instead of once.
Structurally, some of this is working. The IMF’s own review in May 2026 credited Pakistan with a primary fiscal surplus of 1.6% of GDP for FY26, broadly in line with program targets, and noted gross reserves had climbed to $16 billion by end-December, up from $14.5 billion six months earlier, according to the IMF’s own press release. That progress unlocked roughly $1.1 billion under the EFF and $220 million under a parallel climate-resilience facility, bringing total disbursements under the two arrangements to about $4.8 billion.
Where the fault lines actually are
The uncomfortable part of this story, laid out by commentary reported in The Hans India, is that revenue targets get IMF scrutiny with great precision, while structural reform of loss-making public enterprises — Pakistan International Airlines and Pakistan Steel Mills chief among them — moves far more slowly. Those enterprises’ losses are absorbed by the national exchequer through subsidies, guarantees, and debt restructuring year after year, and privatization plans keep slipping because the political cost of confronting them is high.
Distribution company inefficiency compounds the problem. In FY25, Discos posted Rs 265 billion in losses, an improvement on FY24’s Rs 276 billion but still a substantial drag, according to Geo News, with Quetta, Peshawar and Hyderabad among the worst-performing utilities.
What happens if the pattern holds
Pakistan’s debt-to-GDP ratio sits between 70% and 80% as of 2026, according to Wikipedia’s economic summary, with debt servicing occasionally consuming two-thirds of government spending. That’s the backdrop against which every circular-debt conversation happens: there is very little fiscal room left to absorb another missed deadline.
The missed gas tariff deadline doesn’t automatically trigger a program breakdown — Pakistan has weathered similar friction points before during its current EFF arrangement. But with the IMF’s own documentation showing persistent concern about the credibility of debt-reduction plans, and with global energy prices still elevated in the aftermath of the Iran war, the margin for further slippage is thin. The next review will likely hinge less on the rhetoric around reform and more on whether the Rs 5 levy and LNG cargo sales actually show up in the numbers.
Discover more from The Economy
Subscribe to get the latest posts sent to your email.

Geopolitics and Your Portfolio: How International Affairs Move Global Markets

Conservative Party Conference 2026: What Badenoch’s Tax and Deregulation Pitch Means for the UK Economy

Planet Labs and Goldman: How Satellite Geospatial Data Is Reshaping Wall Street

Red Dye Diesel in 2026: Tax Exemptions, Regulations, and the Real Agricultural Impact

Student Loans in 2026: Forgiveness Updates, Consolidation, and Repayment Strategies

Why Did I Get $90 From Social Security? 8 Reasons Behind an Unexpected SSA Payment

Corporate America Faces a New Debt Test as US Borrowing Costs Surge

Goldman vs. Citi: Which Banking Giant Leads Modern Global Finance in 2026?

Beyond Hanoi & HCMC: How Northern Industrial Clusters Are Driving Vietnam’s 10% Growth Surge

Analytical Review of The Economist’s “What is the Right Tax System for the 21st Century?”

Southeast Asia’s LNG Dilemma: Navigating Price Volatility, Infrastructure Gaps, and Energy Security

Who Is Shivon Zilis? The Neuralink Executive at the Center of the Musk–OpenAI Trial

ChatGPT Traffic Rebounds in 2026: Why OpenAI’s AI Giant Is Winning Users Back

U.S.-Ireland Trade Dynamics: Trump’s Investment Push

Oil Prices Break $100 in 2026: Middle East Conflict & Energy Markets

IMF & World Bank 2026 Global Economic Outlook: Growth, Inflation, Debt

Middle East War Economics 2026: Oil Prices & Energy Markets

China Stocks Today: Are Big Economies in Asia Nearing a Market Bottom?

High-CPM Finance Niches 2026: Publisher Monetization Blueprint

Global Pension Systems Ranked: The World’s Best and Worst Retirement Frameworks

Enterprise AI Platforms Disrupting B2B SaaS in 2026: Full Analysis

Social Security Trust Fund 2032: OASI Depletion Timeline Explained

Elon Musk’s Next Moves: Disrupting the 2026 Global Economy

Crypto Daily Outlook: Bitcoin, Altcoins, and the Future of Decentralized Finance

GasBuddy Market Insights: How Crude Price Shifts Impact Local Fuel Cost Averages

World Bank & IMF Reports 2026: Why the “3% Growth” Consensus Is Actually a Debate

PSX Forecast 2026: KSE-100, IMF Reviews & Geopolitics

Global Equity Market Divergence: US Tech vs. European Dividend Stocks vs. Asian Growth
-

 Markets & Finance9 months ago
Top 15 Stocks for Investment in 2026 in PSX: Your Complete Guide to Pakistan’s Best Investment Opportunities
-

 Analysis8 months ago
Johor’s Investment Boom: The Hidden Costs Behind Malaysia’s Most Ambitious Economic Surge
-

 Analysis8 months ago
Top 10 Stocks for Investment in PSX for Quick Returns in 2026
-

 Banks9 months ago
Best Investments in Pakistan 2026: Top 10 Low-Price Shares and Long-Term Picks for the PSX
-

 Analysis8 months ago
Brazil’s Rare Earth Race: US, EU, and China Compete for Critical Minerals as Tensions Rise
-

 Investment9 months ago
Top 10 Mutual Fund Managers in Pakistan for Investment in 2026: A Comprehensive Guide for Optimal Returns
-

 Global Economy9 months ago
15 Most Lucrative Sectors for Investment in Pakistan: A 2025 Data-Driven Analysis
-

 Global Economy9 months ago
Pakistan’s Export Goldmine: 10 Game-Changing Markets Where Pakistani Businesses Are Winning Big in 2025