
Asia
Will China’s $1.2 Trillion Trade Surplus Overwhelm Global Trade?

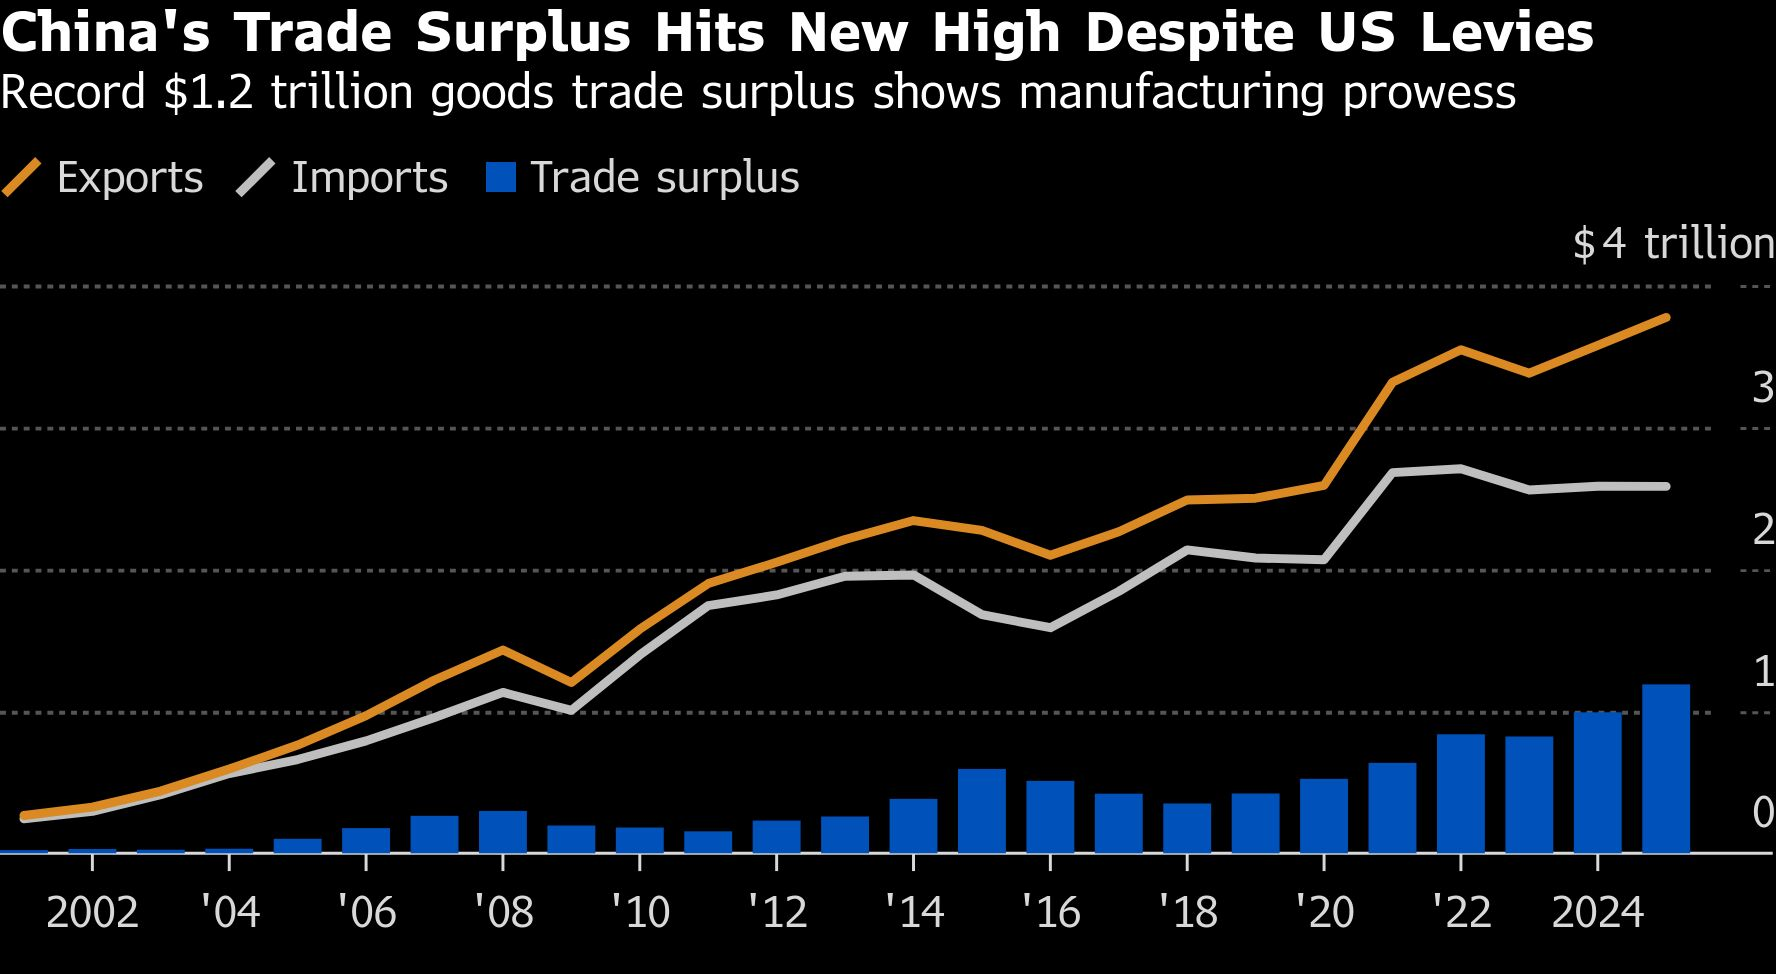
Just weeks into 2026, China’s economic data release has sent shockwaves through global financial markets and policy circles. Despite an escalating tariff war and predictions of export decline, China’s 2025 trade surplus reached an astonishing $1.2 trillion—the largest in modern economic history. This wasn’t supposed to happen. As Washington imposed punitive tariffs and Brussels contemplated countermeasures, conventional wisdom held that China’s export machine would finally slow. Instead, it accelerated, raising profound questions about the future architecture of global commerce and whether the international trading system can absorb such concentrated imbalances without fracturing.
The numbers reveal more than an economic anomaly. They expose a fundamental recalibration of global trade flows, the resilience of China’s manufacturing ecosystem, and the limitations of tariff-based trade policy. For policymakers in Washington, Brussels, and emerging economies alike, China’s record trade surplus represents both a challenge and a mirror—reflecting deeper questions about industrial competitiveness, currency dynamics, and the sustainability of growth models built on either consumption or production extremes.
The Record-Breaking Numbers: What the Data Really Shows
According to official data released by China’s customs authority in mid-January, China’s 2025 trade surplus reached approximately $1.189 trillion, with exports growing 5.9% year-on-year to $3.58 trillion while imports barely budged at $2.39 trillion. The magnitude staggers: this surplus exceeds the entire GDP of most nations and dwarfs previous records, including China’s own pre-pandemic peaks.
Breaking down the numbers reveals the mechanics of this surge. Exports to the United States—the focal point of trade tensions—actually declined sharply by double digits in the final months of 2025, precisely as anticipated. Yet this contraction was more than offset by explosive growth elsewhere. Chinese exports to ASEAN nations surged approximately 15%, to the European Union by 8-10%, and to Latin America and Africa by double-digit percentages, as Bloomberg’s analysis documented. China’s export base, it turns out, had quietly diversified far more effectively than Western analysts appreciated.
The import side tells an equally important story. While export values climbed, import growth flatlined at roughly 1%, reflecting tepid domestic demand and China’s increasing self-sufficiency in key inputs. This asymmetry—surging exports coupled with stagnant imports—transformed what might have been a respectable trade performance into a historic imbalance. China now accounts for approximately 14% of global goods exports but only 11% of imports, creating a structural gap that redistributes demand away from trading partners.
Drivers of the Surge: Deflation, Currency, and Diversification
Three interconnected forces propelled China’s trade performance to record heights, each reinforcing the others in ways that confounded trade policy aimed at a single pressure point.
Production-side deflation emerged as the unexpected catalyst. China’s producer price index remained negative or near-zero throughout 2025, meaning factory-gate prices actually fell even as global inflation persisted elsewhere. This deflationary environment—driven by overcapacity in manufacturing sectors from steel to electric vehicles—made Chinese goods increasingly price-competitive globally. A solar panel, EV battery, or textile manufactured in China cost 10-20% less than a year prior, while competitors in Vietnam, Mexico, or Eastern Europe struggled with rising input costs. For importers worldwide facing inflation-squeezed consumers, Chinese products became irresistible.
The renminbi’s carefully managed depreciation amplified this price advantage. The currency weakened approximately 5% against the dollar in 2025, making exports cheaper in foreign currency terms while raising the cost of imports. Whether this reflected deliberate policy or market forces remains debated, but the effect was unambiguous: Chinese exporters gained a compounding advantage. The Financial Times noted that Beijing walked a tightrope, allowing enough depreciation to support exports without triggering capital flight or Western accusations of currency manipulation.
Perhaps most significantly, China’s geographic diversification strategy matured. The Belt and Road Initiative, RCEP trade agreements, and targeted investment in emerging markets created alternative export corridors precisely when needed. When U.S. tariffs threatened 40% of potential exports, Chinese manufacturers had already cultivated relationships in Jakarta, Lagos, Mexico City, and Warsaw. These weren’t merely replacement markets but growing economies hungry for affordable industrial goods, consumer electronics, and infrastructure inputs that China produces at scale.
This diversification operated at multiple levels. Chinese firms established assembly operations in Vietnam and Mexico to circumvent tariffs—a practice trade officials call “transshipment” but which represents rational supply chain optimization. Meanwhile, exports of intermediate goods to these countries surged, meaning final products bore “Made in Vietnam” labels while value-added remained substantially Chinese. The New York Times analysis highlighted how this “tariff arbitrage” effectively neutralized much of Washington’s trade offensive.
Winners and Losers: Sectoral and Regional Impacts
The record surplus wasn’t evenly distributed across China’s economy. Electric vehicles, batteries, and solar panels emerged as star performers, with exports in these “new three” categories surging by 30-60% to global markets eager for energy transition technologies. Europe’s green transition targets and emerging market electrification created insatiable demand that only China’s manufacturing scale could meet. A European buyer could choose between a €35,000 Chinese EV or a €50,000 European alternative—and increasingly chose the former.
Traditional manufacturing sectors told different stories. Electronics and machinery maintained steady growth of 5-8%, benefiting from global digitalization trends and China’s dominance in semiconductor assembly and consumer electronics. However, textiles and apparel faced headwinds as production continued shifting to Bangladesh, Vietnam, and India, where labor costs remained lower. The surplus in these legacy sectors shrank, even as higher-value manufactured goods compensated.
Regionally, coastal manufacturing hubs in Guangdong, Jiangsu, and Zhejiang captured the lion’s share of export growth, while interior provinces lagged. This geographic concentration reinforced China’s internal economic imbalances—precisely the problem Beijing’s “dual circulation” policy aimed to address. The export surge, paradoxically, may have delayed necessary rebalancing toward domestic consumption.
For China’s trading partners, the impacts varied dramatically. ASEAN nations benefited as both alternative markets and manufacturing partners, seeing Chinese investment and supply chain integration accelerate. European importers gained access to affordable goods that helped contain inflation, though manufacturers voiced growing concerns about unfair competition from subsidized Chinese rivals. The United States experienced the predicted surge in non-Chinese imports that were frequently Chinese in origin—the trade deficit persisted even as bilateral flows declined.
Emerging economies faced a more complex calculus. Affordable Chinese machinery, vehicles, and industrial inputs supported development and infrastructure projects. Yet domestic manufacturers in countries like India, Brazil, and South Africa struggled against Chinese competition, prompting protectionist responses. As one trade economist observed, China’s surplus represented simultaneous opportunity and threat—infrastructure enabler and industrial destroyer.
Geopolitical Ripple Effects: Tariffs, Protectionism, and Retaliation Risks
The record surplus arrives at a geopolitically fraught moment, potentially catalyzing a new wave of protectionist measures that could fragment global trade more decisively than anything witnessed since the 1930s.
Washington’s reaction has been predictably sharp. With the 2025 data confirming that tariffs failed to reduce the bilateral deficit meaningfully, voices across the political spectrum are demanding more aggressive measures. Proposals under discussion include universal tariffs on all Chinese imports, secondary sanctions on countries facilitating transshipment, and restrictions on Chinese investment in strategic sectors. The Wall Street Journal reported that bipartisan congressional coalitions view the surplus as vindication of hawkish trade policy, not evidence of its failure.
The European Union confronts its own dilemma. European consumers benefit from affordable Chinese goods that suppress inflation, yet manufacturers face existential threats from subsidized Chinese EVs and industrial products. Brussels has initiated anti-subsidy investigations and considered carbon border adjustment mechanisms, but internal divisions between manufacturing-heavy Germany and consumption-oriented economies complicate unified action. The surplus forces Europe to choose between consumer welfare and industrial policy—a choice it’s reluctant to make.
For emerging economies, China’s surplus creates a prisoner’s dilemma. Individual countries benefit from Chinese investment and affordable imports, yet collectively they risk long-term deindustrialization. India has imposed targeted tariffs and investment restrictions, while Brazil and South Africa debate similar measures. Yet aggressive countermeasures risk alienating a crucial trading partner and infrastructure financier. The result is a patchwork of inconsistent responses that leaves global trade governance weakened.
The currency dimension adds another layer of complexity. A $1.2 trillion surplus represents enormous downward pressure on the renminbi, which China’s central bank must counteract through intervention or capital controls. This accumulation of foreign exchange reserves—already the world’s largest—raises questions about currency manipulation that could trigger coordinated Western responses. Yet allowing the renminbi to appreciate would devastate export competitiveness, creating a policy trap Beijing may struggle to escape.
Perhaps most concerning is the erosion of multilateral trade governance. The WTO, already weakened, offers no clear mechanism to address such concentrated imbalances. Bilateral negotiations have proven ineffective. The risk is that countries increasingly resort to unilateral measures—tariffs, quotas, subsidies, and sanctions—that fragment global commerce into competing blocs. The record surplus, in this view, isn’t merely an economic statistic but a catalyst for systemic breakdown.
Can This Continue? 2026 Outlook and Policy Dilemmas
Projecting whether China can sustain or expand its record surplus involves weighing contradictory forces, each powerful enough to reshape trade flows dramatically.
Headwinds appear formidable. Global demand growth is slowing as major economies navigate post-pandemic adjustments and elevated interest rates. The tariff offensive will intensify—both from the U.S. and increasingly from Europe and emerging economies concerned about Chinese overcapacity. China’s demographic decline and rising labor costs erode competitiveness in labor-intensive sectors. Most significantly, the political tolerance for such concentrated imbalances is exhausted. Further surplus expansion risks triggering coordinated protectionist responses that could overwhelm even China’s diversification efforts.
Yet countervailing forces remain strong. China’s manufacturing ecosystem offers scale, speed, and cost advantages competitors struggle to match. The energy transition creates massive demand for Chinese-dominated technologies—EVs, batteries, solar panels—where alternatives remain years behind in cost and capacity. Belt and Road and RCEP integration continues deepening, creating trade corridors partially insulated from Western pressure. China’s ability to manage currency and deploy industrial subsidies gives it policy tools competitors lack.
The likely scenario isn’t simple continuation but rather volatility around a persistently high plateau. The surplus may moderate from $1.2 trillion but remain historically elevated—perhaps $800 billion to $1 trillion annually. Geographic composition will shift as some markets impose barriers while others open. Sectoral mix will evolve toward higher-value goods as low-end manufacturing continues migrating elsewhere.
Beijing faces its own policy dilemmas. The export surge masked deeper problems: weak domestic demand, deflation, property sector distress, and mounting local government debt. The record surplus reflects not just export strength but consumption weakness—Chinese households saving rather than spending. Rebalancing toward domestic consumption would reduce the surplus but requires politically difficult reforms: stronger social safety nets, reduced savings incentives, and allowing wages to rise faster than productivity.
There’s also a temporal dimension. China’s surplus may represent a last hurrah before demographic decline, rising costs, and supply chain diversification take their toll. Countries and firms are actively reducing China dependency—”de-risking” in diplomatic parlance. Vietnam, India, Mexico, and others are attracting investment that might have gone to China a decade ago. These shifts take years to materialize, meaning China’s export dominance may persist medium-term before eroding long-term.
Conclusion: A Turning Point for Global Trade?
China’s $1.2 trillion trade surplus represents more than an impressive economic statistic—it’s a stress test of global trade architecture, revealing fractures that may prove irreparable under current frameworks.
The surplus demonstrates that tariffs alone cannot rebalance trade relationships when cost advantages, manufacturing ecosystems, and alternative markets exist. It shows that global value chains have grown complex enough to route around bilateral restrictions. It confirms that concentrated economic power—whether American financial dominance or Chinese manufacturing supremacy—creates systemic risks that multilateral institutions can no longer manage.
Yet it also reveals vulnerabilities. China’s economy remains dangerously dependent on external demand even as trading partners grow hostile. The surplus itself evidence of imbalanced growth—too much production, too little consumption—that stores up future risks. Global tolerance for such concentration has limits, and those limits may be approaching.
The coming years will likely witness competing forces: China’s formidable manufacturing advantages against rising protectionism; globalization’s efficiency gains against geopolitical fragmentation; multilateral governance against unilateral power. Which force prevails will shape not just trade flows but the global economic order itself.
For investors, policymakers, and business leaders, several questions demand attention: Can Western economies rebuild manufacturing competitiveness without prohibitive costs? Will emerging markets become genuine alternatives to China or remain dependent suppliers? Can global trade governance adapt to concentrated power, or will it fracture into competing blocs? And perhaps most fundamentally: Is a $1.2 trillion surplus sustainable economically, or merely sustainable politically until it suddenly isn’t?
The answers will determine whether 2025’s record marks a peak or a plateau—and whether global trade can accommodate such imbalances or will be overwhelmed by them.
Discover more from The Economy
Subscribe to get the latest posts sent to your email.


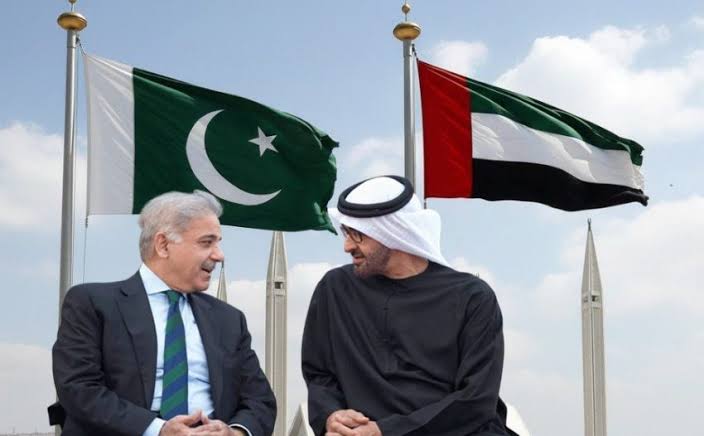
What happened: In early 2026, the United Arab Emirates declined to roll over a $3 billion loan to Pakistan — the first such refusal in seven years. The repayment equalled roughly 18% of Pakistan’s foreign currency reserves, arriving as Islamabad also faced a $1.3 billion bond payment and was waiting on the next IMF tranche.
Why it matters: It’s the clearest sign yet that Gulf sovereign patience with Pakistan’s balance-of-payments cycle is thinning, even as Gulf states simultaneously court China, Saudi Arabia, and each other for capital in a tightening regional liquidity environment.
The Story Nobody’s Connecting
Most coverage of Pakistan’s 2026 external account stress treats the UAE’s loan decision as an isolated liquidity event — a “routine financial transaction,” in the words of Pakistan’s own Ministry of Foreign Affairs. That framing misses the bigger pattern. The same weeks that Abu Dhabi called in its $3 billion, unusual delays began appearing in bank transfers from Saudi Arabia to the UAE itself — friction between the Gulf’s two largest economies, at a moment when both are also managing their own post-war oil price adjustment. (Pakistan & Gulf Economist)
Put those two data points together and a different story emerges: this isn’t just about Pakistan’s creditworthiness. It’s about Gulf capital becoming more selective, more transactional, and less willing to extend informal grace periods across the board — with Pakistan simply the most exposed borrower in the queue.
The Numbers Behind the Pressure
Pakistan’s State Bank held $16.4 billion in reserves as of late March 2026 — enough to cover roughly three months of imports, a threshold economists generally treat as a comfort floor, not a cushion. (Mettis Global News) The UAE’s declined rollover landed at the same time as a looming $1.3 billion international bond payment and dependence on the next $1.2 billion IMF disbursement — a convergence of obligations that left the State Bank with limited room to maneuver beyond import restrictions, rate hikes, or fresh commercial borrowing.
The backdrop matters too. The rupee had been trading in a comparatively narrow 278–282 band before the escalation of the Iran conflict pushed global oil prices higher, squeezing Pakistan’s import bill precisely when its Gulf safety net began to wobble. The KSE-100 benchmark, meanwhile, had already shed around 15% amid the broader pressure. (Mettis Global News)
This is not Pakistan’s first Gulf-dependency cycle. The IMF’s own record shows a now-familiar pattern: staff-level agreements reached in Dubai, UAE pledges of multibillion-dollar investment arriving alongside IMF tranches, and Gulf bridge financing used to stave off sovereign default in periods when reserves cover shrinks toward zero. (Business Standard) What’s different in 2026 is that the bridge itself is showing cracks.
Islamabad’s Official Line vs. the Structural Reality
Pakistan’s government has leaned into a “stability to sustainable growth” narrative around its FY2026–27 federal budget, with the finance minister framing the transition as export-driven rather than reserve-dependent. Business groups have broadly welcomed the budget, and the current account posted a $459 million surplus in May 2026, an improvement attributed to strong remittance inflows. (Business Recorder) The Monetary Policy Committee has held rates steady rather than reaching for emergency tightening, which is itself a signal that the central bank does not yet see the UAE episode as a systemic trigger.
But a current account surplus built substantially on remittances is different from one built on export competitiveness or durable FDI. Pakistan’s trade structure still leans heavily on a narrow set of partners: China supplies over a quarter of its imports and a meaningful share of its exports, the UAE is both a top export destination and its second-largest import source, and Gulf states collectively remain the primary channel for both remittances and emergency liquidity. (Wikipedia — Economy of Pakistan) That concentration is precisely what makes a single Gulf lender’s changed appetite so consequential.
Why the Oil Backdrop Compounds the Risk
None of this is happening in a vacuum. The IMF’s own July 2026 commentary noted that global oil markets “absorbed the war shock” from the Iran conflict, but cautioned that buffers — spare production capacity, strategic reserves, shipping insurance capacity — are running low. (IMF Blog) For an oil-importing, reserve-constrained economy like Pakistan, a second energy price shock without deeper buffers would land directly on the same reserves the UAE loan was meant to protect.
What to Watch Next
- Whether Saudi Arabia steps in as an alternative bridge lender, or whether the Riyadh–Abu Dhabi transfer friction signals a broader Gulf liquidity tightening that limits everyone’s appetite to backstop Pakistan.
- The pace and size of the next IMF tranche, and whether Fund conditionality shifts to demand deeper reserve buffers given the UAE precedent.
- Whether China increases its role as lender of last resort, deepening Pakistan’s dependency in exactly the direction Gulf financing was historically meant to offset.
Discover more from The Economy
Subscribe to get the latest posts sent to your email.
Introduction
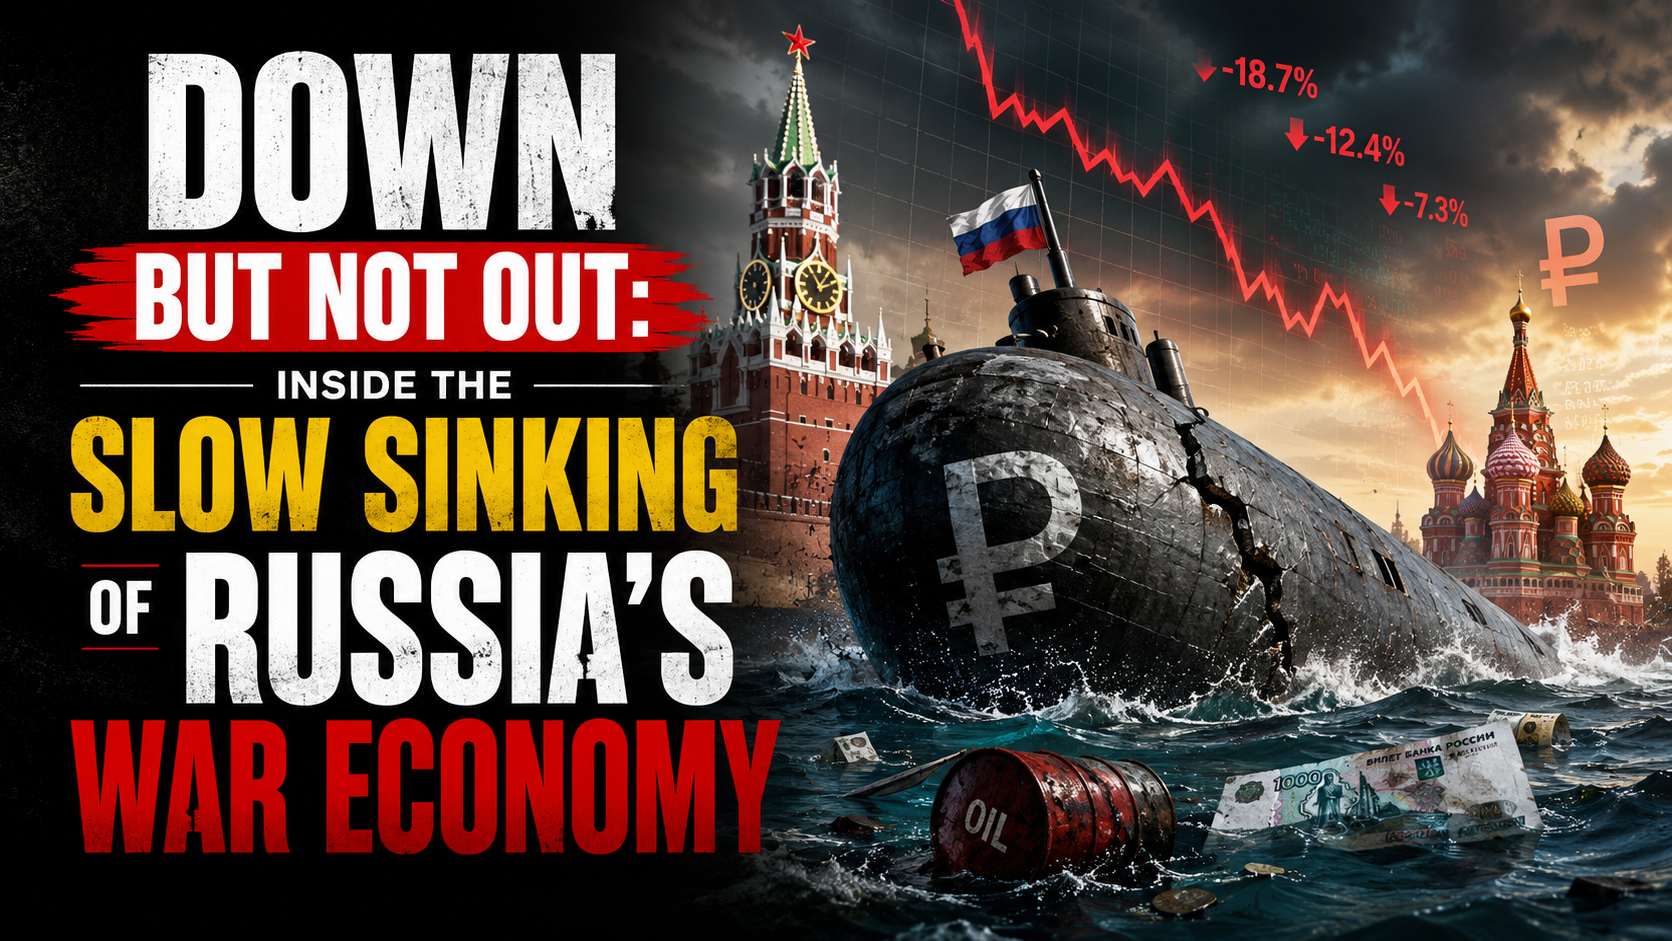
The European Council formally extended its economic sanctions against Russia for another full year on 25 June 2026, keeping restrictive measures in place until 31 July 2027 (Council of the EU). More than four years into the war, the headline story of Russia’s economy has shifted from whether sanctions would work to a more nuanced question: how much longer can the Kremlin keep financing the war before the accumulated strain becomes impossible to hide behind favorable official statistics.
The Sanctions Architecture, Renewed Again
The EU’s economic measures against Russia, first introduced in 2014 and dramatically expanded after the February 2022 full-scale invasion, now span trade, finance, energy and dual-use technology restrictions, alongside asset freezes and travel bans on a broad range of individuals and entities (Council of the EU). Since February 2022, the EU has adopted 20 separate sanctions packages, and the European Council has explicitly stated it remains determined to keep weakening Russia’s war economy by further reducing its energy revenues, curbing shadow-fleet oil shipping operations and constraining its banking system (Council of the EU). Separately, on 3 July 2026 the EU sanctioned six individuals connected to the poisoning and death of opposition figure Alexei Navalny, underscoring that the sanctions regime continues to expand on human-rights grounds as well as economic ones (Council of the EU Sanctions Timeline).
The Headline Numbers Beijing-Style Optimism Can No Longer Explain Away
Russia’s GDP is now put at roughly $2.51 trillion, the world’s eleventh-largest economy — comparable in size to South Korea despite Russia’s vastly larger landmass and resource base — with 2026 growth projected at just 1.0% and inflation running at 5.2% (Statistics of the World). More pessimistic estimates put full-year 2026 growth even lower, at around 0.4%, which would be worse than 2025’s already-weak 1% expansion and would mark a sharp deceleration from the 4.1% growth Russia posted in 2023 as it forged new trading relationships to route around initial sanctions (Forbes).
Oil and gas revenues — historically around half of Russia’s state income — have fallen to roughly a quarter, a deliberate outcome of Western sanctions strategy that targets how much Russia earns from exports rather than blocking those exports outright (Stockholm School of Economics/SITE). Russia’s oil and gas budget revenues reportedly halved in January 2026 alone, with crude prices falling below $73 a barrel before the Middle East conflict briefly reversed the trend, sending Brent surging more than 55% to near $120 a barrel at its peak (Forbes).
The Middle East War: A Temporary Lifeline With Long-Term Costs
The spike in oil prices tied to the Iran conflict, combined with a period of eased US sanctions enforcement on Russian oil under President Trump, offered Moscow unexpected fiscal breathing room in mid-2026 (Forbes). But that same conflict has undermined Russia’s longer-term energy diversification ambitions in the region: two Russian-backed power plant projects in Iran have been put on hold, along with oil and gas exploration work and plans to build new transit routes linking Russia to India via Iran (Forbes).
The Gap Between Official Statistics and Underlying Reality
Perhaps the most important analytical point from recent research is not about any single data point but about the reliability of Russian statistics themselves. Torbjörn Becker of the Stockholm Institute of Transition Economics has argued the real test of sanctions is not whether they end the war overnight, but how much they erode the Kremlin’s capacity to finance it — and by that measure, the evidence points to deeper strain than headline GDP figures suggest (Stockholm School of Economics/SITE). Becker notes that Russia’s economy grew only modestly in 2022 despite oil prices rising sharply that year — a gap between expected and actual performance that implies a considerably larger hidden economic hit than the official contraction figures showed (Stockholm School of Economics/SITE). Compounding the problem, Russian authorities have stopped publishing several key statistics since 2022, making independent assessment of inflation, consumption and real economic conditions increasingly difficult — leading Becker to conclude that “statistics have become part of the narrative” rather than a neutral measure of economic reality (Stockholm School of Economics/SITE).
The Military-Civilian Economic Split
A recurring theme across recent analysis is the growing bifurcation between Russia’s overheating military-industrial sector and a stagnating civilian economy. This imbalance has pushed interest rates higher and forced the liquidation of a striking 71% of Russia’s gold reserves to help fund continued war spending (Forbes). Russia’s total fossil fuel export revenue is estimated at roughly €734 million per day, underscoring just how central hydrocarbon income remains to the entire war financing model even as that revenue stream shrinks (Forbes).
The Counter-Narrative: Wages Still Rising
It would be inaccurate to describe Russia’s economy as in freefall. CSIS research notes that Russian salaries rose 17.8% in nominal terms and 8.7% in real terms in 2024 compared to 2023, with disposable incomes up 6.1% in 2023 and 7.3% in 2024 — growth rates not seen in Russia in almost two decades (CSIS). Government budget projections still expect real salaries to rise, albeit at a decelerating pace: 7% in 2025, 5.7% in 2026 and 4.1% in 2027 — a marked slowdown from the 2024 peak but still roughly double the pre-invasion decade average (CSIS). This wage growth, driven substantially by wartime labor shortages and military-adjacent spending, is precisely the kind of headline-stabilizing data point that has allowed Putin to argue publicly that sanctions have failed to cripple his economy (Fortune) — even as think tanks describe the broader trajectory as pushing Russia toward what one report calls an “economic, political, and military abyss” (Fortune).
What Comes Next
Renewed legislative pressure in Washington — including the Sanctioning Russia Act introduced with strong bipartisan support — signals appetite in the US for tightening the screws further, even as the loss of a key congressional champion for that effort has complicated the political path forward (TIME). Whether the EU’s renewed sanctions regime, continued oil price pressure, and constrained reserves ultimately force a shift in Kremlin calculus toward negotiation remains the central open question for 2027.
Key Takeaways
- The EU has extended Russia sanctions for a further year, through 31 July 2027, continuing a regime built from 20 separate packages since 2022.
- Russia’s 2026 GDP growth is forecast between 0.4% and 1.0%, a sharp deceleration from 2023’s 4.1% post-shock rebound.
- Oil and gas revenue’s share of Russian state income has fallen from roughly half to about a quarter as Western sanctions target export earnings specifically.
- Russia has liquidated a large share of its gold reserves to sustain war financing amid a widening split between an overheating military sector and a stagnating civilian economy.
- Official Russian statistics likely understate the true economic strain, according to independent economists who cite a widening gap between reported and expected performance.
Sources: Council of the EU, Council of the EU Sanctions Timeline, Stockholm School of Economics/SITE, Forbes, Statistics of the World, CSIS, Fortune, TIME
Discover more from The Economy
Subscribe to get the latest posts sent to your email.

Singapore’s non-oil domestic exports rose 20.7% year-on-year in June 2026, driven by a 115.4% surge in integrated circuit shipments tied to AI demand, even as a separate and less-covered trade story unfolds next door: Malaysia-Indonesia bilateral trade is projected to grow 10% to US$29.3 billion in 2026, powered by expanding halal-sector cooperation.
The story most coverage is missing
Regional business press has extensively covered Singapore’s semiconductor export boom. What’s had far less coverage is the parallel, non-tech growth engine developing in the halal trade corridor between Malaysia and Indonesia — a structural, policy-driven trade relationship that is scaling steadily even as the AI trade headlines dominate attention.
Singapore: the AI supply chain’s export barometer
Singapore’s June non-oil domestic exports climbed 20.7% year-on-year, with integrated circuit exports jumping 115.4% and disk media products and personal computers rising 170.9% and 95.8% respectively — a direct read on how deeply the AI infrastructure buildout is flowing through the city-state’s electronics trade (VietnamPlus/VNA). Non-electronic exports told a different story, falling 2.9% in June after a 17.7% rise in May, mainly on weaker shipments of non-monetary gold, petrochemicals and food preparations — evidence the export strength is narrowly concentrated in the AI-linked segment rather than broad-based.
Singapore’s economic gravitational pull on its neighbours is intensifying too: a joint study by the Singapore Business Federation, Restaurant Association of Singapore and Singapore Retailers Association found Singaporean consumers are projected to spend an additional S$1.05 billion (roughly US$810 million) annually in Johor Bahru, just across the Malaysian border — a cross-border consumption pattern that is becoming a meaningful line item in regional retail planning (VietnamPlus/VNA).
The halal corridor: a steadier, policy-built growth story
While AI exports grab headlines, Malaysia’s bilateral trade with Indonesia is forecast to grow 10% to US$29.3 billion in 2026, according to Malaysia’s Chargé d’Affaires in Jakarta, Farzamie Sarkawi — up from US$26.61 billion in 2025, itself a 5.3% increase on the year before (BusinessToday Malaysia).
The driver is structural rather than cyclical: a halal Memorandum of Cooperation signed by the two countries in 2023 established mutual recognition of halal certification, easing product movement and market access across sectors. Sarkawi described the arrangement as delivering “positive progress” through knowledge exchange, training and improved market access for businesses in both countries (BusinessToday Malaysia). The ambition extends beyond the bilateral relationship: intra-D-8 trade — spanning the eight-nation Developing 8 bloc of Muslim-majority economies — currently runs between US$150 billion and US$160 billion annually, with a stated target of US$500 billion by 2030.
The macro backdrop: a region growing, unevenly
The Asian Development Bank’s July 2026 outlook shows Indonesia’s growth forecast holding steady at 5.2% for both 2026 and 2027, while Malaysia’s outlook is unchanged at 4.6% for 2026 and 4.5% for 2027 (ADB). Regional growth leadership, per McKinsey’s Q1 2026 review, sits with Indonesia, Singapore and Vietnam, while the Philippines lagged as domestic challenges weighed on activity (McKinsey).
Indonesia’s investment story has particular momentum: foreign direct investment grew for a second consecutive quarter, rising 8.1% to 249.9 trillion rupiah (roughly US$14.5 billion) in the first quarter of 2026, with Singapore remaining Indonesia’s largest single foreign investor at US$4.6 billion, ahead of China, Japan, Hong Kong and the United States (McKinsey). Realised investment for full-year 2025 reached a record Rp1,931.2 trillion (about US$120.7 billion), exceeding the government’s own target, driven by downstream industrial projects outside Java (BERNAMA).
Indonesia’s central bank has flagged currency management as an active watch item, signalling readiness to step up both onshore and offshore FX intervention to curb rupiah weakness and keep inflation within its 2026-2027 target band (McKinsey). Foreign investment in Indonesian government bonds has nonetheless rebounded, with net inflows of 17.7 trillion rupiah following outflows in the first quarter, alongside cumulative foreign holdings of 174 trillion rupiah in Bank Indonesia Rupiah Securities (BERNAMA).
Institutional context: Singapore’s coming ASEAN chairmanship
Adding a governance dimension to the economic picture, Singapore is set to take over the ASEAN chairmanship from the Philippines in 2027, with Prime Minister Lawrence Wong pledging a smooth transition — a leadership handover that will shape how the bloc coordinates trade and investment policy, including the halal-corridor and semiconductor-trade dynamics described above, through the second half of the decade (BERNAMA).
The bottom line
Southeast Asia’s 2026 growth story is not a single narrative but two distinct, converging tracks: a high-velocity, AI-linked export boom concentrated in Singapore’s electronics trade, and a steadier, policy-engineered halal-sector trade corridor between Malaysia and Indonesia that is quietly scaling toward a $500 billion bloc-wide target by 2030. Investors and policymakers tracking only the semiconductor headlines risk missing the second, structurally more durable growth engine sitting right alongside it.
Discover more from The Economy
Subscribe to get the latest posts sent to your email.

US Forced-Labour Tariffs on 60 Countries: The Hidden Trade Shock of 2026

Global Central Banks 2026: Fed, BoE and BoJ Decisions Could Reshape Markets

Gulf Capital Retreat From Pakistan 2026: UAE Loan Freeze & What It Means

Pakistan’s Most Reliable Export Is Its People: Remittances Hit $41.6 Billion, Overtaking Total Exports

Indonesia’s Confidence Problem: Record Investment, a Sinking Rupiah, and a Widening Credibility Gap

Down But Not Out: Inside the Slow Sinking of Russia’s War Economy

China’s Growth Slips to a Four-Year Low: Why Beijing Still Won’t Pull the Stimulus Trigger

The Johor-Singapore Corridor: How Malaysia Became Southeast Asia’s AI Infrastructure Powerhouse

Canada’s Economy ‘On Pause’: Inside the CUSMA Deadline That Passed Without a Deal

Dubai’s Millionaire Magnet: How the UAE Turned Middle East Turmoil Into a Capital Safe-Haven Boom

Britain’s Sixth Prime Minister in a Decade: What Starmer’s Exit Means for Gilts, Sterling and Your Portfolio

Anthropic Offers Up to $600,000 Salary for Critical IPO Role as AI Giant Prepares for Wall Street Debut

EU Readies Crisis Team for Potential China Rare Earths Stand-Off as Supply Chain Risks Mount

Singapore Weighs Hedge Fund Tax Cuts to Counter Hong Kong’s Growing Financial Challenge

Carry Trade Unwind 2026: How the Yen’s Snapback Triggered a Global Margin Call

AI Bubble Warning 2026: Why BIS, IMF and Bank of England Fear a Market Crash

BRICS De‑Dollarization Strategy Takes Shape with $15 Billion Local‑Currency Push

The AI Super Bubble Is Ready to Burst

Russia Bans Diesel Exports 2026: Global Fuel Market Impact Explained

Strait of Hormuz Blockade 2026: Oil Prices Surge 9% as US-Iran Conflict Reignites

Private Credit Warning: Most BDCs Turn Unprofitable in 2026, Reuters Finds

IMF Cuts Pakistan Growth Forecast, Raises Inflation to 8.4%

Bitcoin $150k Milestone Achieved as US Sovereign Crypto Pivot Looms
Gulf Capital Retreat From Pakistan 2026: UAE Loan Freeze & What It Means

India Economic Rise 2026: How the Subcontinent Toppled Japan

Strait of Hormuz 2026: Why Markets Still Don’t Trust It’s Open

Argentina Economy 2026: Milei’s Fiscal Surplus, Inflation Drop to 29%, and What Comes Next

China Housing Market Turnaround: White‑List Model Stabilises Prices
-

 Markets & Finance7 months ago
Top 15 Stocks for Investment in 2026 in PSX: Your Complete Guide to Pakistan’s Best Investment Opportunities
-

 Analysis5 months ago
Johor’s Investment Boom: The Hidden Costs Behind Malaysia’s Most Ambitious Economic Surge
-

 Analysis5 months ago
Top 10 Stocks for Investment in PSX for Quick Returns in 2026
-

 Analysis6 months ago
Brazil’s Rare Earth Race: US, EU, and China Compete for Critical Minerals as Tensions Rise
-

 Banks6 months ago
Best Investments in Pakistan 2026: Top 10 Low-Price Shares and Long-Term Picks for the PSX
-

 Investment7 months ago
Top 10 Mutual Fund Managers in Pakistan for Investment in 2026: A Comprehensive Guide for Optimal Returns
-

 Global Economy7 months ago
15 Most Lucrative Sectors for Investment in Pakistan: A 2025 Data-Driven Analysis
-

 Global Economy7 months ago
Pakistan’s Export Goldmine: 10 Game-Changing Markets Where Pakistani Businesses Are Winning Big in 2025