
Analysis
Top 10 Economic Models for Developing Nations to Adopt and Succeed as the Biggest Economy
The $100 Trillion Question: Who Will Own the Next Era of Global Economic Power?
The numbers are no longer a forecast—they are a verdict. According to the IMF’s World Economic Outlook (April 2025), emerging and developing economies now account for approximately 59% of global GDP measured in purchasing-power-parity terms, a tectonic shift from 44% in 2000. Yet the spoils of this growth remain grotesquely uneven. A handful of nations are sprinting toward genuine economic superpower status, while dozens of others remain mired in the structural traps—commodity dependence, institutional fragility, capital flight, and the middle-income ceiling—that have historically foreclosed their ambitions.
The question facing every finance minister, central banker, and development economist today is brutally direct: which blueprint do you choose? History has proven there is no universal panacea. The Washington Consensus—that rigid cocktail of privatization, deregulation, and fiscal austerity—generated growth in some contexts and catastrophe in others. The state-led developmental model of East Asia created economic miracles but also sovereign debt crises. Green industrialization looks compelling on paper until grid reliability becomes a crisis.
What follows is a rigorous, data-driven examination of the ten most powerful economic development models available to policymakers today. Each is assessed through the lens of real-world implementation, empirical outcomes, geopolitical viability, and long-run sustainability. The conclusion, reinforced by the evidence, is unambiguous: the nations that will ascend to the apex of the global economy in the 21st century will not be those that followed a single doctrine—they will be those that mastered the art of intelligent hybridization.
| 📊 Key Insight: Nations that reached upper-middle income status fastest between 2000–2024 averaged 3.2 more institutional reforms per decade than their peers, per World Bank Governance Indicators data. |
| MODEL 01 OF 10 · CORE FRAMEWORK: INDUSTRIAL POLICY & EXPORT-LED GROWTH |
1. The East Asian Export-Industrialization Engine: Manufacturing Supremacy Through Deliberate State Choreography
Core Thesis
No development model has generated wealth faster, at greater scale, or more reproducibly than export-led industrialization. The fundamental logic is elegant: rather than producing exclusively for a small domestic market constrained by low incomes, a nation leverages its comparative advantages—abundant labour, strategic location, undervalued currency—to integrate into global value chains and capture foreign demand. The state does not merely step aside; it actively choreographs industrial champions, negotiates market access, directs credit, and manages the exchange rate with surgical precision. The emerging market economic strategy here is not laissez-faire—it is disciplined mercantilism in a globalized wrapper.
Real-World Exemplar: South Korea & Vietnam
South Korea’s trajectory from a per-capita GDP of roughly $1,200 in 1965 to over $33,000 today is one of the most studied developmental arcs in modern economics. The World Bank’s Korea Development Overview documents how successive Five-Year Plans coordinated between the state and the chaebol conglomerates—Samsung, Hyundai, LG—compressed industrial transitions that took Europe and America a century into three decades. Vietnam has since replicated this playbook in miniature: World Bank Vietnam data shows exports grew from 46% of GDP in 2000 to over 93% in 2023, propelling manufacturing-led growth averaging 6.4% annually.
The Evidence
| Dimension | Detail | Key Metric |
| Model | Export-Led Industrialization | East Asian Development State |
| Case Country | Vietnam (2000–2023) | South Korea (1965–1995) |
| GDP Growth CAGR | ~6.4% annually | ~8.1% annually |
| Poverty Reduction | 72% → 4.8% headcount | 80%+ → sub-5% headcount |
| Export / GDP Ratio | 93% (2023) | Grew from 3% to 40% |
| Key Enabler | FDI + SEZs + Education | State-directed credit + POSCO |
| Source | World Bank Open Data | IMF Working Papers |
| MODEL 02 OF 10 · CORE FRAMEWORK: LEAPFROG ECONOMICS & DIGITAL-FIRST DEVELOPMENT |
2. Leapfrog Economics: How Digital Infrastructure Lets Developing Nations Skip Entire Industrial Eras
Core Thesis
Leapfrog economics posits that developing nations are not condemned to recapitulate every stage of industrial evolution that wealthy nations traversed. A country need not build copper telephone networks if it can deploy LTE and 5G directly. It need not construct coal-fired baseline power if solar microgrids can deliver electricity to rural households at lower levelized cost. The strategic implication is transformative: rather than playing catch-up, a nation can arrive at the technological frontier first, unburdened by legacy infrastructure or incumbent lobbying. This is arguably the most exciting—and underutilized—sustainable growth model for developing nations in the current decade.
Real-World Exemplar: Rwanda & Kenya
Rwanda’s Vision 2050 explicitly deploys leapfrog theory as national strategy. The IMF Rwanda Article IV Consultation (2024) notes that ICT now contributes approximately 3.5% of GDP and growing, while mobile money penetration exceeds 40% of adults—bypassing the need for traditional bank branch networks. Kenya’s M-Pesa story is perhaps the paradigmatic leapfrog case: over 65% of Kenya’s GDP flows through the platform annually, according to GSMA Intelligence data, creating financial inclusion at a velocity no conventional banking expansion could have achieved.
| Dimension | Detail | Key Metric |
| Dimension | Detail | Key Metric |
| Model | Leapfrog / Digital-First | Mobile-led financial inclusion |
| Case Country | Kenya / Rwanda | 2010–2024 |
| GDP Impact (Digital ICT) | +3.5% of GDP (Rwanda) | McKinsey: +$300B SSA potential |
| Mobile Money Penetration | 65%+ GDP via M-Pesa (Kenya) | GSMA 2024 |
| Cost vs. Traditional Banks | 60–80% cheaper delivery | CGAP / World Bank 2023 |
| Source | IMF, McKinsey Global Institute | GSMA Intelligence |
| MODEL 03 OF 10 · CORE FRAMEWORK: NATURAL RESOURCE SOVEREIGN WEALTH CONVERSION |
3. The Resource Curse Antidote: Sovereign Wealth Fund Architecture and the Norwegian / Gulf Pivot
Core Thesis
For resource-rich developing nations, the greatest economic threat is not scarcity but abundance. The ‘resource curse’—the paradox whereby commodity wealth correlates with slower growth, weaker institutions, and greater inequality—is empirically documented across dozens of cases, from Nigeria to Venezuela. The corrective model is institutional: create a sovereign wealth fund that sequesters commodity revenues, insulates the domestic economy from Dutch Disease currency appreciation, and invests proceeds in diversified global assets that generate perpetual returns after the resource is exhausted. The BRICS economic trajectory increasingly incorporates this framework as member states seek to convert finite natural capital into enduring financial capital.
Real-World Exemplar: Norway & Botswana
Norway’s Government Pension Fund Global—managed by Norges Bank Investment Management—surpassed $1.7 trillion in assets under management in 2024, equivalent to approximately $325,000 per Norwegian citizen. The Norges Bank Investment Management Annual Report 2024 shows that the fund’s equity portfolio alone generated a 16.1% return in 2023. Botswana offers the developing-nation proof-of-concept: the Pula Fund, established in 1994, channeled diamond revenues into diversified reserves, enabling counter-cyclical fiscal policy and maintaining investment-grade credit ratings across commodity cycles—a rare achievement in Sub-Saharan Africa, per IMF Botswana Article IV 2024.
| Dimension | Detail | Key Metric |
| Dimension | Detail | Key Metric |
| Fund | Norway GPFG | Botswana Pula Fund |
| AUM (2024) | $1.7 trillion | ~$5.5 billion |
| Per-Capita Value | ~$325,000 / citizen | ~$2,200 / citizen |
| 2023 Return | 16.1% | Diversified portfolio return |
| Credit Rating Preserved? | AAA | Investment Grade |
| Source | NBIM Annual Report 2024 | IMF, Bank of Botswana |
| MODEL 04 OF 10 · CORE FRAMEWORK: SERVICES-LED GROWTH & KNOWLEDGE ECONOMY |
4. The Services Leapfrog: From Agricultural Subsistence to a Knowledge Economy Without a Manufacturing Middle
Core Thesis
India’s development trajectory has confounded classical economists who assumed manufacturing must precede services. India essentially skipped the textile-and-steel phase that defined British and American industrialization, catapulting directly into high-value software, business process outsourcing, and—most recently—global capability centres and AI engineering hubs. Services-led growth is now a credible emerging market economic strategy precisely because digital services are tradeable at scale, require relatively modest physical capital investment, and can generate high-wage employment disproportionately concentrated among educated urban populations.
Real-World Exemplar: India & the Philippines
India’s technology and services exports surpassed $290 billion in fiscal year 2023-24, according to NASSCOM Strategic Review 2024. The IMF’s India Article IV Consultation 2024 projects India as the world’s third-largest economy by 2027, propelled heavily by services sector productivity growth averaging 8.2% annually over the preceding decade. The Philippines, meanwhile, demonstrates that BPO-led services growth can generate 1.3 million high-skill jobs and $38 billion in annual remittances-equivalent service receipts.
| Dimension | Detail | Key Metric |
| Dimension | Detail | Key Metric |
| Model | Services & Knowledge Economy | India / Philippines 2000–2024 |
| Tech/Services Exports | $290B+ (India FY24) | NASSCOM 2024 |
| Services GDP Share | ~55% of India’s GDP | World Bank 2024 |
| Wage Premium | IT jobs: 4–8× median wage | ILO Labour Statistics |
| Projected GDP Rank | #3 globally by 2027 | IMF WEO April 2025 |
| Source | IMF, NASSCOM, Goldman Sachs | Global Investment Research 2024 |
| MODEL 05 OF 10 · CORE FRAMEWORK: GREEN INDUSTRIALIZATION & CLIMATE ECONOMY |
5. Green Industrialization: Turning the Climate Crisis Into the Greatest Development Opportunity of the 21st Century
Core Thesis
For nations that have not yet built their energy infrastructure, the climate crisis is not merely a threat—it is a once-in-a-century development opportunity. The economics of renewable energy have undergone a structural transformation since 2015 that is nothing short of revolutionary: the levelized cost of solar PV has declined approximately 90% over the past decade, according to the International Renewable Energy Agency (IRENA). Nations that build their industrial base on cheap, abundant renewable energy will enjoy structural competitive advantages in energy-intensive manufacturing for generations. Moreover, the emerging global carbon border adjustment mechanism—particularly the EU’s CBAM—effectively penalizes high-carbon production, creating a first-mover advantage for nations that industrialize green from the outset.
Real-World Exemplar: Morocco & Chile
Morocco’s Noor Ouarzazate complex—at 580MW one of the world’s largest concentrated solar power installations—is the cornerstone of an industrial strategy that targets 52% renewable electricity by 2030, per IRENA’s Africa Renewable Energy Outlook 2023. Morocco now exports clean electricity to Europe via sub-sea cable and is positioning itself as a green hydrogen exporter—a market the IEA Global Hydrogen Review 2024 values at potentially $200 billion annually by 2030. Chile, with the Atacama Desert’s irradiation levels producing solar electricity at under $20/MWh, has become a natural laboratory for green copper smelting—critical for the EV supply chain.
| Dimension | Detail | Key Metric |
| Dimension | Detail | Key Metric |
| Model | Green Industrialization | Morocco / Chile 2015–2030 |
| Solar Cost Decline | ~90% since 2015 | IRENA 2024 |
| Morocco Renewable Target | 52% by 2030 | Ministry of Energy Morocco |
| Green H₂ Market Value | $200B/yr by 2030 (potential) | IEA Hydrogen Review 2024 |
| Chile Solar LCOE | <$20/MWh (Atacama) | BNEF Clean Energy Index |
| EU CBAM Impact | 15–35% tariff on high-carbon goods | European Commission 2024 |
| Source | IRENA, IEA, BNEF | European Commission |
| MODEL 06 OF 10 · CORE FRAMEWORK: SPECIAL ECONOMIC ZONES & INSTITUTIONAL EXPERIMENTATION |
6. Special Economic Zones as Laboratories of Capitalism: China’s SEZ Blueprint for the Developing World
Core Thesis
One of the most powerful tools in the developmental state’s arsenal is the Special Economic Zone—a geographically bounded area where a nation effectively runs a different, more market-friendly regulatory regime than the broader domestic economy. SEZs allow governments to attract FDI, build export capacity, and test institutional reforms without requiring political consensus for nationwide liberalization. The evidence base is extensive. The World Bank’s 2024 report on SEZs globally documented over 5,400 active zones across 147 countries, generating combined exports exceeding $3.5 trillion annually.
Real-World Exemplar: China’s Shenzhen & Rwanda’s Kigali SEZ
Shenzhen’s transformation from a fishing village of 30,000 people in 1979 to a metropolitan economy of 13 million generating GDP equivalent to a mid-sized European nation within a single generation is the most dramatic example of deliberate institutional engineering in modern history. The Brookings Institution’s analysis of China’s SEZ model attributes Shenzhen’s success to the unique combination of preferential tax regimes, streamlined customs, and—critically—de facto property rights protections that did not exist in the rest of China at the time. Rwanda’s Kigali SEZ, while embryonic by comparison, has attracted 30+ international firms since 2011 and is deliberately modelled on Singapore’s Jurong Industrial Estate.
| Dimension | Detail | Key Metric |
| Dimension | Detail | Key Metric |
| Model | Special Economic Zones (SEZs) | China / Rwanda |
| Global SEZ Count | 5,400+ active zones | World Bank 2024 |
| Global SEZ Exports | $3.5 trillion annually | World Bank SEZ Report 2024 |
| Shenzhen GDP Growth | From $0.3B (1980) to $490B+ (2023) | CEIC / China NBS |
| Kigali SEZ Investment | 30+ multinationals attracted | Rwanda Development Board |
| Source | World Bank, Brookings | CEIC, Rwanda Dev. Board |
| MODEL 07 OF 10 · CORE FRAMEWORK: HUMAN CAPITAL & TALENT-LED GROWTH STRATEGY |
7. The Singapore Theorem: Why Human Capital Investment Is the Highest-Return Asset Class in Development Economics
Core Thesis
Lee Kuan Yew famously observed that Singapore’s only natural resource is its people. The meticulous, systematic cultivation of human capital—through elite technical education, continuous workforce retraining, immigration of specialized talent, and ruthless meritocracy in public sector staffing—transformed a malarial swamp into the world’s fourth-largest financial centre by assets under management. The Singapore theorem posits that in the knowledge economy, human capital is not just one factor of production among many—it is the meta-factor that determines how productively all other factors are deployed. For developing nations, this model is simultaneously the most difficult (requiring generational investment and institutional patience) and the most durable.
Real-World Exemplar: Singapore & Estonia
Singapore’s investment in education consistently ranks among the highest globally as a share of government spending. The result: Singapore’s students rank #1 globally in mathematics and science on OECD PISA 2022 assessments, a pipeline that feeds directly into a workforce commanding the highest median wages in Asia. Estonia—a nation of 1.3 million—built a digital governance infrastructure (e-Estonia) so sophisticated that 99% of government services are accessible online, reducing bureaucratic friction costs by an estimated 2% of GDP annually, per McKinsey Global Institute’s Digital Estonia case study.
| Dimension | Detail | Key Metric |
| Dimension | Detail | Key Metric |
| Model | Human Capital Investment | Singapore / Estonia |
| PISA Math Rank | Singapore: #1 globally | OECD PISA 2022 |
| e-Estonia Savings | ~2% of GDP/year | McKinsey Digital Govt. Review |
| Singapore Median Wage | Highest in Asia | MOM Singapore Statistics 2024 |
| Education ROI | +8–13% wages per year schooling | World Bank HCI 2024 |
| Source | OECD, McKinsey, World Bank | Ministry of Manpower SG |
| MODEL 08 OF 10 · CORE FRAMEWORK: REGIONAL INTEGRATION & BLOC-LEVEL ECONOMICS |
8. The Bloc Multiplier: How Regional Economic Integration Transforms Small-Market Disadvantage Into Collective Scale
Core Thesis
A nation of 20 million people with a $15 billion GDP is, in isolation, a rounding error in global trade negotiations. A bloc of 15 such nations, integrated under a common external tariff and harmonized regulatory framework, becomes a $225 billion market—large enough to attract serious FDI, negotiate meaningful trade agreements, and support regional value chains that would be economically unviable for any member in isolation. The BRICS economic trajectory increasingly demonstrates this logic at the largest scale: the bloc now represents over 35% of global GDP on PPP terms, per IMF data, creating collective bargaining power in international financial architecture that no single member could wield alone.
Real-World Exemplar: ASEAN & the African Continental Free Trade Area
ASEAN’s evolution from a loose political forum into the world’s fifth-largest economy as a bloc—with combined GDP exceeding $3.6 trillion—illustrates the compounding benefits of integration. The ASEAN Secretariat Statistical Yearbook 2024 shows intra-ASEAN trade reaching $756 billion in 2023. The African Continental Free Trade Area (AfCFTA), fully operational since 2021, carries even more transformative potential: the World Bank AfCFTA Impact Assessment 2023 projects the agreement could lift 30 million Africans out of extreme poverty and boost intra-African trade by 81% by 2035—if implemented with fidelity.
| Dimension | Detail | Key Metric |
| Dimension | Detail | Key Metric |
| Model | Regional Integration / Bloc Economics | ASEAN / AfCFTA |
| ASEAN GDP (2023) | $3.6 trillion (combined) | ASEAN Secretariat 2024 |
| Intra-ASEAN Trade | $756 billion (2023) | ASEAN Stat Yearbook 2024 |
| AfCFTA Poverty Lift | 30 million by 2035 (projected) | World Bank 2023 |
| AfCFTA Trade Boost | +81% intra-African trade potential | World Bank AfCFTA Report |
| Source | ASEAN Secretariat, World Bank | IMF BRICS Monitor 2024 |
| MODEL 09 OF 10 · CORE FRAMEWORK: INSTITUTIONAL QUALITY & ANTI-CORRUPTION ARCHITECTURE |
9. The Invisible Infrastructure: How Institutional Quality and Anti-Corruption Reform Unlock Every Other Development Model
Core Thesis
Every other model on this list is rendered partially or wholly ineffective in the absence of one foundational precondition: institutions that are reliable, transparent, and resistant to elite capture. This is the uncomfortable truth that the Washington Consensus got right in diagnosis, if catastrophically wrong in prescription. The World Bank’s Worldwide Governance Indicators demonstrate a near-linear correlation between rule of law scores, control of corruption metrics, and long-run per-capita income growth. Nations that implement credible anti-corruption architecture—independent judiciaries, digitized procurement, beneficial ownership registries, whistleblower protections—attract more FDI per capita, service their debt at lower spreads, and compound their human capital investments more efficiently.
Real-World Exemplar: Georgia & Uruguay
Georgia’s radical anti-corruption reforms between 2004–2012—which included abolishing and reconstituting the entire traffic police force overnight, digitalizing the national property registry, and publishing every state contract online—generated a 30-point improvement in Transparency International’s Corruption Perceptions Index within eight years. The World Bank Doing Business evolution for Georgia saw the nation climb from 112th to 7th globally in ease of doing business in the same period. FDI as a share of GDP tripled. Uruguay’s independent anti-corruption framework and judicial independence scores—the highest in Latin America per World Justice Project Rule of Law Index 2024—have consistently attracted investment-grade credit ratings despite being a small, commodity-linked economy.
| Dimension | Detail | Key Metric |
| Dimension | Detail | Key Metric |
| Model | Institutional Reform / Anti-Corruption | Georgia / Uruguay |
| Georgia CPI Change | +30 points (2004–2012) | Transparency International |
| Georgia Doing Business Rank | 112th → 7th globally | World Bank Doing Business |
| FDI Impact | Tripled as % of GDP post-reform | UNCTAD World Investment Report |
| Uruguay Rule of Law | #1 in Latin America | World Justice Project 2024 |
| Source | Transparency International, WJP | World Bank WGI 2024 |
| MODEL 10 OF 10 · CORE FRAMEWORK: SOUTH-SOUTH COOPERATION & ALTERNATIVE CAPITAL ARCHITECTURE |
10. South-South Cooperation and the New Financial Architecture: Escaping the Dollar Trap and Western Conditionality
Core Thesis
The emerging consensus among development economists is that the post-Bretton Woods financial architecture—dominated by the IMF, World Bank, and Western capital markets—imposes conditionalities and carries structural biases that have, at minimum, complicated and at worst actively obstructed the development ambitions of nations in the Global South. The rapid expansion of South-South cooperation frameworks—China’s Belt and Road Initiative, the New Development Bank, the Asian Infrastructure Investment Bank, and bilateral currency swap arrangements—represents a genuine structural shift in the menu of available financing options for developing nations. The BRICS economic trajectory now includes serious discussion of a BRICS reserve currency, and the NDB’s paid-in capital base has reached $10 billion, per its 2024 Annual Report.
Real-World Exemplar: Ethiopia & Indonesia
Ethiopia’s industrial park strategy—financed substantially through Chinese development finance and the NDB—created 100,000+ manufacturing jobs in six years and generated $2.1 billion in export revenues from apparel and light manufacturing, per UNCTAD World Investment Report 2024. Indonesia has strategically leveraged South-South arrangements to negotiate better terms on nickel processing requirements, insisting that raw nickel ore—critical for EV batteries—be processed domestically rather than exported raw, a policy the IMF’s Indonesia Article IV 2024 estimates could add $30–40 billion annually to GDP once downstream battery manufacturing scales.
| Dimension | Detail | Key Metric |
| Dimension | Detail | Key Metric |
| Model | South-South Cooperation | Ethiopia / Indonesia |
| NDB Capital Base | $10 billion paid-in capital (2024) | NDB Annual Report 2024 |
| NDB Project Approvals | $33B+ since inception | New Development Bank |
| Ethiopia Manufacturing Jobs | 100,000+ in 6 years | UNCTAD WIR 2024 |
| Indonesia Nickel Downstream | +$30–40B GDP potential | IMF Indonesia Art. IV 2024 |
| Source | UNCTAD, IMF, NDB | New Development Bank 2024 |
Conclusion: The Hybrid Imperative — Why the Winner Will Be the Nation That Masters Intelligent Economic Pluralism
The nations that will ascend to genuine economic superpower status over the next three decades will not be those that selected one model from this list and executed it faithfully. History is unambiguous on this point. South Korea combined export-led industrialization (Model 1) with aggressive human capital investment (Model 7) and targeted SEZ experimentation (Model 6). China fused all of these with South-South financing architecture (Model 10) and leapfrog digital infrastructure (Model 2). Singapore is essentially Models 6 and 7 in a city-state laboratory. The most sophisticated development economists at the IMF, the Brookings Institution, and Harvard’s Growth Lab all converge on the same conclusion: sequencing and contextual calibration matter as much as model selection.
What distinguishes tomorrow’s economic giants is not which blueprint they borrowed, but whether they possessed the institutional quality (Model 9) to implement it, the regional scale (Model 8) to amplify it, and the sovereign flexibility—freed from commodity dependence (Model 3) and Western conditionality (Model 10)—to adapt it without foreign veto. The nations on the cusp of this achievement today—India, Vietnam, Indonesia, Ethiopia, Morocco, Kenya—share a common denominator: they have all, consciously or pragmatically, begun assembling hybrid frameworks drawing from multiple models simultaneously.
The Harvard Growth Lab’s Atlas of Economic Complexity 2024 ranks economic complexity—the diversity and sophistication of a nation’s productive capabilities—as the single strongest predictor of future income growth. Economic complexity is itself the quantitative fingerprint of successful hybridization. The highest-complexity developing economies are precisely those that have refused to accept any single model’s constraints and instead built diversified productive ecosystems capable of competing across multiple global value chains simultaneously.
| 📊 Final Verdict: There is no single road to economic supremacy. But there is a consistent pattern among nations that travel it fastest: they think in systems, invest in people, protect institutions, and borrow selectively from every model that fits their unique endowments. The most dangerous development strategy is ideological purity. |
Frequently Asked Questions (FAQ Schema)
| What is the fastest-growing economic model for developing countries in 2025? Based on current IMF, World Bank, and McKinsey data, the services-led knowledge economy model (exemplified by India) and leapfrog digital development (exemplified by Kenya and Rwanda) are generating the fastest convergence toward high-income status in 2025. However, the highest sustained growth rates are recorded by nations combining export industrialization with deliberate human capital investment—Vietnam and Bangladesh are the most proximate examples in the current cycle. |
| Can developing nations realistically become the world’s biggest economy? Yes—and according to the IMF’s April 2025 World Economic Outlook, this is already occurring on a PPP-adjusted basis. India is projected to become the world’s third-largest nominal GDP economy by 2027. On a purchasing-power-parity basis, China already surpassed the United States in 2016. The structural fundamentals—demographic dividends, urbanization, technology diffusion, and institutional reform momentum—favour several developing nations ascending to the top tier of global economic power within 25 years. |
| What is leapfrog economics and how does it work for developing nations? Leapfrog economics is the theory that developing nations can bypass intermediate stages of technological and infrastructure development by adopting the latest generation of technology directly—skipping, for example, copper telephone networks in favour of immediate 5G deployment, or coal power grids in favour of solar microgrids. Kenya’s M-Pesa mobile money platform—which extended financial services to 40+ million people without a traditional bank branch network—is the paradigmatic global example. The economic benefit is both cost efficiency (newer technology is often cheaper than legacy systems) and speed of deployment. |
| What role does the BRICS economic trajectory play in developing nation growth? BRICS and its expanded BRICS+ grouping (now including Egypt, Ethiopia, UAE, Iran, and Saudi Arabia) plays an increasingly critical role in three distinct ways: first, as an alternative source of development finance through the New Development Bank ($33B+ in approvals) that carries lower conditionality than IMF/World Bank programmes; second, as a collective bargaining forum that amplifies developing-nation voices in IMF quota negotiations and WTO dispute resolution; and third, as an emerging architecture for de-dollarized trade settlement, which—if implemented at scale—would reduce developing nations’ vulnerability to U.S. Federal Reserve policy decisions and dollar-denominated debt crises. |
References & Data Sources
IMF World Economic Outlook, April 2025
- World Bank Open Data Portal
- World Bank AfCFTA Impact Assessment 2023
- IRENA Renewable Energy Outlook Africa 2023
- IEA Global Hydrogen Review 2024
- NASSCOM Strategic Review 2024
- McKinsey Global Institute Digital Reports
- Brookings Institution SEZ Analysis
- GSMA Mobile Economy Report 2024
- Harvard Growth Lab Atlas of Economic Complexity 2024
- OECD PISA 2022 Results
- World Justice Project Rule of Law Index 2024
- New Development Bank Annual Report 2024
- UNCTAD World Investment Report 2024
- Transparency International Corruption Perceptions Index
- ASEAN Secretariat Statistical Yearbook 2024
- Norges Bank Investment Management Annual Report 2024
- Goldman Sachs Global Investment Research – India Outlook 2024
Discover more from The Economy
Subscribe to get the latest posts sent to your email.


Analysis
The Strait of Hormuz Gambit: France and Italy Court Tehran as $100 Oil Reshapes Europe’s Energy Calculus
As Iran’s new Supreme Leader Mojtaba Khamenei hardens his vow to keep the world’s most critical chokepoint sealed, Paris and Rome are quietly probing backdoor channels to Tehran — gambling that economic pragmatism can outlast ideological defiance.
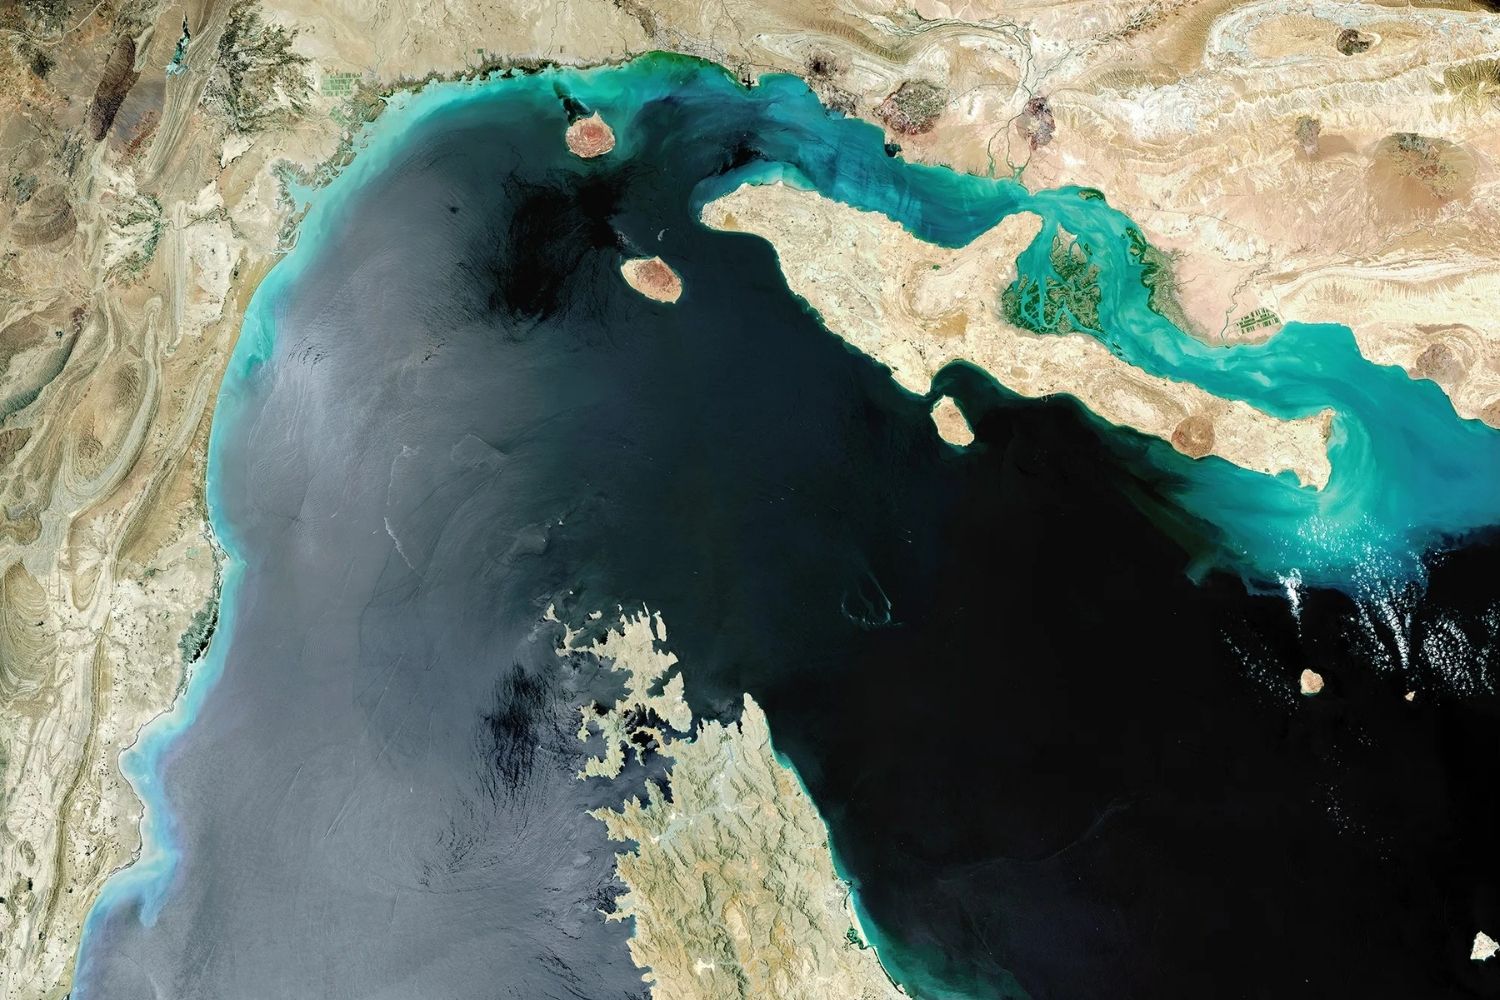
It begins, as most modern crises do, with a tanker. The MV Rozana, a Turkish-flagged bulk carrier, sat motionless in the Gulf of Oman for eleven days — impounded, warned off, then finally released — a floating symbol of the geopolitical paralysis that has descended on the most consequential 21 miles of ocean on earth. The Strait of Hormuz blockage 2026 has ceased to be a contingency scenario whispered about in insurance boardrooms. It is, as of this writing, an operative fact of the global economy — and its gravitational pull on European energy policy is becoming impossible to ignore.
Crude oil prices have now surged past $100 per barrel, a threshold that once triggered recessions and reshuffled governments. European natural gas prices have spiked 75 percent since January 1st, according to market data tracked by the International Energy Agency, straining household budgets from Lisbon to Warsaw and throwing a wrench into the European Central Bank’s already fragile inflation projections.
Against this backdrop, two of the eurozone’s largest economies have done something that would have been unthinkable twelve months ago: they have opened, cautiously and without fanfare, exploratory diplomatic talks with the Islamic Republic of Iran — not through formal channels, but through the kind of back-room conversations that rarely appear in official readouts. The stakes, for both sides, could not be higher.
A Closed Strait and a Continent Holding Its Breath
The decision by Iran’s new Supreme Leader, Mojtaba Khamenei, to maintain his predecessor’s posture of maximum pressure — and indeed to double down on it with a formal vow that the strait will remain closed to vessels deemed complicit with U.S.-Israeli operations — has effectively transformed the Hormuz crisis from a military standoff into a long-term structural shock. Roughly 20 percent of the world’s traded oil and a significant share of liquefied natural gas flows through the strait. Every additional week of closure compounds the damage.
The European energy crisis Iran has exposed the limits of the continent’s post-Ukraine diversification strategy. European buyers rerouted toward American LNG and Norwegian pipeline gas after 2022; those supplies are now strained, over-contracted, and insufficiently elastic to absorb the Gulf shock. Storage levels in Germany, France, and Italy — typically robust heading into spring — are running below their five-year seasonal averages.
For Italy in particular, the exposure is acute. Rome has over recent years cultivated significant energy trade relationships with Gulf producers, and the abrupt disruption of those flows has landed with particular force on industrial consumers in the Po Valley. Italy’s Defense Minister Guido Crosetto, a pragmatist by instinct and a straight-talker by reputation, has become an unexpectedly prominent voice in framing the terms of Europe’s dilemma.
| “We are not naive about who we are dealing with. But a closed Hormuz is not in anyone’s interest — including Iran’s. There are conversations worth having.” — Italy’s Defence Minister Guido Crosetto, in remarks to Italian broadcasters, March 2026 |
The French Equation: Macron’s ‘Defensive’ Pivot
French President Emmanuel Macron has been characteristically careful with his public framing. In a statement delivered following an Élysée briefing with senior defense and energy advisers, Macron described France’s posture in the region as strictly “defensive” — emphasizing the protection of commercial shipping and European crews rather than any offensive alignment with the U.S.-Israeli operation. He pointedly left the door open to France providing naval escorts to commercial vessels, “should conditions allow and tensions meaningfully ease.”
That conditional phrasing is doing considerable diplomatic work. Read one way, it signals to Tehran that Paris is not irrevocably committed to a militarized approach — that there remains a lane for negotiation. Read another way, it reassures domestic audiences and NATO allies that France has not abandoned solidarity with Western partners. This studied ambiguity is a Macron signature, and in the current context it functions as an invitation to talk.
Behind the scenes, according to sources familiar with the discussions who declined to be named given their sensitivity, French diplomatic envoys have made informal contact with Iranian interlocutors through third-country intermediaries — a channel that has historically run through Oman and, more recently, through Qatar. The substance of those contacts, if substantive at all, has not been disclosed. But their mere existence marks a significant departure from the EU’s public stance of solidarity with sanctions enforcement.
The EU Aspides Mission: Naval Shield or Diplomatic Liability?
The EU’s Operation Aspides, the naval protection mission currently deployed in the Red Sea, was designed to guard commercial shipping against Houthi drone and missile attacks — a mission whose mandate does not formally extend to the Persian Gulf. Its presence has, however, created a complicated optics problem for European capitals now seeking to signal non-belligerence toward Tehran.
Iran’s foreign ministry has repeatedly characterized Aspides as a de facto extension of the U.S.-Israeli operational posture — a charge European commanders categorically reject, pointing to Aspides’ defensive rules of engagement and its documented refusals to intercept Houthi assets targeting non-European vessels. The distinction may be legally sound and operationally meaningful, but it carries little weight in the information environment that shapes Tehran’s calculus.
For France and Italy, the challenge is to decouple their energy diplomacy from their security posture without appearing to fracture NATO or EU cohesion. Both governments have signaled, with varying degrees of subtlety, that they are willing to explore a functional separation: Aspides continues its mandated mission in the Red Sea, while separate bilateral diplomatic tracks pursue safe passage Iran talks focused on restoring civilian shipping through Hormuz under a temporary, negotiated framework.
What Would a ‘Safe Passage’ Framework Actually Look Like?
The theoretical architecture being discussed — according to three diplomatic sources and one senior EU official spoken to for this piece — would involve a time-limited, monitored arrangement under which designated commercial vessels carrying European cargo would be granted passage through the strait in exchange for a package of economic inducements to Iran. These could include the unfreezing of certain EU-held Iranian assets, partial suspension of specific financial sanctions, and a European commitment to formally distance itself from any expanded military operations in the Gulf theater.
The model draws, loosely, on historical precedents: the 1987-88 convoy arrangements during the first Tanker War, and more recently on the JCPOA’s phased confidence-building mechanisms. Whether Mojtaba Khamenei — whose authority is still consolidating and whose ideological positioning has been markedly harder than his father’s in recent months — would entertain such an arrangement is deeply uncertain.
Energy market analysts at Wood Mackenzie and S&P Global Commodity Insights are currently assigning a less than 30 percent probability to a meaningful Hormuz reopening within the next 90 days. That number is doing serious work in European government budget offices, where the fiscal cost of sustained high energy prices is now being modeled as a structural rather than transitory shock.
$100 Oil and the European Fiscal Reckoning
The economic arithmetic is brutal and familiar. The crude oil price surge Middle East has pushed headline inflation figures in the eurozone back above 4 percent after two years of painstaking disinflation — a development the ECB’s governing council will be forced to address at its next scheduled meeting. Rate cut expectations that were fully priced in for the second quarter of 2026 have now been effectively repriced out, dealing a secondary blow to heavily indebted sovereigns like Italy, which carries a debt-to-GDP ratio comfortably above 140 percent.
France is navigating its own version of fiscal constraint. The government’s 2026 budget, already the subject of a bruising parliamentary fight, was constructed on an oil-price assumption of $75 per barrel. Every $10 increment above that baseline translates into approximately €4 billion in additional subsidy and relief expenditure if Paris chooses to shield consumers — which, heading into a domestic political cycle, it almost certainly will.
The German economy, still digesting the structural trauma of the 2022 energy shock, is particularly exposed through its industrial sector. German industrial output data published by the Federal Statistics Office showed a renewed contraction in February — the third consecutive monthly decline — with energy-intensive manufacturers citing input cost volatility as the primary brake on investment decisions. The Hormuz crisis has, in other words, arrived at the worst possible moment for European economic momentum.
| “The strait is not merely a geographic fact. It is a lever. And right now, Tehran is the only hand on it.” — Senior EU energy security official, speaking on background, Brussels, March 2026 |
Tehran’s Leverage — and Its Limits
It would be a mistake to read Iran’s position as one of pure strategic strength. The Hormuz closure has inflicted significant self-harm on the Iranian economy, which depends on the strait not only for its own oil exports — currently illegal under sanctions but practically disrupted regardless — but for the import of essential goods including foodstuffs and industrial inputs. The humanitarian and economic pressure on the Iranian population, already considerable after years of sanctions, has intensified sharply.
Mojtaba Khamenei’s vow to keep the strait closed is as much a consolidation move as it is a strategic calculation — a signal to hardliners within the Islamic Revolutionary Guard Corps that the new supreme leadership will not repeat what they characterize as his predecessor’s willingness to make concessions under pressure. Walking back that vow, even partially, carries significant domestic political risk. Any framework that Europe proposes must therefore offer Tehran a face-saving mechanism — language that frames any reopening as a sovereign Iranian decision rather than a capitulation to foreign pressure.
That framing challenge is, arguably, where European diplomacy has its most distinctive comparative advantage. Unlike Washington, which is formally a party to the ongoing conflict, or Jerusalem, whose relationship with Tehran is structurally zero-sum, Paris and Rome can present themselves as neutral economic interlocutors — parties whose primary interest is the restoration of commercial normality rather than regime change or strategic containment. Whether Tehran finds that framing credible is another matter entirely.
The Broader Geopolitical Fault Lines
Washington’s Shadow
Any European diplomatic initiative toward Iran will need to navigate the weight of the transatlantic relationship. Washington has not publicly objected to European exploratory contacts with Tehran — partly because the Biden-era diplomatic architecture never entirely foreclosed dialogue tracks, and partly because the current administration has its own quiet interest in off-ramps that do not require a formal U.S. climbdown. But private communications from the State Department to European capitals have been notably pointed about the risks of being seen to undercut coordinated pressure.
The Gulf Arab Calculus
Saudi Arabia and the UAE — both of which have significant economic interests in the restoration of Hormuz traffic — are watching the European initiative with a mixture of hope and anxiety. Riyadh has its own backchannel to Tehran, normalized through the 2023 Chinese-brokered rapprochement, but that channel has gone cold since the current conflict escalated. A successful European mediation that restored Hormuz passage without addressing Iran’s regional posture more broadly would leave Gulf states in a structurally worse position — bearing the geopolitical cost without benefiting from the strategic reconfiguration.
China’s Quiet Role
Beijing, characteristically, is playing a longer game. China remains Iran’s largest oil customer and has the most direct economic interest in Hormuz reopening. Its influence over Tehran is real but not unlimited, and it has been notably reluctant to spend that influence in ways that benefit European or American interests without reciprocal concessions on Taiwan or South China Sea policy. The absence of Chinese pressure on Tehran has been, from a European perspective, one of the more frustrating strategic facts of the past three months.
The Road Ahead: Scenarios and Probabilities
Three broad scenarios are worth mapping. The first — a relatively rapid negotiated framework producing a partial Hormuz reopening within 60 days — remains possible but requires alignment between European economic incentives, Iranian domestic politics, and U.S. acquiescence that is difficult to engineer simultaneously. Energy market futures are not currently pricing this scenario.
The second scenario — a prolonged closure lasting through Q3 2026, with intermittent partial openings tied to tactical Iranian leverage plays — is where the balance of probability currently sits. In this scenario, European governments face sustained fiscal pressure, the ECB’s pivot is delayed further, and the diplomatic initiatives from Paris and Rome produce incremental but insufficient progress.
The third scenario — an escalation that extends the conflict into the broader Gulf theater, potentially drawing in additional regional actors and further disrupting global energy infrastructure — is the tail risk that keeps energy security planners awake. Its probability is low but non-negligible, and its consequences would dwarf the current disruption.
Conclusion: The Limits of Backdoor Diplomacy in an Age of Hard Constraints
France and Italy’s tentative courtship of Tehran is less a coherent diplomatic strategy than an improvised response to an energy emergency with no clean solutions. It reflects the structural vulnerability of European economies to Middle Eastern energy dynamics — a vulnerability that two decades of diversification initiatives have ameliorated but not eliminated. It also reflects a harder truth: that in a multipolar world where the United States has chosen active belligerence and China has chosen studied abstention, Europe’s window of diplomatic utility may be narrower than its ambitions.
The Strait of Hormuz blockage 2026 is, in the final analysis, a stress test of European strategic autonomy — not in the military sense that has dominated EU defence debates, but in the more fundamental sense: can European governments translate economic weight and diplomatic credibility into influence over a crisis they did not create and cannot unilaterally resolve? The answer, over the coming weeks, will carry consequences extending well beyond the energy balance sheets of Paris and Rome.
For international economists and strategic risk analysts, the key variable to watch is not the headline oil price — which is a lagging indicator of decisions already made — but the state of the Omani and Qatari intermediary channels. When those channels begin to produce substantive rather than exploratory dialogue, markets will know before governments announce it. And the shape of that dialogue will determine whether 2026 is remembered as the year Europe finally converted economic interdependence into geopolitical leverage, or the year it discovered, again, how far those two things can diverge.
KEY SOURCES & FURTHER READING
• Reuters: Oil Markets & Hormuz Closure Coverage (March 2026)
• Financial Times: Europe’s Backdoor Iran Talks (FT Energy Security)
• S&P Global Commodity Insights: Hormuz Risk Assessment Q1 2026
• Reuters: German Industrial Output Contraction, March 2026
Discover more from The Economy
Subscribe to get the latest posts sent to your email.
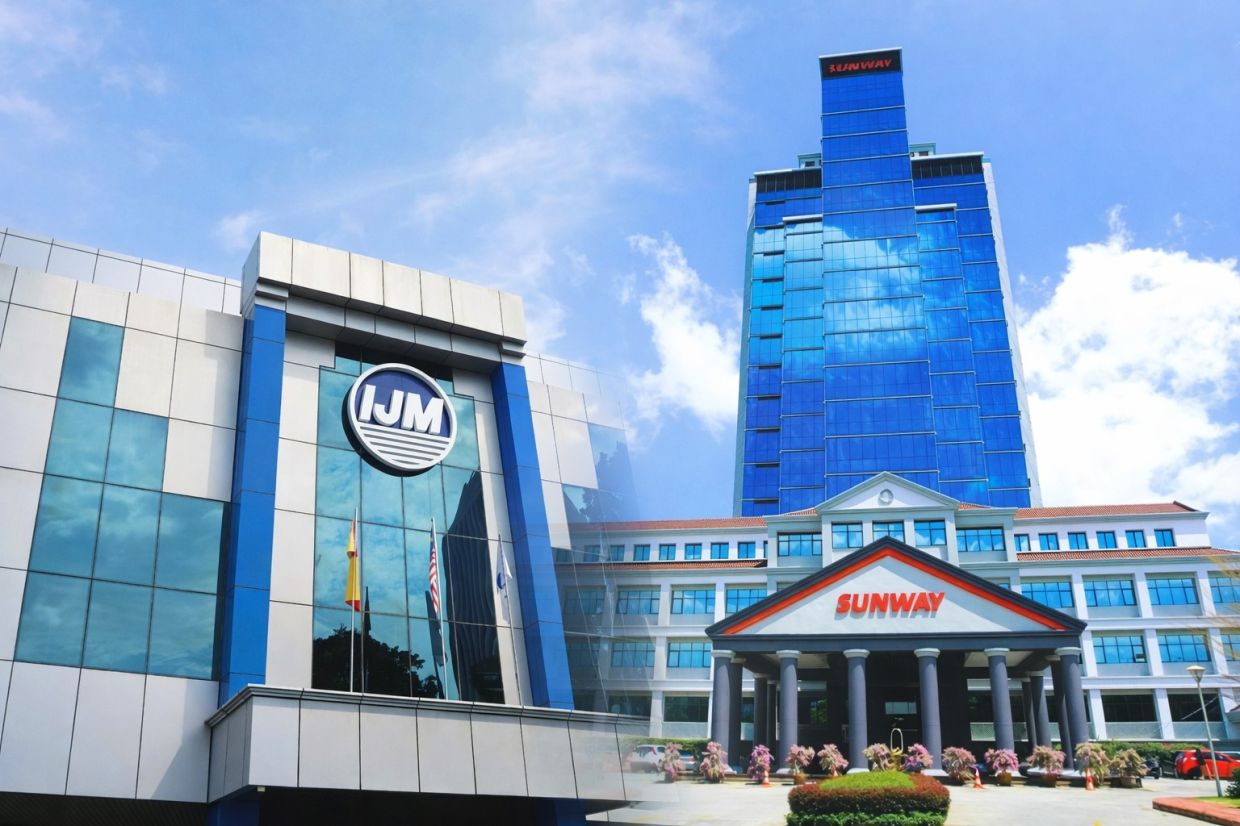
A unanimous board rejection, an independent valuation gap that beggars belief, and a political firestorm over Bumiputera rights. Malaysia’s biggest corporate drama of 2026 just reached its watershed moment.
Somewhere between the glass towers of Kuala Lumpur’s financial district and the legal filing rooms of Bursa Malaysia’s exchange, a RM11 billion gambit unravelled in slow motion on Friday. IJM Corporation Bhd’s board unanimously recommended that shareholders reject Sunway Bhd’s conditional voluntary takeover offer of RM3.15 per share, after appointed independent adviser M&A Securities declared the bid “not fair and not reasonable.” Free Malaysia Today The language was clinical. The implications were seismic.
M&A Securities found the offer price represents a discount of between RM2.69 and RM3.33 per share — roughly 46.1% to 51.4% below IJM’s estimated sum-of-parts value Scoop of between RM5.84 and RM6.48 per share. In plain English: Sunway’s opening bid, dressed up as a transformational merger, was asking IJM shareholders to surrender a blue-chip Malaysian conglomerate at roughly half its independently assessed worth. For a deal this size, that is not a negotiating discount. That is a devaluation.
The IJM Sunway takeover rejection now stands as one of the most decisive and well-reasoned rebuffs in Malaysian corporate history — a verdict that reverberates across ASEAN boardrooms, foreign investor portfolios, and the charged political terrain of Bumiputera economic policy.
How the RM11 Billion Bid Was Born — and Why It Was Always Controversial
The origins of this Malaysia construction takeover 2026 saga trace back to 12 January, when Sunway Bhd tabled a conditional voluntary offer to acquire all 3.51 billion outstanding shares in IJM Corp at RM3.15 per share — a total consideration of RM11.04 billion, structured as 10% cash (RM0.315 per share) and 90% via new Sunway shares valued at RM2.835 each, based on an issue price of RM5.65 per new Sunway share. BusinessToday
On paper, the rationale was compelling. A combined Sunway-IJM entity would create Malaysia’s largest integrated property-construction conglomerate, able to compete on a genuinely ASEAN scale at a moment when regional infrastructure spending is entering a multi-decade supercycle. Sunway’s founder and executive chairman, Tan Sri Jeffrey Cheah, framed the deal as a nation-building exercise — a champion ready to bid for mega-projects from Johor’s Forest City development to Indonesia’s new capital, Nusantara.
But the market read it differently. IJM’s shares tumbled as much as 16% on January 19, plunging to a three-month low of RM2.34, prompting Bursa Malaysia to suspend intra-day short-selling of the stock. Free Malaysia Today Investors were not celebrating a strategic premium. They were selling on the belief that the offer undervalued IJM and the political controversy surrounding the deal made its completion far from certain.
Within days, the controversy metastasised. UMNO Youth chief Datuk Dr Akmal Saleh publicly raised concerns that the takeover could dilute the equity interests of the Malaysian government and the rights of the country’s Bumiputera majority, while the Malay Businessmen and Industrialists Association also questioned the deal. Bloomberg For any corporate transaction in Malaysia, where affirmative-equity policies remain politically sensitive and government-linked investment companies (GLICs) serve as the pillars of the capital markets, this kind of political headwind is not incidental noise. It is structural resistance.
The 46–51% Discount: What ‘Not Fair and Not Reasonable’ Actually Means
The phrase “not fair and not reasonable” in Malaysian securities law has a precise, two-limbed meaning. An offer is not fair when the price does not reflect the target company’s intrinsic value; it is not reasonable when accepting shareholders would be worse off than simply remaining shareholders in the status quo. The Sunway RM11 billion IJM bid discount managed to fail both tests simultaneously — an analytical verdict rarely achieved at this magnitude of deal size.
M&A Securities’ circular filed with Bursa Malaysia found the RM3.15 per share offer represents a 46.1% discount to the estimated low value of IJM shares at RM5.84, and a 51.4% discount to the estimated high value of RM6.48. The Star The assessment uses a sum-of-parts valuation methodology — the standard approach for diversified conglomerates — which values each business division individually before aggregating. IJM’s sprawling portfolio spans toll roads, ports (including the strategic Kuantan Port), property development, construction, manufacturing, and plantation assets. Each line generates independently supportable cashflows. The IJM sum-of-parts valuation Sunway gap is not a rounding error. It is a canyon.
To contextualise just how extraordinary this discount is: comparable ASEAN construction and infrastructure mergers typically offer premiums of 15–30% to the pre-announcement share price, not discounts of nearly half. The implied value fell further to RM3.08 per share once Sunway’s two-sen interim dividend — announced on 25 February — was factored in, deepening the effective discount to 47.3% and 52.4% against the low and high valuation estimates respectively. The Star
Structurally, too, the deal’s composition amplified the unfairness argument. Nine-tenths of the consideration is paid not in cash but in newly issued Sunway shares — shares that M&A Securities assessed are already trading at premium multiples that embed substantial future growth expectations. Accepting those shares at that price, in exchange for IJM equity valued at a significant discount, is a double-compression trade that no disciplined institutional investor should accept without resistance.
What Minority Status in Sunway Would Really Cost IJM Shareholders
The control dimension of this story deserves sharper focus than it has received in the local financial press, and it is central to understanding why IJM shareholders should reject Sunway’s offer.
IJM shareholders who accept the offer would transition from being 100% equity holders in IJM — with full voting rights, direct asset exposure, and dividend control — to holding approximately a 20.6% minority stake in the combined Sunway entity. The Star That dilution is not merely numerical. It represents a qualitative transformation in shareholder rights.
As a minority stakeholder in Sunway, an IJM shareholder would have no meaningful ability to influence capital allocation, dividend policy, management decisions, or strategic direction. They would assume exposure to the integration risks of merging two large, culturally distinct conglomerates with different asset compositions. They would lose direct ownership of IJM’s strategic infrastructure — including four toll-road concessions and the Kuantan Port, which sits at the heart of Malaysia’s deepening trade relationship with China under the Belt and Road corridor.
M&A Securities made this point explicitly: as minority shareholders, accepting holders would assume significant integration, execution and transitional risks arising from the combination of two sizeable and diversified conglomerates with distinct operating models, asset compositions, and management cultures. The Star The advisory language, stripped of its legalese, is unambiguous: the deal trades known, direct ownership for uncertain, diluted exposure.
The Shadow Over the Deal: MACC, the UK Fraud Office, and Governance Questions
No analysis of the IJM board recommends reject Sunway takeover story is complete without confronting the extraordinary governance cloud that has hung over IJM throughout the bid process.
By March 4, Malaysia’s Anti-Corruption Commission had opened three separate investigation papers relating to IJM Corporation, including an inquiry into financial transactions and overseas investments worth approximately RM2.5 billion, a bribery case involving a project, and a probe into the Sunway share transaction itself. BERNAMA MACC chief commissioner Tan Sri Azam Baki confirmed active cooperation with the UK’s Serious Fraud Office in what he described as an ongoing, multi-jurisdictional investigation.
Critics including the Malay Chamber of Commerce warned that any takeover could undermine Bumiputera ownership in IJM, where government-linked investment companies currently control more than 50% of the shareholding. The Corporate Secret The Ministry of Finance subsequently confirmed that GLICs held a combined 45% equity interest in IJM as of 30 January 2026 — a figure that frames the deal not as a purely private-sector transaction but as a de facto restructuring of public savings.
For the foreign institutional investors who collectively form a significant slice of both companies’ free float, this combination of valuation uncertainty, regulatory investigation, and political sensitivity is precisely the kind of environment that prompts capital to step back and wait.
The Macro Lens: ASEAN Consolidation, Infrastructure Cycles, and Foreign Capital
The IJM-Sunway saga unfolds against a backdrop that gives it significance beyond two Malaysian companies. Southeast Asia is entering what the Asian Development Bank estimates will be a US$210 billion annual infrastructure investment cycle through the 2030s, driven by energy transition infrastructure, data centre buildouts, urbanisation, and post-pandemic industrial reshoring.
In this environment, the logic of creating regional construction champions has real merit. ASEAN property developers merger Malaysia dynamics are not illusory — consolidation that creates companies capable of competing for billion-dollar projects across Vietnam, Indonesia, the Philippines, and Bangladesh is strategically sound. The question has always been price, governance, and process — not direction.
What the IJM Sunway impasse reveals, however, is that Malaysia’s capital markets are not yet willing to accept large-scale ASEAN consolidation at valuations that disadvantage existing shareholders. The independent adviser’s verdict, the board’s unanimous alignment, and the institutional shareholder base’s likely disposition all point toward a rejection outcome that will reverberate beyond Malaysia’s borders. Foreign fund managers watching from Singapore, Hong Kong, and London will note that Malaysia’s regulatory and advisory infrastructure functioned as designed — providing substantive, independent analysis rather than rubber-stamping a politically connected deal.
That is a positive signal for the long-term credibility of Bursa Malaysia as an investable market. The short-term message, however, is more complicated: Malaysia’s largest infrastructure assets remain fragmented, and the path toward sector champions capable of competing regionally just got harder.
Jeffrey Cheah’s Exit Clause — and What Happens Next
Sunway founder Jeffrey Cheah, speaking to reporters on Friday, confirmed the group is prepared to walk away if IJM shareholders do not accept the offer by the April 6 deadline. “There’s no compulsion for the shareholders to sell to us,” Cheah said, adding simply: “We walk away.” Bloomberg
That equanimity — whether genuine or tactical — suggests Sunway understands the arithmetic. With the IJM board unanimously opposed, independent advice formally on record, GLICs holding a controlling block likely to follow the board’s recommendation, and an active MACC investigation casting a shadow, the conditions for a successful takeover have effectively evaporated. Sunway’s own share price trajectory will now be closely watched: a failed large acquisition attempt can, paradoxically, unlock value for the acquirer by removing the dilution risk embedded in the share issuance component of the offer.
The offer window remains open until 5pm on April 6, 2026. An EGM on March 26 will give shareholders a formal platform to voice their position. But the trajectory is clear. Unless Sunway revises its offer materially — and there is no indication it will — this Malaysia construction takeover 2026 will end in failure, becoming a case study in valuation discipline, governance complexity, and the limits of strategic vision unmatched by fair commercial terms.
The Columnist’s Verdict: A Justified Rejection, and a Missed Opportunity
The IJM board and its independent adviser have done exactly what they should do. The Sunway IJM offer not fair finding is not an ideological verdict; it is a financial one. A 46–51% discount to independently computed sum-of-parts value is not a negotiating position — it is an insult to shareholders who have held IJM through multiple economic cycles, infrastructure downturns, and pandemic-era uncertainty. Institutional investors who hold IJM on behalf of Malaysian pensioners and ordinary savers cannot, in good conscience, accept that exchange.
What makes this story genuinely important, however, is what it leaves unresolved. Malaysia’s construction sector fragmentation is a real competitive disadvantage. The country’s infrastructure ambitions — high-speed rail, the Johor-Singapore Special Economic Zone, renewable energy buildout — require contractors of regional scale and financial depth. The failure of this particular deal does not make the case for consolidation disappear. It makes the need for a better-structured, more fairly priced next attempt more urgent.
Sunway, for its part, remains a formidable operator — financially disciplined, well-governed, and with the operational depth to absorb a large acquisition. Jeffrey Cheah built one of Asia’s most respected property-construction empires over four decades. The vision to create a regional champion is not the problem. The price was.
When the right deal — at the right price, with the right governance protections, free of regulatory clouds — is eventually presented, Malaysia’s capital markets will be watching. For now, the answer from IJM’s board, its independent adviser, and, in all probability, its shareholders is unambiguous: not at RM3.15.
The offer for IJM shares remains open for acceptance until 5pm on 6 April 2026.
Further Reading
- Bursa Malaysia — IJM Corporation Bhd Filings
- Bloomberg: Sunway Willing to Walk Away If IJM Bid Rejected
- Bloomberg: Sunway’s IJM Bid Questioned Over Bumiputera Rights
- Nikkei Asia: Malaysia’s IJM Urges Shareholders to Reject Sunway Takeover Bid
- Bernama: Three Investigation Papers Opened Against IJM Corporation
- The Edge Malaysia: Sunway’s Offer for IJM Not Fair, Not Reasonable
Discover more from The Economy
Subscribe to get the latest posts sent to your email.
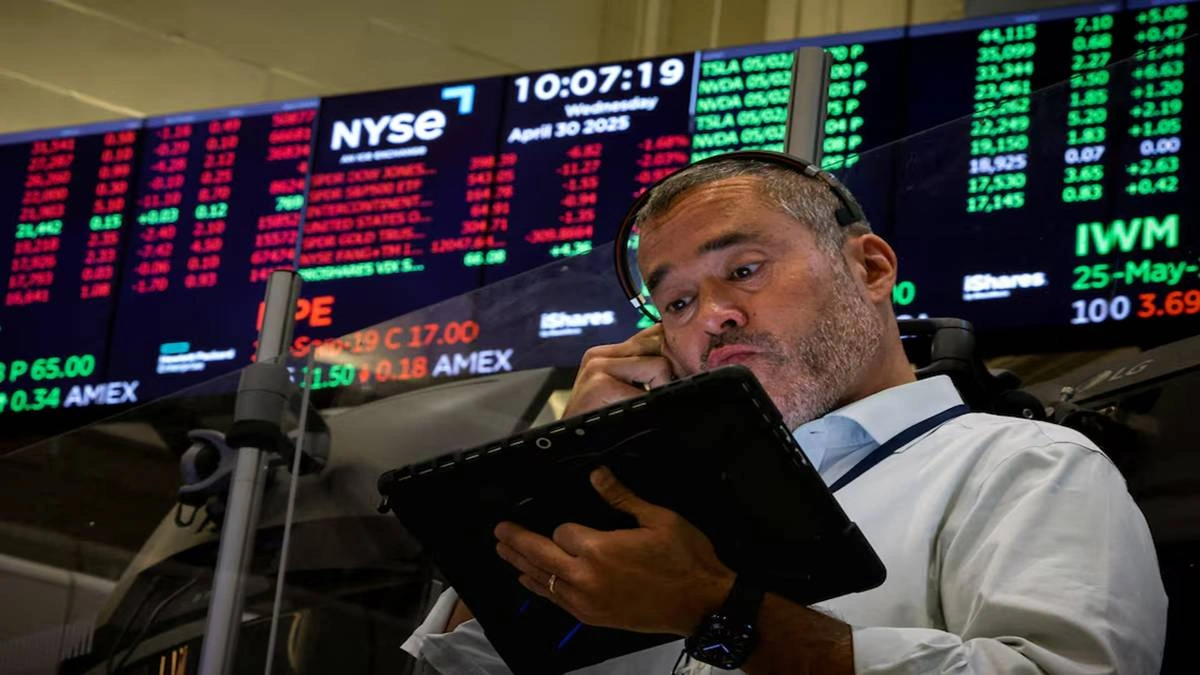
The Dubai Financial Market General Index closed at 5,518 points on Wednesday, March 12, shedding 3.64% — or 208 points — in a single session, extending a rout that has now erased gains accumulated across much of 2025. Over the past month, the Abu Dhabi benchmark has declined 9.41% TRADING ECONOMICS, while the DFM index has repeatedly tested the floor of a 5% daily circuit-breaker that both exchanges imposed at the start of the conflict. The selloff is no longer a panic reflex. It is a considered repricing of risk in a region that had spent four years selling itself as the world’s most stable emerging-market destination.
Dubai’s main share index fell 3.6% on Thursday, dragged down by a 4.9% decline in blue-chip developer Emaar Properties and an equivalent 4.9% drop in top lender Emirates NBD. ZAWYA In Abu Dhabi, the picture was no less grim. The Abu Dhabi index dropped 2.3%, with Aldar Properties losing 4% and Abu Dhabi Islamic Bank declining 5%. ZAWYA First Abu Dhabi Bank, the UAE’s largest lender, slid to within a hair of the daily maximum loss threshold, joining a growing roster of blue-chips that have collectively surrendered months of outperformance in less than a fortnight.
Why UAE Stocks Are Falling in March 2026: The Fear Calculus
To understand why Emaar Properties — a stock that reached a 21-year high in early February — is now on its third consecutive near-maximum decline, one must follow the logic of contagion rather than fundamentals. The company’s towers still stand. Dubai’s skyline has not changed. But the risk premium that investors attach to every square metre of luxury real estate in the Gulf has shifted seismically.
Emaar derives roughly one-fifth of its revenue from malls, hospitality and entertainment AGBI — divisions acutely sensitive to footfall, tourist confidence, and the continued willingness of the 11 million expatriates who fill Dubai’s towers and hotels to remain. A military spokesperson said on Wednesday that Iran would target US- and Israel-linked economic and banking interests in the region following an attack on an Iranian bank. ZAWYA For institutional investors already underweight the region, that statement provided all the permission needed to cut exposure further.
Citigroup and Standard Chartered told Dubai staff to work from home after beginning office evacuations CNBC, a symbolic moment that landed harder on investor psychology than any index print. When global banks physically withdraw staff from a financial centre, the message to equity allocators is unambiguous.
The infrastructure dimension is also concrete, not theoretical. A projectile struck a container ship 35 nautical miles north of Jebel Ali — one of the world’s busiest ports — causing a small fire, according to UK Maritime Trade Operations. Meanwhile, a drone fell onto a building near Dubai Creek Harbour. ZAWYA Jebel Ali handles roughly 80% of the UAE’s non-oil imports. A disruption there is not a geopolitical footnote; it is a direct assault on the logistics architecture of the emirate’s entire re-export economy.
Mojtaba Khamenei’s First Comments: Stock Market Reaction Explained
In a development that deepened investor anxiety, Iranian state media released the first public statement attributed to new Supreme Leader Ayatollah Mojtaba Khamenei, in which he vowed that Iran should keep leveraging its stranglehold on the Strait of Hormuz and continue attacks on targets in Gulf Arab nations. CBS News The statement arrived as markets were already digesting a week of escalatory signals. Its significance lies not just in content but in authorship: the new supreme leader’s first act of economic warfare signalling suggests that any near-term de-escalation will require more than a ceasefire conversation. It will require a fundamental re-ordering of the regional security architecture.
Iran’s IRGC says it will not allow “a litre of oil” through the Strait of Hormuz, with a spokesperson warning that oil prices could reach $200 per barrel Al Jazeera — a figure that sounds hyperbolic until one recalls that Brent crude has already crossed the $100 threshold for the first time since 2022. On Thursday, the price of a barrel of Brent crude climbed 9.2% to settle at $100.46 CBS News, vindicating the most pessimistic energy analysts who warned that the Hormuz closure would ultimately overwhelm the IEA’s release of 400 million barrels from strategic reserves.
Strait of Hormuz Closure Impact on UAE Economy: The Real Arithmetic
Here is the geopolitical paradox at the centre of this crisis: the UAE is simultaneously a victim of Iran’s Hormuz strategy and a country whose fiscal model depends on the smooth functioning of that same waterway. The Strait of Hormuz has experienced effective closure since February 28, with tanker traffic dropping approximately 70% initially before falling to near zero Wikipedia, according to vessel-tracking data. The UAE’s Fujairah export pipeline offers a partial bypass, but as energy analysts at Kpler note, terminal infrastructure at Jeddah limits throughput, and these alternative routes could sustain only a portion of displaced volume but would not offset a full Strait closure. Kpler
The knock-on effects extend well beyond crude oil. Aluminum is among the biggest non-petroleum casualties; in 2025, the Middle East accounted for roughly 21% of global output, and fertilizer shipments transiting the Strait have sent urea prices soaring from $475 per metric ton to $680 per metric ton. CNBC For a country that has positioned itself as a global logistics hub, a supply-chain rupture of this magnitude is not merely inflationary — it is reputational. As the Financial Times has reported, the narrative of Dubai as the world’s “superconnector” is facing its most serious challenge since the 2009 debt crisis.
“We’re now facing what looks like the biggest energy crisis since the oil embargo in the 1970s,” said Helima Croft, global head of commodity strategy at RBC Capital Markets. NPR That framing resonates across every boardroom in the Gulf right now. The 1973 embargo reshaped the geopolitical order. A sustained Hormuz closure — even a partial one extending through the spring — risks doing something analogous to the post-2020 Gulf diversification narrative.
How Iran Attacks Affect Dubai Real Estate Stocks: Sector Winners and Losers
Losers: Real Estate and Banking
The damage to UAE property stocks is both mechanical and psychological. Dubai off-plan projects accounted for roughly 65% of 2025 sales, with foreign buyers critical to market stability. International Business Times Those buyers — the Russian billionaires, Indian entrepreneurs, European wealth managers, and Chinese investors who drove Dubai residential prices up 60% between 2022 and early 2025 — are now watching from a safe distance. Analysts at Citi said that Emaar and Aldar were most at risk of EPS growth deterioration, while Emirates NBD and National Bank of Kuwait had the biggest downside risk in banking. “Valuation impact could potentially be more severe as stocks derate driven by increased perceived equity risk premium,” the bank said. CNBC
Bond markets, a vital source of funding for UAE developers, are now largely closed to new borrowing as costs rise across the sector. Outlook Luxe A senior real-estate banker at Reuters acknowledged that a planned capital raising was postponed this week — a small data point with large implications for a sector accustomed to selling off-plan inventory within hours of launch.
Relative Winners: Saudi Aramco and Energy Producers
Saudi Arabian stocks have outperformed this week, with Riyadh’s index up 0.6%. Saudi Aramco hit an 11-month high on Tuesday as investors bet surging oil prices would translate into higher profits. Aramco can re-route much of its crude output to a Red Sea port via pipeline, circumventing the effective Hormuz blockade. AGBI As Bloomberg has tracked, the divergence between UAE stocks and Saudi energy names captures the fundamental tension of the moment: high oil is simultaneously the cure and the disease, depending entirely on which side of the Hormuz closure you sit.
Defense, cybersecurity, and gold have performed their traditional crisis roles globally. The VIX has climbed above 27 and the 10-year Treasury yield has edged up 6.5 basis points to 4.27%, reflecting a market pricing in stagflationary risk rather than a clean growth shock.
Trump’s Iran Criticism and UAE Investor Sentiment
President Donald Trump has consistently projected confidence that the conflict will resolve rapidly — a posture that has done little to calm markets. Trump indicated the conflict could last “four to five weeks,” raising concerns of prolonged regional instability. Business Standard More puzzling for Gulf markets has been Trump’s decision to simultaneously encourage commercial shipping to transit the Strait of Hormuz while declining to formally escort those vessels — a gap between rhetoric and operational commitment that insurers and ship operators have judged harshly.
The president said at a women’s history event at the White House that the situation in Iran is moving along “very rapidly.” CBS News Gulf investors, watching Brent cross $100 and Emaar shed nearly 15% of its market capitalisation in two weeks, might be forgiven for a degree of scepticism.
The divergence between Washington’s public optimism and the market’s verdict matters enormously for UAE investor sentiment, because the UAE’s credibility as a neutral hub — its entire economic proposition for the last decade — has rested on the tacit assumption that great-power politics would not land on its doorstep. They have.
Forward-Looking Outlook: De-escalation Scenarios vs. Prolonged War
Scenario 1: Rapid De-escalation (4–6 Weeks)
A negotiated ceasefire brokered through Omani or Qatari channels — the traditional back-channels of US-Iran diplomacy — would allow Hormuz to reopen and insurance premiums to normalise within weeks. Under this scenario, Goldman Sachs economists project that US inflation would rise by approximately 0.8 percentage points and GDP growth would be trimmed by 0.3 percentage points Axios, manageable discomfort rather than a structural break. UAE property stocks could recover sharply — foreign buyers with deferred demand tend to surge back into perceived-value plays when the security fog lifts.
Scenario 2: Prolonged Conflict (3–6 Months)
Oxford Economics modelled a scenario in which oil averages $140 a barrel for two months — a “breaking point” for the world economy that would push the eurozone, UK, and Japan into contraction and create an economic standstill in the US. Axios Under this scenario, Dubai’s property market faces a structural reset: not a crash necessarily, but a repricing of the “safe haven” premium that has underpinned valuations. The off-plan model — built on the expectation of continuous foreign capital inflows — comes under existential pressure.
Most shipping companies have decided to route around the southern tip of Africa rather than through the strait Wikipedia, adding weeks to transit times and billions to freight costs. If that rerouting persists into summer, the damage to Jebel Ali’s transshipment volumes — and to Dubai’s self-image as the world’s logistics fulcrum — becomes structural, not cyclical.
The honest assessment: the UAE’s extraordinary diversification story — its pivot from oil to finance, tourism, logistics, and real estate — has made it wealthier and more resilient than almost any comparable Gulf state. It has also made it more exposed to exactly the kind of shock that the Iran war represents: a demand-side confidence crisis affecting precisely those foreign investors and expatriates whose spending underwrites the diversification miracle.
Investor Implications: What to Watch Next
- Hormuz shipping data (tracked by Kpler and MarineTraffic): any sustained uptick in tanker transit volume would be the most credible early signal of de-escalation
- UAE CDS spreads and sovereign bond yields: credit markets tend to front-run equity recovery
- Emaar off-plan sales data: a bellwether for foreign buyer confidence — a drop of more than 30% sustained over four weeks would indicate structural demand deterioration
- IRGC statements on Mojtaba Khamenei’s directives: the new supreme leader’s strategic posture toward Hormuz is the single most important variable in this conflict
- Trump–Gulf summit signals: any diplomatic framework involving direct US-Iran talks could catalyse a sharp rally in UAE equities
FAQ: UAE Stocks and the Iran Conflict
Why are UAE stocks falling in March 2026? UAE stocks are falling because Iran’s retaliatory strikes on UAE territory following US-Israeli attacks on Iran have raised fears of prolonged conflict. The closure of the Strait of Hormuz, direct infrastructure damage in Dubai and Abu Dhabi, and the flight of foreign investor capital have combined to push the DFM index down more than 10% since late February. The Dubai index closed at 5,518 on March 12, a loss of 3.64% in a single session.
What is the impact of the Strait of Hormuz closure on the UAE economy? The Strait of Hormuz carries roughly 20% of the world’s crude oil and significant LNG volumes. Its effective closure since March 2 has disrupted the UAE’s oil exports, halted activity at Jebel Ali port, and elevated insurance and freight costs sharply. The UAE’s Fujairah bypass pipeline provides partial relief but cannot handle the full volume of Hormuz traffic. Prolonged closure risks permanent damage to Dubai’s logistics and re-export hub status.
What has Mojtaba Khamenei said about the stock market and the Iran conflict? Mojtaba Khamenei, Iran’s new supreme leader following his father’s death in the February 28 US-Israeli strikes, issued his first public statement via state media urging Iran to maintain its stranglehold on the Strait of Hormuz and continue attacks on Gulf Arab nations. The statement significantly reduced expectations of a near-term ceasefire and accelerated the selloff in UAE and regional equities.
How much have Emaar Properties shares fallen? Emaar Properties has suffered three consecutive sessions of near-maximum allowable daily declines of 5% since UAE markets reopened following their emergency two-day closure. The stock, which hit a 21-year peak in early February 2026, has erased approximately 15% of its market value since the conflict erupted, as foreign investors reassess the risk premium attached to Dubai real estate in a wartime environment.
Will UAE stocks recover? Recovery depends almost entirely on the trajectory of the Iran conflict. A ceasefire within four to six weeks — the scenario Trump has publicly suggested — would likely trigger a sharp rebound in UAE equities, as underlying fundamentals remain strong. A prolonged conflict lasting months, however, risks structural repricing of Gulf risk premiums, particularly for real estate developers and banks with large foreign ownership bases.
Discover more from The Economy
Subscribe to get the latest posts sent to your email.
-

 Markets & Finance2 months ago
Top 15 Stocks for Investment in 2026 in PSX: Your Complete Guide to Pakistan’s Best Investment Opportunities
-

 Analysis1 month ago
Brazil’s Rare Earth Race: US, EU, and China Compete for Critical Minerals as Tensions Rise
-

 Banks2 months ago
Best Investments in Pakistan 2026: Top 10 Low-Price Shares and Long-Term Picks for the PSX
-

 Investment2 months ago
Top 10 Mutual Fund Managers in Pakistan for Investment in 2026: A Comprehensive Guide for Optimal Returns
-

 Asia2 months ago
China’s 50% Domestic Equipment Rule: The Semiconductor Mandate Reshaping Global Tech
-

 Global Economy3 months ago
Pakistan’s Export Goldmine: 10 Game-Changing Markets Where Pakistani Businesses Are Winning Big in 2025
-

 Analysis3 weeks ago
Top 10 Stocks for Investment in PSX for Quick Returns in 2026
-

 Global Economy3 months ago
15 Most Lucrative Sectors for Investment in Pakistan: A 2025 Data-Driven Analysis