
Analysis
Rupee Records Gain Against US Dollar: Currency Settles at 279.31 as Safe-Haven Dollar Hits Highest Level Since November Amid Iran Conflict Turmoil

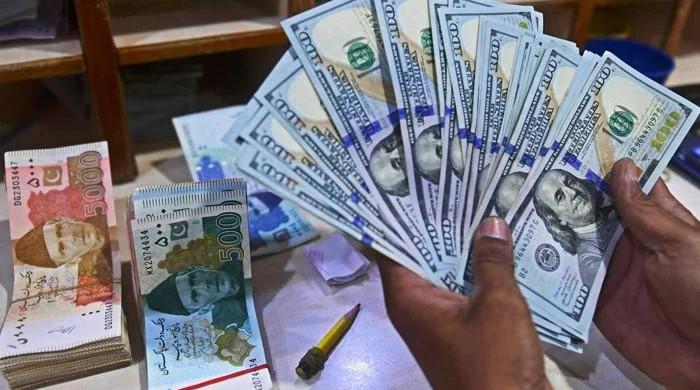
On the trading floors of Karachi’s inter-bank market Friday morning, a single pip of movement — from 279.32 to 279.31 — told a story far larger than its decimal-place modesty suggests. Outside those air-conditioned dealing rooms, Pakistani families were already absorbing the downstream tremors of a war being fought thousands of miles away: liquefied natural gas supplies from Qatar disrupted, fuel costs creeping upward, and grocery bills tightening in a country that imports nearly 40 percent of its energy needs. Yet the rupee, against all intuition, held its ground — and even nudged fractionally stronger against the world’s most sought-after safe-haven currency.
That currency, the US dollar, was having rather a good week of its own. The dollar index (DXY), which measures the greenback against a basket of six major peers, climbed to its highest reading since November — touching 99.63 in early Asian trading on Friday, down just 0.04 percent intraday but on track for a weekly advance of 0.8 percent. It was the dollar’s second consecutive weekly gain since the United States and Israel launched joint strikes on Iran on February 28, triggering the largest disruption to global oil supplies since the Suez Crisis of 1956.
How the rupee managed a marginal appreciation against this resurgent dollar — and what that tells us about Pakistan’s precarious economic moment — is a question that requires both a currency trader’s precision and a geopolitical historian’s sweep.
Why the Rupee Defied the Dollar’s Safe-Haven Surge
The immediate answer to the PKR exchange rate puzzle lies in momentum and managed stability rather than fundamental strength. Pakistan’s inter-bank rupee rate today reflects the State Bank of Pakistan’s (SBP) continued intervention framework, which has sought to prevent the kind of disorderly depreciation that scarred the country during its 2023 balance-of-payments crisis. The currency settled at 279.31 USD to PKR on Thursday’s close, a fractional improvement from 279.32 the previous session — a gain so slim it would barely register as a rounding error were it not for the context surrounding it.
Yet context is everything. The Pakistan rupee rate today is holding within a remarkably narrow band even as emerging-market currencies across South and Southeast Asia are taking a battering from dollar strength and surging import bills. The Indonesian rupiah has weakened sharply; the Indian rupee has come under pressure; the Sri Lankan currency remains fragile. Against this backdrop, PKR stability is, in relative terms, a modest achievement.
Three factors explain the rupee’s resilience. First, the SBP has maintained a managed float that caps excessive short-term volatility, acting as a buffer against external shocks. Second, remittance inflows — Pakistan’s economic lifeline — have held firm as the Pakistani diaspora in Gulf states, the United Kingdom, and North America continues to send money home, partly drawn by more favourable exchange-rate conditions than existed twelve months ago. Third, and perhaps most counterintuitively, the partial easing of import demand due to Pakistan’s economic slowdown has somewhat reduced pressure on the current account, lessening the appetite for dollars in the inter-bank market.
Iran War Turmoil and the Dollar Index at 11-Month High
The dollar’s current strength is a story of dual engines firing simultaneously, and understanding it requires grasping something that would have seemed paradoxical even five years ago: the United States is now a net energy exporter.
When the Bloomberg Dollar Spot Index staged its biggest two-day rally in nearly a year following the onset of the Iran conflict, analysts pointed to two reinforcing dynamics. The first was the classic flight-to-quality response — when global investors grow fearful, they buy dollars, US Treasuries, and other liquid dollar-denominated assets. The second was structural: because the US now produces more energy than it consumes, surging oil prices are an economic tailwind for America, not the headwind they once were.
“Not only are high oil prices no longer a headwind for the dollar,” Paul Weller, a foreign exchange strategist cited by S&P Global Market Intelligence, noted, “but they’re arguably now a tailwind, especially when accompanied by a risk-off safe-haven bid.” Jane Foley, head of foreign exchange research at Rabobank, was equally direct: the Iran conflict has settled the debate about whether the dollar retains its safe-haven status after a bruising year of de-dollarisation narratives. It emphatically does.
The DXY’s reading of 99.63 — the highest since November 2025 — came after the dollar had climbed roughly 2.1 percent from its late-February levels, when the index was closer to 96. The conflict’s second week has seen Iran’s new Supreme Leader Mojtaba Khamenei pledge to maintain the effective closure of the Strait of Hormuz — the narrow waterway through which approximately a fifth of global oil supplies normally transits. Every credible threat to extend that closure sends another wave of capital into the dollar’s embrace.
For Pakistan, the consequences run deeper than any single exchange-rate print. Elisabeth Colleran, co-head of the emerging markets debt team at Loomis Sayles, captured the dynamic precisely: when global volatility spikes, the dollar rallies, and all other currencies — “euro included” — are pushed down. For a frontier-market economy still in the midst of an IMF stabilisation programme, that means tighter financial conditions, narrower room for monetary easing, and a structurally more expensive import bill.
Oil at $100+ a Barrel: Mixed Blessings for Pakistan as US Exports Energy
Brent May futures settled around $100.56 a barrel on Friday — up just 0.1 percent intraday but poised for a weekly gain of approximately 9 percent, one of the sharpest weekly moves in years. WTI April contracts were slightly softer at $95.57, off 0.2 percent, headed for a 7 percent weekly advance despite the US Treasury’s Thursday issuance of a 30-day general licence permitting purchases of previously sanctioned Russian crude stranded at sea.
The IEA’s emergency release of a record 400 million barrels from strategic reserves — the largest such move in history — has done little more than paper over a structural deficit. As the CNN analysis noted, that 400 million barrels covers only approximately 26 days of supply lost through Hormuz disruption, and Iran’s new leadership has signalled no intention of reopening the strait.
For Pakistan, this creates a toxic arithmetic. The country imports 40 percent of its energy needs and relied particularly heavily on LNG from Qatar — supplies that have been severed by the conflict, according to PBS NewsHour. Economists Gareth Leather and Mark Williams at Capital Economics have argued that rather than cutting interest rates to offer relief to a slowing economy, the SBP may be compelled to raise them — because persistently higher energy prices threaten to reignite inflation that has remained uncomfortably elevated by regional standards.
The bitter irony is that oil at $100 per barrel is simultaneously enriching America’s energy producers and quietly crushing Pakistan’s households. A country that once benefited from relatively cheap Gulf hydrocarbons now finds itself paying a geopolitical premium it neither caused nor controls.
Key data points at a glance:
- Brent crude (May futures): $100.56 | +9% weekly gain
- WTI crude (April futures): $95.57 | +7% weekly gain
- Pakistan energy import dependency: ~40% of total needs
- LNG from Qatar: effectively disrupted since Feb. 28
Yen, Euro and Sterling: The Other Casualties of Safe-Haven Flight
Pakistan is not alone in watching its currency wilt before the dollar’s current authority. The major G10 pairs tell a consistent story of asymmetric impact.
The euro traded at $1.1525, up just 0.13 percent intraday but near its weakest level since November — pressured by FXStreet data showing EUR/USD losing ground for three consecutive sessions as the Hormuz closure stoked stagflationary fears across the eurozone, which imports the vast majority of its energy.
The Japanese yen offered the most dramatic signal of stress: USD/JPY climbed to 159.43 on Thursday — its weakest since January 14 — before pulling back slightly to 159.08 (+0.17%). Japan’s vulnerability is structural: as a massive net energy importer, every dollar-per-barrel increase in oil translates directly into a larger import bill and a weaker yen. Markets are watching closely for signs of Bank of Japan intervention; the 160 level, which triggered intervention in 2024, remains the psychological tripwire.
Sterling held relatively better at $1.3356 (+0.11%), buoyed in part by the UK’s comparatively more balanced energy position and the Bank of England’s hawkish recent signalling. But the pound, too, is tracking lower against the dollar on a weekly basis.
The pattern is unmistakable: the Iran conflict has triggered what one analyst from the 2026 Middle East crisis coverage aptly described as a “Stagflationary Risk-Off” shift — one where traditional safe havens like Japanese government bonds and even gold are struggling, and the dollar, uniquely insulated by America’s energy exporter status, stands almost alone as the credible refuge.
What This Means for Pakistani Importers, Exporters and SBP Policy
For Pakistani businesses and households navigating the interbank rupee rate in real time, the current configuration presents a split-screen reality.
Importers face a double squeeze: a stronger dollar raises the cost of dollar-denominated purchases even before the commodity price effect, and that commodity price effect — in energy, petrochemicals, edible oils, and fertilisers — is itself ferocious. Up to 30 percent of global fertiliser exports, including urea and phosphates, transit the Strait of Hormuz. Pakistani farmers, already grappling with climate disruption, will face higher input costs precisely when food security concerns are mounting globally.
Exporters, particularly in Pakistan’s critical textile sector, stand to benefit modestly from a structurally weaker rupee over time — more rupees per dollar earned means higher local-currency revenues. But the benefit is partially eroded by higher energy costs in production, and by the global demand uncertainty that accompanies any prolonged oil shock. If the conflict persists and oil reaches the $120-130 range that Chatham House analysts consider plausible in a more severe scenario, the net export benefit quickly becomes ambiguous.
For the SBP, the policy calculus is exquisitely uncomfortable. Pakistan’s ongoing IMF programme — agreed in the wake of the 2023 crisis — requires fiscal consolidation, reserve accumulation, and a degree of exchange-rate flexibility. The current period tests all three simultaneously: capital outflows from emerging markets, higher import costs threatening the current account, and inflation pressures that could derail the path toward lower interest rates that Pakistani businesses desperately need.
The central bank’s managed float has bought it credibility and stability. The question for the weeks ahead is whether that credibility can be sustained as global conditions tighten further.
Outlook: Will the Rupee’s Streak Continue in 2026?
The honest answer is: it depends far more on Tehran and Washington than on Karachi.
Three scenarios present themselves. In the most benign — a rapid ceasefire or diplomatic resolution, oil returning toward pre-conflict levels of $60-70 per barrel within weeks — Pakistan would likely see continued rupee stability, possible SBP rate cuts in the second half of the year, and manageable pressure on its IMF programme. Chatham House’s analysts suggest that in this scenario, inflation in energy-importing economies rises by only around 0.5 percentage points above pre-conflict forecasts for 2026.
In a medium scenario — conflict persisting for several months, oil stabilising in the $90-100 range — Pakistan would face a prolonged squeeze. The current account would deteriorate, the SBP would be forced to delay any monetary easing, and the rupee’s current stability would require more active management. Remittance inflows from Gulf-based workers — a critical buffer — could also come under pressure if Gulf economies begin to feel the strain of production cuts and regional instability.
In the worst-case scenario — a prolonged closure of the Strait of Hormuz, oil at $130 or above, and a sustained dollar rally past 100 on the DXY — Pakistan’s position becomes genuinely alarming. Its IMF support would remain vital but potentially insufficient to absorb both a terms-of-trade shock and a global risk-off environment simultaneously.
There are structural wildcards, too. The China-Pakistan Economic Corridor (CPEC), which has delivered significant renewable-energy infrastructure to Pakistan, is now being viewed through a new lens: every solar panel and wind turbine installed under CPEC reduces Pakistan’s exposure to the very oil-price volatility that is currently ravaging its economy. The Stimson Center’s Dan Markey, quoted by Inside Climate News, has argued that Pakistan will have “every reason to turn to China for renewable energy technologies” in the wake of this crisis — a strategic pivot with profound long-term implications for the CPEC relationship and for Pakistan’s energy autonomy.
The rupee vs dollar March 2026 picture is ultimately a microcosm of the broader global realignment underway. A fractional gain of one pip in the inter-bank market feels almost quaint against the backdrop of a region at war, oil markets in convulsion, and a global safe-haven hierarchy being stress-tested in real time. But markets, like history, move in cumulative inches before they lurch in miles. Pakistani policymakers — and the businesses and families who depend on them — would do well to watch both.
Discover more from The Economy
Subscribe to get the latest posts sent to your email.



Key Takeaways
- Rolex’s secondary market rose approximately 7.9% year-over-year as of 2026 (per WatchCharts data) — trailing Patek Philippe (+16.2%) and Tudor (+11.4%) but still outperforming Audemars Piguet (+3.4%).
- Rolex raised U.S. retail prices 4–9% in January 2026 (steel models ~5.6%, gold models ~8.7%), narrowing the historical gap between retail and pre-owned pricing.
- Not every model appreciates: steel sports references (Submariner, GMT-Master II, Daytona) have held value far better than two-tone or widely available dress references like the standard Datejust.
- The Lady-Datejust posted the sharpest 2026 gain among tracked collections — up 22.73%, from roughly $9,269 to $11,376 — driven by demand for smaller, “everyday luxury” watches.
- Gold’s rise past $2,400/oz has directly lifted the investment case for Rolex’s precious-metal references (Day-Date, Sky-Dweller, Yacht-Master).
The Model-by-Model Picture
| Category | 2026 Trend |
|---|---|
| Lady-Datejust | +22.73% (strongest performer among tracked collections) |
| Steel sports models (Submariner, GMT-Master II) | Held value well; corrected from 2022 peak but stabilized above retail |
| Daytona | Corrected from highs above $50,000 to the mid-$30,000s; still among the most sought-after references |
| Two-tone/widely available Datejust | Flat to negative — “holds value” is an overstatement for this category |
| Gold references (Day-Date, Sky-Dweller) | Lifted by gold’s rise above $2,400/oz |
Why the “Rolex Always Appreciates” Myth Is Fading
The pandemic-era boom pushed some references — the Daytona above all — to speculative highs disconnected from historical norms. Since the March 2022 peak, steel sports models have compressed meaningfully, and dealers who bought inventory near the top have in some cases faced 20–40% markdowns on liquidation. The lesson for 2026 buyers: Rolex as a category is not a monolith. Value retention depends heavily on specific reference, condition, and whether the piece comes with box and papers (“full set”).
What’s Actually Driving 2026 Strength
- Retail price increases raise the floor. When a new Submariner retails at $10,050 (up from $9,500), a pre-owned example at $11,000–$12,000 suddenly represents a smaller premium — narrowing the gap without secondary prices actually moving.
- Supply discipline remains Rolex’s core lever. The brand has never confirmed production numbers, and secondary-market premiums remain entirely a function of Rolex’s own manufacturing decisions — a risk factor as much as a support.
- Certified Pre-Owned rollout. Rolex’s now fully rolled-out CPO program has changed how buyers transact in the used market, adding a layer of brand-verified legitimacy that supports pricing.
The Case for Rolex as a Portfolio Diversifier
Financial advisors increasingly frame luxury watches not as a replacement for equities or bonds, but as a tangible, historically low-correlation diversifier — one that carries its own risks (illiquidity, condition-dependent pricing, no yield) but has demonstrated multi-decade resilience for specific references.
Is Rolex a good investment in 2026?
It depends heavily on the specific reference. Steel sports models like the Submariner and Daytona have held or grown in value; two-tone and widely available dress models generally have not. Overall, Rolex’s secondary market rose about 7.9% year-over-year in 2026, trailing Patek Philippe but ahead of Audemars Piguet.
Discover more from The Economy
Subscribe to get the latest posts sent to your email.

Navigating Mortgage and Loan Refinancing in a High-Yield Environment
Global public debt crossing critical thresholds has kept central bank policies volatile, resulting in fluctuating US Treasury yields throughout 2026. For homeowners and commercial property holders burdened by previous high-interest borrowing cycles, finding optimal refinance windows has become a high-stakes financial puzzle. Stalled disinflation and stubborn employment numbers mean rate cuts are incremental, requiring borrowers to act with precision.
Timing your mortgage or commercial loan refinance in this environment requires a deep understanding of yield curve movements and lender risk appetites.
Decoding 2026 Refinance Dynamics
The 10-Year Treasury Yield Benchmark
Mortgage rates continue to track closely with the 10-year US Treasury yield. When macroeconomic anxiety spikes debt issuance, yields rise, tightening consumer borrowing capacity. Savvy borrowers monitor weekly Treasury auctions to lock in rates during brief dip windows.
Hybrid ARMs and Alternative Structures
With fixed rates remaining elevated, 7/1 and 10/1 adjustable-rate mortgages (ARMs) have surged in popularity. These products offer lower initial monthly payments, giving borrowers breathing room until central bank easing cycles fully materialize.
| Loan Product | Current Rate Range | Best For | Key Risk Factor |
| 30-Year Fixed Mortgage | 6.2% – 6.8% | Long-term predictability | Higher initial monthly outlay |
| 7/1 Hybrid ARM | 5.5% – 5.9% | Short-term ownership / flipping | Rate reset risk after year 7 |
| Commercial Refinance | 7.0% – 8.2% | Corporate asset restructuring | Strict DSCR lender covenants |
Actionable Steps for Successful Refinancing
To maximize your chances of securing favorable refinance terms in a volatile market, follow a disciplined preparation strategy.
Boost Your Credit Score Immediately: Lenders in 2026 are applying stringent credit tiering; a 20-point increase can drop your APR by a crucial quarter-point.
Shop Regional Credit Unions: Smaller financial institutions often offer portfolio loans with more flexible underwriting than major national banks.
Calculate the Break-Even Point: Ensure your total closing costs are recouped through monthly savings within 24 months of closing.
“Market Strategist View: Refinancing in 2026 is an exercise in opportunistic timing. Borrowers must maintain immaculate financial profiles ready to strike the moment Treasury yields dip.”
Mastering the complexities of today’s debt environment ensures you can successfully lower your debt service costs and protect your long-term financial stability.
Discover more from The Economy
Subscribe to get the latest posts sent to your email.

The days of pulling generic auto insurance quotes based purely on your zip code and age are officially over. In 2026, insurance comparison engines are powered entirely by generative AI and real-time telematics. These platforms digest thousands of live data points—ranging from your driving smoothness via connected vehicle sensors to real-time traffic congestion patterns—to generate hyper-personalized premiums instantly.
For consumers, this evolution represents both a massive opportunity for savings and a hidden trap for penalty pricing. Understanding how AI algorithms evaluate risk is essential for anyone looking to lower their monthly auto insurance premiums.
How AI Comparison Engines Evaluate Your Risk Profile
Behavioral Telematics and Connected Cars
Modern cars stream performance data directly to insurance aggregators. Generative AI models analyze braking sharpness, acceleration curves, cornering G-forces, and phone distraction metrics. Drivers who maintain smooth, defensive habits are rewarded with dynamic rate cuts of up to 40% compared to traditional rating tiers.
Predictive Traffic and Weather Modeling
AI tools now cross-reference your daily commute route with predictive weather and accident probability models. If your standard parking location or driving corridor has a statistically higher incidence of uninsured motorist claims, your quotes will reflect that hyper-local risk assessment.
| Comparison Factor | Traditional Rating Model | 2026 Generative AI Model | Impact on Premium |
| Mileage & Usage | Annual estimated odometer reading | GPS tracking & live trip duration | High (up to 35% savings) |
| Driving Behavior | MVR driving record & accidents | Real-time braking, speed, & G-force | Critical (determines tier) |
| Vehicle Tech | Make, model, and safety rating | ADAS calibration & repair cost data | Moderate |
Strategies to Lower Your AI-Driven Insurance Quote
To outsmart the algorithm and secure the lowest possible premium in 2026, drivers must proactively manage their digital footprint on insurance platforms.
Opt-In for Telematics Trial Periods: Many insurers offer immediate 15% discounts just for installing their driving app; let it track safe habits for 30 days to lock in permanent savings.
Scrub Unverified Public Records: Ensure your motor vehicle report is free of clerical errors that AI risk models misinterpret as reckless behavior.
Compare AI Aggregators: Use platforms that integrate multi-carrier API feeds rather than single-brand comparison sites to find the best risk-adjusted rate.
“Industry Note: AI-driven pricing rewards transparency and precision. Drivers who actively manage their telematics data consistently out-save those relying on legacy quote calculators.”
Embracing AI comparison tools allows savvy policyholders to customize coverage limits precisely to their driving habits, eliminating wasted premium spend while ensuring robust protection.
Discover more from The Economy
Subscribe to get the latest posts sent to your email.

Bitcoin & XRP 2026: Inside Crypto’s Institutional Era

Global Economy 2026: IMF Growth, AI Stocks & Market Risk

China’s Local Debt Race Against Time: Why Economists Demand Central Action Before the Deflation Window Closes

Money News: How to Protect Your Portfolio From Global Inflation

World Bank Projections: Emerging vs. Big Economies of Asia

IMF Reports 2026: What the Latest Data Means for the Global Economy

Singapore Stocks Outlook: A Safe Haven in the Asian Market?

China Stocks vs. Japan Stocks: Where Should You Invest in Late 2026?

VIX Index Explained: How to Trade Wall Street’s Fear Gauge Today

Commercial vs Residential Real Estate: Which Wins in 2026?

Presidential Stock Market Performance: How Trump’s Second Term Compares to History

2026 Real Estate Market News: Are We Heading for a Correction?

Bitcoin Price Forecast 2026–2027: Will the 4-Year Cycle Hold?

Fidelity Crypto vs. Traditional Brokerages: A Guide for Modern Investors

US-China Relations in Q3 2026: Trade Tariffs and Supply Chain Risks

Top 30 Stocks for Investment in PSX for Massive ROI in 2026

SpaceX Starship Flight 14: First Orbital Attempt & Starlink V3 Launch Explained

AI Chip Stocks 2026: The Best Semiconductor Investments Beyond Marvell

The 2026 Crypto Regulatory Shift: What It Means for Institutional Investors

Tween Back-to-School Trends 2026: What’s Driving the $85B Season

Fidelity Investments Review 2026: SPAXX Yields & Zero-Fee Funds

Oil Prices Break $100 in 2026: Middle East Conflict & Energy Markets

AI-Powered Training: The Next Multi-Billion Dollar Ecosystem in Fitness

10-Year Treasury Yield Hits 4.80%: What It Means for Rates & Portfolios

BRICS+ Cross-Border Payments 2026: Interoperability Explained

Shein Clothes Quality & Safety in 2026: What Lab Tests Show

MRVL Earnings 2026: Why Marvell Sank Despite Beating Estimates

China’s US$10.8 Billion Trade Shortcut: Why the Pinglu Canal Matters
-

 Markets & Finance9 months ago
Top 15 Stocks for Investment in 2026 in PSX: Your Complete Guide to Pakistan’s Best Investment Opportunities
-

 Analysis7 months ago
Johor’s Investment Boom: The Hidden Costs Behind Malaysia’s Most Ambitious Economic Surge
-

 Analysis7 months ago
Top 10 Stocks for Investment in PSX for Quick Returns in 2026
-

 Analysis8 months ago
Brazil’s Rare Earth Race: US, EU, and China Compete for Critical Minerals as Tensions Rise
-

 Banks8 months ago
Best Investments in Pakistan 2026: Top 10 Low-Price Shares and Long-Term Picks for the PSX
-

 Investment8 months ago
Top 10 Mutual Fund Managers in Pakistan for Investment in 2026: A Comprehensive Guide for Optimal Returns
-

 Global Economy9 months ago
15 Most Lucrative Sectors for Investment in Pakistan: A 2025 Data-Driven Analysis
-

 Global Economy9 months ago
Pakistan’s Export Goldmine: 10 Game-Changing Markets Where Pakistani Businesses Are Winning Big in 2025