
Analysis
The Strait of Hormuz: The World’s Most Dangerous Energy Chokepoint

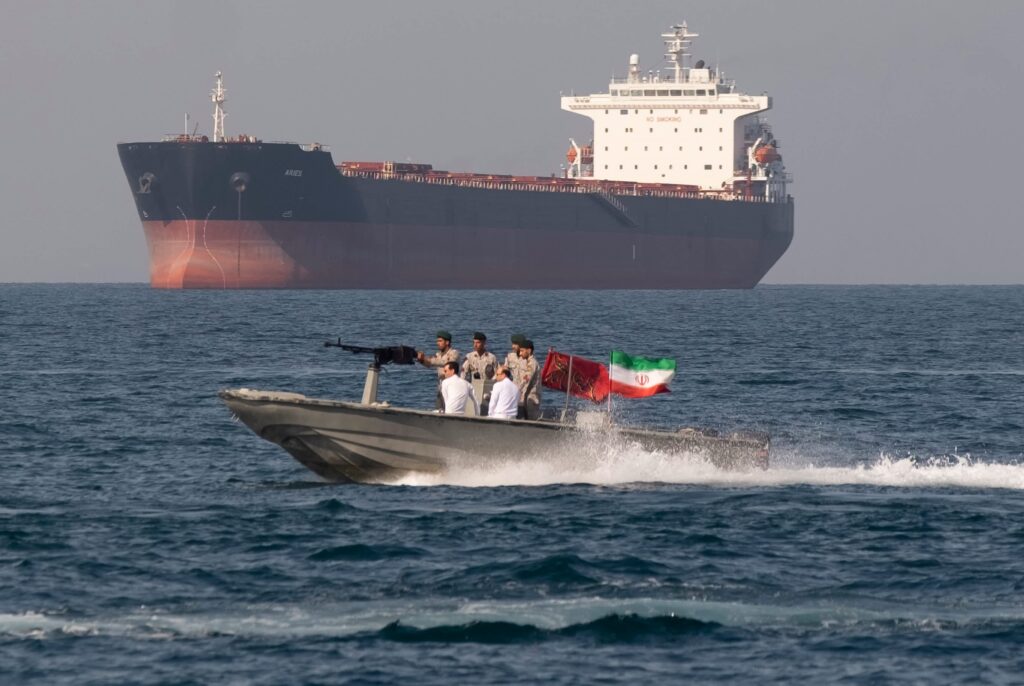
There is a strip of seawater — twenty-one miles wide at its narrowest, wedged between the Iranian coastline and the Omani shore — that has long been described by energy analysts as the single most consequential geographic feature in the global economy. For decades, that description felt like an abstraction. A risk. A theoretical vulnerability that strategists pencilled into worst-case scenarios and then quietly filed away.
The events of late February 2026 have made that abstraction brutally, expensively concrete.
On 28 February, the United States and Israel initiated coordinated airstrikes on Iran under Operation Epic Fury, targeting military facilities, nuclear sites, and leadership. Within hours, at least three oil tankers had been struck near the strait, shipping companies began suspending transits, and oil prices were moving with a velocity not seen in modern market history. Brent crude crossed $100 per barrel on 8 March — for the first time in four years — before surging to a peak of $126 per barrel. Wikipedia
The Strait of Hormuz crisis of 2026 has since been characterized by the head of the International Energy Agency, Fatih Birol, as “the largest supply disruption in the history of the global oil market.” World Economic Forum That is not hyperbole. That is the understated language of a man watching the architecture of global energy security collapse in real time.
This essay is not another news dispatch. It is an argument — an urgent, evidence-based argument — that the Hormuz crisis has exposed structural failures so profound, and dependencies so reckless, that incremental policy responses are no longer sufficient. The world needs radical rethinking. And it needed it twenty years ago.
The Anatomy of a Chokepoint: Why Hormuz Was Always the Most Dangerous Fault Line
The Strait of Hormuz is the world’s pre-eminent energy chokepoint not because of its width but because of its irreplaceability. Its two unidirectional sea lanes facilitate the transit of around 20 million barrels of oil per day, representing roughly 20% of global seaborne oil trade, primarily from producers like Saudi Arabia, the United Arab Emirates, Iraq, and Qatar. Wikipedia
But the implications of Strait of Hormuz closure on the world energy economy extend far beyond crude oil — and this is precisely what the shallow reporting of prior crises failed to capture. While focus rightly falls on the 11 million barrels of oil and 140 billion cubic metres of gas in daily global circulation, the impact extends far beyond energy. World Economic Forum The strait is simultaneously an artery for liquefied natural gas, fertilizers, aluminium, methanol, sulfur, helium, and petrochemical feedstocks — a supply chain polymath that quietly underpins everything from the plastic packaging on your groceries to the nitrogen fertilizer that grew the corn in your food.
The U.S. Energy Information Administration has long designated Hormuz as a “world oil transit chokepoint,” noting in successive annual reports that no viable substitute exists at comparable volume. The EIA’s warnings were consistent, authoritative, and largely ignored by policymakers who preferred optimism to contingency planning.
The Strait’s geopolitical risks are equally structural. It is, uniquely among major chokepoints, bordered on one side by a state — Iran — with both the capability and the demonstrated willingness to weaponize the waterway in pursuit of strategic objectives. The Strait of Suez has Egypt. The Strait of Malacca has Malaysia and Indonesia. Hormuz has Iran. That asymmetry has always made it the most dangerous fault line in global energy logistics.
February–April 2026: How the Crisis Unfolded
The immediate trigger was Operation Epic Fury, but the conditions for catastrophe had been accumulating for years. Tensions between Iran, the United States, and Israel had escalated in the lead-up to 2026, stemming from failed nuclear negotiations in Geneva and a prior 12-day air conflict in 2025. Wikipedia In the weeks before the strikes, war-risk ship insurance premiums for the strait increased from 0.125% to between 0.2% and 0.4% of the ship insurance value per transit — for very large oil tankers, an increase of a quarter of a million dollars per crossing. Wikipedia
What followed February 28 was a cascade of compounding failures that no strategic reserve or pipeline bypass could adequately address.
The warnings and subsequent attacks on vessels caused tanker traffic to drop first by approximately 70%, with over 150 ships anchoring outside the strait. Traffic subsequently dropped to near zero. Wikipedia Major container shipping companies — Maersk, Hapag-Lloyd, and CMA CGM — suspended operations, rerouting vessels around Africa’s southern tip. CNBC War-risk insurers followed, cancelling protection and indemnity insurance for Gulf transits from 5 March. Carra Globe The result, as commodity intelligence firm Kpler diagnosed with clinical precision, was a de facto closure for most of the global shipping community — insurance withdrawal doing the work that a physical blockade had not. Kpler
Vessel tracking data indicate that 16 million barrels per day of crude oil and oil products have stopped flowing through the Strait — a staggering decline of 80 percent compared to the 2025 average, with only 10 vessel crossings recorded over a four-day period, against a typical daily average of 70 to 80. Gulf International Forum
On 27 March, the IRGC formally declared the strait closed to vessels bound to or from the ports of the United States, Israel, and their allies. By early April, Brent crude had climbed to $127.61 per barrel — nearly double the $71.32 price recorded the day before Operation Epic Fury. USNI News
The Economic and Geopolitical Implications: A Multi-Layered Shock
Hormuz Blockade Impact on Oil Prices and the Spectre of Stagflation
The oil price shock alone would constitute a significant macroeconomic event. But the Federal Reserve Bank of Dallas has modelled the full GDP consequences with sobering precision. A complete cessation of oil exports from the Gulf amounts to removing close to 20 percent of global oil supplies from the market. The Dallas Fed model implies this raises the average WTI price to $98 per barrel and lowers global real GDP growth by an annualized 2.9 percentage points in Q2 2026. Dallas Fed If the disruption extends to three quarters, oil prices could reach $132 per barrel and global real GDP growth could fall 1.3 percentage points for the year. Dallas Fed
The even grimmer scenario circulating among Wall Street analysts cited by Bloomberg is $200 per barrel — a number that, if realized, would constitute not merely a recession trigger but a structural shattering of the post-pandemic global recovery.
European gas markets have been hit through a separate but reinforcing channel: historically low gas storage levels — estimated at just 30% capacity following a harsh 2025–2026 winter — meant that QatarEnergy’s force majeure declaration sent Dutch TTF gas benchmarks nearly doubling to over €60/MWh by mid-March. Wikipedia The echoes of 2022, when Russia’s invasion of Ukraine upended European energy, were unmistakable and humiliating: the continent had, once again, failed to structurally wean itself from a single fragile supply corridor.
Hormuz Blockade Impact on Asian Oil Imports: The Existential Exposure
If Europe’s predicament is severe, Asia’s is existential. The Strait of Hormuz as a chokepoint creates geopolitical risks that are disproportionately concentrated in the Asia-Pacific region — and the 2026 crisis has exposed that vulnerability with a candour that decades of diplomatic optimism obscured.
In 2024, 84% of the crude oil and condensate and 83% of the LNG that moved through the Strait went to Asian markets, with China, India, Japan, and South Korea accounting for a combined 69% of all Hormuz crude flows. Seatrade Maritime
The individual country exposure is jaw-dropping. Japan relies on the strait for close to three-quarters of its oil imports; South Korea sources roughly 60% of its crude via the same route; almost half of India’s crude oil imports and about 60% of its natural gas supplies move through Hormuz. Seatrade Maritime Around 84% of the crude oil and 83% of the LNG passing through the Strait went to Asia in 2024. Wikipedia
For the LNG market — where there are genuinely no alternative routes for stranded Gulf production — the situation is even more extreme. Unlike oil, there are no alternative routes to get the gas to market and very few strategic stockpiles to cushion the shortfall. Bloomberg LNG spot prices in Asia increased by over 140% as QatarEnergy declared force majeure on its contracts and shut down gas liquefaction at Ras Laffan, with analysts warning that restarting would take weeks. Wikipedia
South Korean petrochemical producers cut run rates by up to 50 percent. Japan, sourcing roughly 4 in every 10 barrels of its crude from the Gulf, faced comparable pressure. Atlantic Council Meanwhile, China — the largest crude importer on earth — discovered that its buffers, while more substantial than its neighbours’, were not inexhaustible. China’s LNG inventories as of end-February stood at 7.6 million tonnes, providing short-term cover, but Beijing would need to compete for Atlantic cargoes if the outage persisted. CNBC
Chart suggestion: Pre- and Post-Crisis Daily Flows Through the Strait of Hormuz (barrels/day, LNG volumes, Q4 2025 vs. March 2026)
The Fertilizer and Food Security Cascade: The Crisis Nobody Saw Coming
The most underappreciated dimension of the 2026 Hormuz crisis is not its energy dimensions — it is its agricultural ones.
The Arabian Gulf is the central hub for global agriculture, accounting for at least 20% of all seaborne fertilizer exports. The dependency is even more acute for urea, the world’s most widely used nitrogen fertilizer, with 46% of global trade originating from the region. World Economic Forum This supply is critical for India (which accounts for 18% of global urea imports), Brazil (10%), and China (8%).
About one-third of global seaborne trade in fertilizers typically passes through the Strait of Hormuz. The disruption affects not only export markets such as Sudan, Brazil, or Sri Lanka, but also fertilizer producers elsewhere that lack key ingredients. Carnegie Endowment for International Peace The Gulf produces roughly a quarter of global sulfur — a byproduct of oil refining that phosphate producers worldwide need to convert rock phosphate into a plant-absorbable nutrient. With Gulf refineries offline, that input supply has simply ceased.
The price shock and shortage of fertilizer during spring planting season could reduce the planting and yields of corn in the US — the main feedstock for US beef, poultry, and dairy — and potentially increase global food prices into 2027. Wikipedia The urea benchmark is up about 30 percent in the last month. Carnegie Endowment for International Peace Fertilizer plants have paused operations in Bangladesh, schools have closed in Pakistan, and India and Japan are turning to coal wherever possible. Time
The deeper structural problem, as the Carnegie Endowment for International Peace has noted, is that G7 countries do not maintain strategic fertilizer reserves to match their oil stockpiles. Carnegie Endowment for International Peace The geopolitical architecture of critical commodity security was designed for petroleum. It was not designed for the agricultural inputs that petroleum-adjacent economies also happen to produce in abundance. That is a failure of imagination that is now measurable in calories.
Why Bypass Pipelines and Alternative Routes Are Not the Answer
The default technocratic response to any Hormuz crisis has always involved pointing to bypass infrastructure — and the bypass infrastructure has always fallen grotesquely short of requirements.
Saudi Arabia increasingly diverted oil to the Red Sea port of Yanbu via the East–West Crude Oil Pipeline, while the UAE diverted oil via the Abu Dhabi Crude Oil Pipeline to Fujairah on the Arabian Sea. Iraq has an alternative route via the Kirkuk–Ceyhan Pipeline to the Mediterranean through Turkey. The combined capacity of these pipelines is 9 million barrels per day — compared to the 20 million that ordinarily transits the strait. Wikipedia
That arithmetic is damning enough. But the picture is worse. The Red Sea route is vulnerable to potential attacks by the Houthis Wikipedia, who announced a resumption of attacks on commercial shipping contemporaneously with the Hormuz closure, forcing Suez Canal traffic to reroute around Africa’s Cape of Good Hope, adding weeks to transit times and increasing shipping costs. Wikipedia
For LNG, there is no bypass solution whatsoever. Pipeline infrastructure does not exist to redirect Qatari or Emirati gas exports to Asia in the event of Hormuz closure. The rerouting of LNG tankers around the Cape adds weeks — weeks during which Asian countries run through reserves and industrial facilities shut down. By March 22, Dun & Bradstreet’s analysis had identified 7,716 businesses that had experienced at least one shipment cancellation since February 28, with more than 44,000 businesses across 174 economies having at least one shipment exposed. Dun & Bradstreet
The seductive promise of alternatives to Strait of Hormuz oil transit has always obscured one fundamental reality: the strait was never just an oil route. It is the central node of a complex energy and commodities system that evolved, over fifty years, to run through that single chokepoint. You cannot reroute a system. You can only redesign it.
An Honest Reckoning: Why This Was Always Coming
Let me say something that the diplomatic language of think-tank reports tends to avoid: the Hormuz crisis of 2026 is a failure of political will, not a failure of intelligence.
Every credible scenario exercise run by the Brookings Institution, the Centre for Strategic and International Studies, or the Council on Foreign Relations in the past twenty years identified Hormuz as the single largest structural vulnerability in global energy security. Every IEA annual report since the early 2000s flagged the concentration of oil transit through a single choke point controlled by a potentially hostile state. Every geopolitical stress test modelled this exact scenario — an Iran-US confrontation triggering a de facto closure — and generated results that looked very much like the data we are reading today.
The world was warned. Repeatedly. In precise technical language by credentialed institutions with significant policy access. And the world — its energy ministries, its central banks, its insurance markets, its shipping consortia — collectively decided that the costs of reducing Hormuz dependency were higher than the probability-weighted costs of a crisis.
That calculation was wrong. And it was wrong not because the probability was misjudged, but because the magnitude of the crisis was systematically underestimated. The assumption was that Hormuz disruptions would be brief, partial, and primarily confined to oil prices. No model adequately captured the simultaneous fertilizer shock, the LNG supply collapse, the insurance market withdrawal, the compounding Red Sea disruption, or the cascading food security crisis across three continents. The system turned out to be dramatically more interconnected than the models assumed.
In conversations with more than three dozen oil and gas traders, executives, brokers, shippers, and advisers, one message was repeated over and over: the world still hasn’t grasped the severity of the situation. Bloomberg That, perhaps, is the most chilling line to emerge from this crisis. If the energy professionals closest to the system believe its severity is still underestimated, then every policy response calibrated to “managing” rather than “redesigning” the global energy architecture is starting from the wrong premise.
The Way Forward After the Hormuz Crisis: Energy Security That Doesn’t Rely on a Single Lane
1. A Hormuz Transit Initiative: Multilateral Legal Architecture for Chokepoints
The most immediate need is political, not technical. The Black Sea Grain Initiative offers a lesson: even in the midst of war, diplomacy can still make room for necessity. Time What is needed is a standing international legal regime — call it a Hormuz Transit Initiative — that establishes permanent protocols for the safe passage of food, fertilizers, and energy commodities through internationally critical straits, backed by multilateral guarantees and enforceable under UNCLOS.
Iran’s closure of the strait constitutes a violation of the UN Convention on the Law of the Sea by denying transit passage through a strait used for international navigation. Wikipedia The international community’s failure to enforce that principle in real time reflects the absence of a pre-negotiated institutional mechanism. A Hormuz Transit Initiative would not require the resolution of the US-Iran conflict. It would require only the recognition of a shared global interest in preventing cascading humanitarian crises — an interest that, as the International Crisis Group has argued, is real even for adversarial states.
2. Diversified Strategic Reserve Coordination: Extending SPR Logic to LNG and Fertilizers
The strategic petroleum reserve system, coordinated through the IEA, is the only institutional mechanism that has provided any meaningful buffer to this crisis — and its limitations have been nakedly exposed. G7 countries maintain no strategic fertilizer reserves to match their oil stockpiles. Carnegie Endowment for International Peace There are no internationally coordinated LNG strategic reserves.
This must change. The IEA framework should be extended, urgently, to encompass minimum mandatory LNG storage commitments for net-importing nations, and a G20 fertilizer reserve coordination mechanism should be established before the next Northern Hemisphere planting season. These are not radical proposals; they are the application of fifty-year-old strategic reserve logic to commodities that the 21st-century economy has made equally critical.
3. Accelerated Energy Transition as Strategic Security Policy
The long-term answer to Hormuz dependency is not more pipelines. It is fewer hydrocarbons. The structural reduction of global dependence on Persian Gulf oil and gas is simultaneously the most effective climate policy and the most effective energy security policy available.
The current crisis has, ironically, made the economic case for the energy transition more compelling than any carbon price or regulatory mandate. Analysts warn that if disruptions persist, the world will have to significantly reduce its oil and gas consumption — with some in the industry warning that the energy transition will be “forced on us in a very painful way.” CNBC
Japan and South Korea — among the most Hormuz-exposed economies on earth — should treat accelerated offshore wind, advanced nuclear, and hydrogen infrastructure not as energy policy but as national security investments. The World Economic Forum’s Global Risks Report 2026 notes that geoeconomic confrontation is now a key driver of economic and industrial policy. World Economic Forum Energy transition investment is the most effective hedge against that confrontation.
4. Gulf-Asia Energy Diplomacy: New Long-Term Architecture
For Asian economies that will remain hydrocarbon-dependent for the next decade, the strategic response to 2026 must include a fundamental restructuring of their energy supply relationships. The Gulf International Forum has noted that Gulf national oil companies can leverage the current crisis to accelerate long-term supply agreements with Asian buyers now acutely aware of their vulnerability to spot market volatility. Gulf International Forum
Long-term offtake agreements, co-investment in bypass infrastructure, and the strategic diversification of supply sources — toward US LNG, Australian LNG, East African oil, and Atlantic basin producers — should now be treated as non-negotiable elements of Asian energy security planning. The era of comfortable spot market dependence on a single chokepoint region is over.
5. Petrochemical and Fertilizer Supply Chain Resilience
The crisis could enable Beijing to establish new chokepoints over near-term or more enduring petrochemical supply chains Atlantic Council — a geopolitical consequence that democracies in Asia and Europe have been slow to recognize. Western industrial policy, already pivoting toward critical mineral supply chain resilience, must now explicitly encompass petrochemical feedstocks, fertilizer inputs, and LNG.
The US Inflation Reduction Act and the EU’s Critical Raw Materials Act were steps in the right direction. A Hormuz-aware industrial policy would extend this logic to the full spectrum of commodities that transit this chokepoint — and invest accordingly in domestic production capacity, allied-nation supply agreements, and stockpiling.
What This Crisis Has Already Changed — Permanently
It would be a mistake to treat the 2026 Hormuz crisis as an event from which the world simply recovers and returns to a previous equilibrium. That equilibrium is gone.
Insurance markets have permanently repriced Gulf transit risk. Shipping companies have begun investing in Cape of Good Hope routing infrastructure. Asian governments have initiated emergency reviews of their Hormuz exposure, and some — Japan and South Korea most urgently — are accelerating alternative energy investments that would previously have faced years of political resistance.
As of April 2026, there are ongoing concerns about energy security as well as food security related to fertiliser shortages and costs. Wikipedia These concerns will not resolve when the Strait reopens. They will persist — and they should persist — as the animating force behind an overdue restructuring of global energy architecture.
The crisis has also, finally, forced a honest public accounting of the degree to which the global food system runs on Gulf hydrocarbons. The fertilizer supply chain, the nitrogen cycle, the spring planting season in the Northern Hemisphere — all of these depend, in ways most consumers have never been asked to understand, on smooth passage through a twenty-one-mile bottleneck controlled by a nation currently at war.
That is not a sustainable arrangement. It was never a sustainable arrangement. The difference between 2006 and 2026 is that the consequences of sustaining it are no longer hypothetical.
Conclusion: The Strait Has Spoken — Now Policymakers Must Act
The Strait of Hormuz has always been more than a shipping lane. It is a test — a recurring, high-stakes examination of whether the international community has the strategic foresight and political will to manage its own dependencies.
For fifty years, the world has failed that test by passing it narrowly enough to avoid catastrophe. The disruptions of 2011, 2012, 2019, and 2020 were warnings. Each time, the system held — barely — and the warnings were filed under “risk management” rather than “structural reform.”
The 2026 crisis may be different. Not because the immediate shock is unique — it was always predictable — but because the second and third-order consequences are now visible in ways that are genuinely unprecedented. Fertilizer shortages during planting season. LNG rationing in Pakistan and Bangladesh. South Korean factories cutting production by half. European gas prices doubling into spring. A possible $200 barrel of oil that would constitute the largest single economic disruption since the 2008 financial crisis.
The main message from the energy industry insiders closest to the crisis is that the world will get the energy transition forced on it in a very painful way that will happen very quickly. Bloomberg That is not, ultimately, an oil trader’s message. It is a policymaker’s instruction.
The way forward is not to reopen the Strait and return to the comfortable dependency that created this crisis. The way forward is to use this rupture — this painful, expensive, globally disruptive moment — to build a global energy architecture that no longer has a single point of failure.
Twenty-one miles of water should not hold the world to ransom. The fact that it does, in 2026, is a policy choice. And policy choices can be unmade.
Discover more from The Economy
Subscribe to get the latest posts sent to your email.



Treasury Secretary Scott Bessent has doubled the size of Treasury debt buybacks — to at least $4 billion per operation starting September 9, 2026 — in an effort to push down long-term yields that hit a roughly 19-year high, with 30-year mortgage rates tracking near 6.75% as a result.
What Bessent Just Did
On August 19, 2026, the U.S. Treasury Department announced it would “at least double” the size of its buybacks of 10- to 30-year government debt, starting September 9, in an effort to relieve pressure on longer-dated yields, according to Treasury’s own announcement as reported by CNBC. The prior ceiling was $2 billion per operation; Bessent has said the new figure could run above $4 billion per issue, depending on market conditions.
Why Now: A Bond Market Under Real Stress
The move followed a punishing stretch for long-dated Treasurys. National debt crossed $40 trillion for the first time this month, and the 30-year yield touched its highest level in roughly 19 years — a period predating the 2008 financial crisis. Since the outbreak of the Iran war earlier in 2026, the 10-year yield has climbed nearly 70 basis points, pushing 30-year mortgage rates to around 6.75%, according to market analysts.
Bessent, appearing on CNBC, was candid about the intent: the intervention is partly about signaling that the administration believes current yields don’t reflect underlying fundamentals, and that the Treasury has a “big toolkit” to deploy if needed.
Did It Work? A Mixed and Fading Result
The initial announcement briefly worked. The 10-year note fell to 4.647% and the 30-year fell to 5.196% the day of the announcement, based on CNBC’s market coverage. But the relief didn’t hold — by the next session, yields had erased those declines and moved higher than before Treasury’s intervention, with the 30-year touching as high as 5.27%. Some fixed-income strategists were blunt about the limits of the tool: one Evercore ISI strategist dismissed the plan as a weak version of the Fed’s old “Operation Twist,” warning it risks backfiring if markets read it as panic rather than confidence.
There’s also a funding mechanics wrinkle worth understanding: Treasury doesn’t print money the way the Fed can. To fund the buybacks, it likely has to issue more short-term bills — effectively swapping long-dated debt for short-dated debt, which reshapes the yield curve rather than reducing total debt outstanding, per reporting on the funding mechanism.
Key Yield Levels to Track
| Instrument | Level (week of Aug. 17–21, 2026) | Relevance |
|---|---|---|
| 30-year Treasury | ~5.20%–5.27% | Long-end mortgage pricing benchmark |
| 10-year Treasury | ~4.65%–4.70% | Primary mortgage-rate benchmark |
| 2-year Treasury | ~4.18% | Tracks Fed policy expectations |
| 30-year fixed mortgage | ~6.75% | Direct consumer borrowing cost |
| National debt | $40 trillion+ | Structural backdrop for yield pressure |
What This Means If You’re Shopping a Mortgage or Refinance
The 10-year Treasury yield is the benchmark lenders price fixed mortgages off of, so Bessent’s intervention matters directly to anyone house-hunting or considering a refinance. The takeaway isn’t that rates are about to collapse — analysts broadly agree buybacks can smooth volatility but don’t resolve the deficit and inflation pressures driving yields higher. If you’re already carrying a mortgage originated when 30-year rates were meaningfully higher, it’s worth periodically re-running the math on refinancing, factoring in closing costs against the monthly savings at today’s roughly 6.75% benchmark. If you’re borrowing for the first time, locking a rate during a Treasury-driven dip (like the brief one on August 19) versus waiting is a real trade-off worth discussing with a mortgage broker who can show live rate locks rather than yesterday’s headline number.
Strategic Outlook
- Don’t expect a durable rate collapse from buybacks alone — the relief has already partly reversed within 24 hours in past instances.
- Watch the 10-year, not the Fed funds rate, for mortgage-pricing signals.
- If refinancing, compare quotes across multiple lenders now rather than waiting for a “perfect” rate environment that may not arrive.
- Bond investors should note that Treasury’s buyback-funded-by-bill-issuance approach could keep short-term rates elevated even as it dampens long-end volatility.
This is not financial advice. Treasury market dynamics are complex and rapidly shifting; consult a licensed financial advisor or mortgage professional before making borrowing or investment decisions.
Discover more from The Economy
Subscribe to get the latest posts sent to your email.

After years of explosive gains, AI and machine learning stocks have entered a more complicated phase — still central to the Dow Jones Industrial Average’s overall performance, but facing sharper questions about valuation, earnings durability, and whether the easy gains have already been captured. For investors trying to decide whether to keep adding to AI positions, trim exposure, or rotate into other sectors, 2026 requires a more nuanced read than the straightforward “buy the dip” narrative that worked reliably in prior years.
This analysis breaks down where AI and machine learning stocks currently stand within the broader Dow Jones and market context, what’s driving continued institutional investment despite valuation concerns, and how to think about position sizing if you’re building or maintaining exposure to this sector in your portfolio. Whether you’re a long-term investor or actively trading around AI-sector volatility, understanding the current landscape matters more than chasing last year’s returns.
Where AI Stocks Stand in the Dow Jones Right Now
AI-adjacent companies — spanning semiconductor manufacturers, cloud infrastructure providers, and enterprise software firms embedding AI capabilities — continue to represent an outsized share of overall market cap growth relative to their weighting in the index. This concentration has been a persistent feature of the market for several years now, and it means Dow Jones performance remains more tied to AI-sector sentiment than the historical diversification of the index would suggest.
What’s changed in 2026 is the market’s patience with growth-at-any-valuation stories. Earnings calls that once got a pass on questions about AI monetization timelines are now facing sharper analyst scrutiny, and companies unable to demonstrate a clear path from AI investment to revenue growth have seen more punishing reactions to earnings misses than in prior years.
The Bull Case for AI and ML Stocks in 2026
Despite valuation concerns, several structural tailwinds continue supporting the bull case for AI-sector investment. Enterprise AI adoption is still in relatively early innings for many industries — healthcare, logistics, and financial services in particular are still ramping infrastructure spending rather than winding it down. Capital expenditure guidance from major cloud and semiconductor companies has largely remained robust, suggesting the largest players still see multi-year runway for AI infrastructure investment rather than a near-term plateau.
Key Bullish Factors
- Continued enterprise adoption – Many industries remain in early-to-mid stages of AI integration, suggesting sustained demand
- Infrastructure capex guidance – Major cloud providers have maintained or increased AI infrastructure spending forecasts
- Margin expansion in software – AI-embedded enterprise software companies are showing improved margins as adoption scales
- International expansion – AI infrastructure investment is accelerating outside the US, broadening the addressable market
- Ongoing chip demand – Semiconductor demand tied to AI training and inference workloads remains structurally elevated
The Bear Case: Why Some Investors Are Cautious
The counterargument centers on valuation multiples that, even after some 2025-2026 volatility, remain elevated relative to historical norms for the broader market. Concerns persist about circular investment relationships between major AI infrastructure players, where the same handful of companies are simultaneously customers and investors in one another’s growth — a dynamic some analysts argue inflates reported demand signals. There’s also a legitimate question about how quickly AI capital expenditure will translate into durable free cash flow versus remaining a perpetually reinvested growth story.
Key Bearish Factors
- Elevated valuations – Price-to-earnings and price-to-sales multiples remain historically high for many AI-adjacent names
- Circular investment concerns – Interlocking investment relationships among major AI infrastructure players raise demand-durability questions
- Interest rate sensitivity – Growth stock valuations remain more sensitive to rate policy shifts than value-oriented sectors
- Monetization timeline uncertainty – Gap between AI infrastructure spend and proven enterprise ROI remains a persistent analyst concern
- Increased regulatory scrutiny – Antitrust and AI-specific regulatory attention has increased globally, adding a layer of policy risk
Sector Comparison: AI/ML Stocks vs. Broader Dow Jones Composition
| Factor | AI/ML Sector Stocks | Broader Dow Jones Average |
|---|---|---|
| Average valuation multiple | Elevated relative to historical norms | Closer to long-term historical average |
| Earnings growth expectations | High, but under increasing scrutiny | Moderate, more stable |
| Volatility | Higher | Lower |
| Capital expenditure trend | Aggressive, ongoing | Mixed by sector |
| Regulatory exposure | Increasing | Sector-dependent |
| Institutional sentiment | Cautiously bullish with rotation risk | Stable |
How to Think About Position Sizing in 2026
Given the more nuanced risk/reward picture, a disciplined approach matters more than it has in prior AI-sector bull runs. Consider these principles when managing exposure:
- Avoid overconcentration in a small handful of mega-cap AI names, even if they’ve driven most of your recent returns
- Diversify across the AI value chain — infrastructure, chips, and application-layer software carry different risk profiles
- Pay closer attention to free cash flow trends, not just revenue growth, as monetization scrutiny increases
- Consider dollar-cost averaging into positions rather than making large single entries given elevated volatility
- Reassess position sizing relative to your overall portfolio risk tolerance, not just recent sector momentum
Watching for Rotation Signals
Beyond the bull and bear fundamentals, it’s worth paying attention to sector rotation signals that often precede broader market sentiment shifts around AI valuations. Institutional fund flow data, options market positioning, and relative performance between AI-heavy growth indices and value-oriented sectors can all offer early signals of shifting sentiment before it fully shows up in individual stock prices. Historically, sharp AI-sector pullbacks have often been triggered less by fundamental deterioration and more by a specific catalyst — a disappointing earnings guidance from a bellwether company, a macro rate shock, or a high-profile regulatory action — that causes previously patient investors to reassess valuation assumptions all at once. Staying attentive to these catalysts, rather than assuming steady-state conditions will persist indefinitely, is part of maintaining a disciplined approach to sector exposure in a still-evolving investment theme.
Frequently Asked Questions
Should I sell my AI stocks if I think the sector is overvalued?
That depends entirely on your investment horizon and risk tolerance rather than a one-size-fits-all answer. Long-term investors with a diversified portfolio may choose to simply trim overconcentrated positions rather than exit entirely, while investors more sensitive to near-term volatility might reduce exposure more aggressively. This isn’t personalized financial advice, and consulting a financial advisor about your specific situation is worth considering before making significant portfolio changes.
How can I tell if an AI company’s revenue growth is sustainable versus inflated by circular investment deals?
Look closely at the customer concentration disclosed in earnings reports and investor filings — if a large share of a company’s reported revenue comes from a small number of other AI infrastructure companies rather than a broad, diversified customer base, that’s worth factoring into your assessment of demand durability.
Are AI stocks more volatile than the broader Dow Jones average?
Generally yes, particularly for higher-growth, less-established names within the sector. More established, cash-flow-positive AI-adjacent companies within the Dow Jones tend to show somewhat lower volatility than smaller, growth-stage AI-focused companies outside the index.
Is it too late to start investing in AI stocks in 2026?
Many analysts view the sector as being in a more mature, selective phase rather than an early-stage opportunity, which changes the risk/reward calculus compared to earlier years but doesn’t necessarily mean the opportunity has fully passed. Position sizing, diversification, and a longer time horizon matter more now than simply timing an entry point.
Final Thoughts
AI and machine learning stocks remain a legitimate long-term investment theme in 2026, but the easy, broad-based gains of previous years have given way to a market that’s demanding more evidence of durable monetization before rewarding further multiple expansion. This doesn’t necessarily mean it’s time to exit the sector — but it does mean position sizing, diversification within the AI value chain, and closer attention to fundamentals matter more now than they did in the earlier stages of the AI investment cycle.
Are you still adding to your AI stock positions in 2026, or have you started rotating into other sectors given the valuation concerns? Share your investment approach in the comments.
Discover more from The Economy
Subscribe to get the latest posts sent to your email.

Subscription fatigue is real, and with both Amazon Prime and Walmart+ now priced close together, the question isn’t just “which has faster shipping” anymore — it’s which membership delivers more actual financial value once you account for every perk, discount, and hidden cost. Both programs have expanded well beyond free shipping into fuel discounts, streaming bundles, prescription savings, and cashback-style perks, making a direct comparison more complicated — and more important — than it used to be.
This breakdown compares Amazon Prime and Walmart+ specifically through a financial lens: what each membership actually costs after accounting for real usage, which perks translate into measurable savings, and which one makes more sense depending on your shopping habits. If you’re deciding between the two, or wondering whether you need both, this is the comparison that matters.
Base Membership Cost and What You’re Actually Paying For
Both memberships sit in a similar annual price range, but the value proposition diverges quickly once you look past shipping. Amazon Prime bundles in Prime Video, Prime Music, Prime Reading, and periodic exclusive shopping events like Prime Day, positioning itself as much as an entertainment subscription as a shopping perk. Walmart+ leans harder into everyday savings — fuel discounts at Walmart and Murphy USA/Sam’s Club stations, member prescription pricing, and early access to deals — positioning itself more explicitly as a cost-of-living savings tool than an entertainment bundle.
This distinction matters more than it might first appear: if you don’t watch Prime Video or use Amazon’s other entertainment perks, you’re effectively paying for value you never redeem, which changes the real cost-per-benefit calculation significantly in Walmart+’s favor for budget-focused shoppers.
Where Amazon Prime Wins Financially
Prime’s biggest financial edge comes from its sheer breadth — free shipping across a massive product catalog, frequent lightning deals, Prime Day and Black Friday exclusive pricing, and a genuinely valuable entertainment bundle that would cost more if purchased separately as standalone streaming subscriptions. For households that already shop heavily on Amazon and use its content ecosystem, the membership often pays for itself several times over.
Prime’s Strongest Financial Perks
- Prime Video and Music bundled in – Comparable standalone streaming subscriptions would cost more separately
- Prime Day and exclusive member deals – Some of the steepest discounts of the year are member-exclusive
- Same-day and next-day shipping on huge product selection – Reduces impulse in-store spending and time cost
- Amazon Fresh/Whole Foods discounts – Additional grocery savings layered on top of the core membership
- Prime Reading and Kindle deals – Added value for frequent readers, though a smaller factor for most households
Where Walmart+ Wins Financially
Walmart+’s value proposition is more directly tied to recurring, practical household spending — fuel savings that compound with regular driving, member pricing on prescriptions that can meaningfully offset healthcare costs, and free delivery from Walmart stores that competes directly with grocery delivery services that otherwise charge separately. For budget-conscious households prioritizing everyday cost reduction over entertainment bundling, Walmart+ often delivers a higher effective return relative to its membership cost.
Walmart+’s Strongest Financial Perks
- Fuel discounts at partner gas stations – Per-gallon savings that compound significantly for frequent drivers
- Free grocery delivery from Walmart stores – Comparable third-party grocery delivery often charges separate membership and delivery fees
- Member prescription pricing – Meaningful savings for households managing regular prescription costs
- Early access to deals and Walmart+ Week – Comparable to Prime Day but with a stronger everyday-essentials focus
- Included Walmart+ Assist option – Discounted membership rate for qualifying government assistance program participants
Side-by-Side Financial Comparison
| Perk Category | Amazon Prime | Walmart+ |
|---|---|---|
| Free shipping/delivery | Yes, vast catalog | Yes, Walmart stores + select delivery |
| Entertainment bundle | Extensive (Video, Music, Reading) | None |
| Fuel discounts | No | Yes |
| Prescription savings | Limited | Yes, member pricing |
| Grocery delivery | Amazon Fresh/Whole Foods | Walmart stores |
| Best for | Entertainment + broad shopping households | Everyday essentials + driving households |
| Approximate annual cost | Comparable to Walmart+ | Comparable to Prime |
How to Decide Which One Actually Saves You Money
- Calculate your realistic entertainment usage – If you’d otherwise pay for Prime Video separately, that alone can justify Prime’s cost
- Estimate your annual fuel spending – Frequent drivers often see Walmart+’s fuel discount outweigh Prime’s shipping perks
- Factor in prescription costs – Households with regular prescriptions may find Walmart+’s savings compound significantly over a year
- Consider where you already shop most – Membership perks only generate savings if they match your existing spending habits, not your aspirational ones
- Don’t rule out having both temporarily – Many households run both during peak sales events (Prime Day and Walmart+ Week) and cancel one afterward
Tracking Your Actual Usage Before Renewal
The most reliable way to determine which membership is worth keeping is to actually track your usage over a full billing cycle rather than relying on assumptions about your habits. Keep a simple running log for a month of every delivery, streaming session, fuel fill-up, or discount you used through each membership, then estimate what those same purchases or services would have cost without the membership. This exercise routinely reveals that households overestimate how much they use certain perks — streaming content they rarely watch, or delivery services they use less than they think — while underestimating others, like fuel savings that compound quietly over dozens of fill-ups a year. Doing this once before your next renewal date gives you an actual data-driven answer rather than a guess based on how valuable the membership felt when you first signed up.
Frequently Asked Questions
Can I get a free trial for either membership before committing?
Both programs have historically offered free trial periods, though exact lengths and availability change periodically and aren’t guaranteed to be offered indefinitely. Checking each program’s current sign-up page for an active trial offer before committing to a full annual membership is worth the two minutes it takes.
Is it worth paying for both memberships at once?
For some households, yes — particularly around major sales events like Prime Day and Walmart+ Week, when the potential savings from each platform’s exclusive deals can outweigh the cost of a short-term membership. Many people sign up for one during its peak sales event, capture the savings, then cancel before the next billing cycle if ongoing dual membership doesn’t otherwise pencil out.
Do student or family discounts apply to either membership?
Both programs have offered discounted rates for qualifying groups at various points, including student pricing and family or multi-account sharing options. Terms and eligibility change, so checking current program pages rather than relying on outdated information is important before assuming a discount applies to your situation.
Which membership is better if I mostly shop online rather than in physical stores? Amazon Prime generally has the edge for pure online shopping breadth given its larger third-party marketplace and product catalog, while Walmart+ perks are more closely tied to in-store and Walmart-specific online purchases. If your shopping is heavily concentrated on Amazon already, Prime’s broader catalog advantage becomes more relevant to your specific savings calculation.
Final Thoughts
There’s no universal winner between Amazon Prime and Walmart+ — the better financial choice depends entirely on whether your household spending leans toward broad online shopping and entertainment, or everyday essentials like fuel, groceries, and prescriptions. Run the actual numbers based on your last few months of spending in each category before committing to a full year of either membership, and don’t assume last year’s decision is still the right one as both programs continue adding and adjusting perks.
Which membership has actually saved you more money this year — Prime or Walmart+? Or are you running both? Share your real numbers in the comments.
Discover more from The Economy
Subscribe to get the latest posts sent to your email.

Bessent’s Debt Buybacks Explained: Impact on Your Mortgage

SEC Crypto Regulations 2026: What They Mean for Your Bitcoin Wallet

USPS vs FedEx Tracking 2026: How to Cut E-commerce Shipping Costs

Dow Jones Analysis 2026: Are AI and Machine Learning Stocks Still a Buy?

Amazon Prime vs Walmart+: Which Membership Saves You More in 2026?

Canva vs Adobe: Best Design Software for E-commerce Brands in 2026

Capital One vs Wells Fargo: Best Credit Card for Buying Crypto in 2026

The 2026 Guide to Staking ADA and BNB: How to Earn Passive Crypto Income on the Best Platforms

BigLaw Backlash 2026: Why Top US Firms Are Being Slammed for “Crazy” 1L Hiring

SpaceX Falcon 9 Upper Stage Crashes Into Moon, Creating New Crater Near Einstein

7-Eleven, GameStop, and Grocery Outlet Slash Hundreds of Stores in 2026 Restructuring Wave

Toyota Recalls 508,000 Camrys Over Blank Dashboard Screens That Disable Turn Signals

State Farm Mails Record $5 Billion Dividend to Auto Policyholders: How to Claim Your Check

Indonesia’s Rupiah and FDI Confidence Gap Widens Despite Headline Growth

China Politburo July 2026: Stimulus Signals Explained

Russia Fuel Shortages 2026: Inside a Cracking War Economy

Top 15 Financial Stocks for Investment in PSX

Pakistan Passed Its Third IMF Review

SpaceX Stock Lockup Expiration Explained: Why $123B in Shares Could Hit the Market

Andy Burnham, UK Gilts and Mortgages: July 2026 Explainer

Pakistan IMF Program 2026: Inside the Push Toward an Interest-Free Economy

Russia Oil Revenue 2026: How Sanctions on Rosneft and Lukoil Are Draining the War Chest

Pakistan’s 2026 Monsoon Floods Threaten Fragile Economic Recovery as Inflation Nears 9%

Russia Oil Revenue 2026: The Iran War Windfall and What a Hormuz Deal Means for Moscow

Russia’s Budget Deficit Blew Past Its Full-Year Target in Three Months

Canada US Trade War 2026: Inside Carney’s Push to Cut Ties With Trump’s Tariffs

China Economy 2026: How AI Exports and a Property Crash Are Splitting Growth in Two

Oil Prices Fall as Strait of Hormuz Reopens: 2026 Update
-

 Markets & Finance8 months ago
Top 15 Stocks for Investment in 2026 in PSX: Your Complete Guide to Pakistan’s Best Investment Opportunities
-

 Analysis6 months ago
Johor’s Investment Boom: The Hidden Costs Behind Malaysia’s Most Ambitious Economic Surge
-

 Analysis6 months ago
Top 10 Stocks for Investment in PSX for Quick Returns in 2026
-

 Analysis7 months ago
Brazil’s Rare Earth Race: US, EU, and China Compete for Critical Minerals as Tensions Rise
-

 Banks7 months ago
Best Investments in Pakistan 2026: Top 10 Low-Price Shares and Long-Term Picks for the PSX
-

 Investment7 months ago
Top 10 Mutual Fund Managers in Pakistan for Investment in 2026: A Comprehensive Guide for Optimal Returns
-

 Global Economy8 months ago
15 Most Lucrative Sectors for Investment in Pakistan: A 2025 Data-Driven Analysis
-

 Global Economy8 months ago
Pakistan’s Export Goldmine: 10 Game-Changing Markets Where Pakistani Businesses Are Winning Big in 2025