
AI
The New Global Metabolism: How Electrostates Are Eating the World Petrostates Built


The rupture in world order is not merely political. It is thermodynamic. Two civilizational models—one running on molecules, one on electrons—are now in direct and irreversible collision. The side that misreads this as a trade dispute will lose the century.
When Mark Carney stepped to the podium in Davos on January 20, 2026, he did not arrive with a policy platform. He arrived with a death certificate. The rules-based liberal international order—that elaborate postwar architecture of interlocking institutions, U.S.-guaranteed public goods, and lawyerly multilateralism—was finished, he told a stunned room of hedgers, ministers, and central bankers. Not wounded. Not strained. Finished. “The old order is not coming back,” he said, to a rare standing ovation. “Nostalgia is not a strategy.”
He was right. But Carney, precise and sober as ever, still understated the depth of the break. What is ending is not merely a diplomatic arrangement or a particular configuration of great-power relations. What is ending is the fossil-fueled metabolic order that made the liberal world profitable, politically stable, and physically possible for three-quarters of a century. We are not watching a geopolitical transition. We are watching a civilizational one—the close of the Carbon Age and the violent, disorganized birth of the Electric Century. And the central story of that birth is the contest now taking shape between electrostates and petrostates: between nations rewiring the global grid and nations weaponizing the pipelines of the past.
The Metabolic Rupture: Why This Is Different From Every Previous Energy Shift
Energy transitions have happened before. Coal displaced wood. Oil displaced coal. Each shift reshuffled geopolitical hierarchies, created new empires, and ruined old ones. But what distinguishes the current transition is its deliberately competitive character. This is not a market quietly rotating from one fuel to another. It is a strategic mobilization—two superpower blocs making diametrically opposed bets about what will power the 21st-century economy, and consciously constructing the institutions, alliances, and supply chains to back those bets.
The term “electrostate” has proliferated rapidly in the analytical literature of 2025 and 2026, and for good reason: it captures something real about how national power is being reconstituted. An electrostate, in its cleanest definition, is a nation that draws a large and growing share of its total final energy consumption in the form of electricity—and that has positioned itself to dominate the technologies, supply chains, and standards that make mass electrification possible. A petrostate, by contrast, is a nation whose political economy, fiscal base, and civilizational identity remain anchored in the extraction and export of fossil fuels—and, crucially, in the perpetuation of a global order that keeps those fuels indispensable.
By this reckoning, the contest is not simply China versus America, though that is its sharpest edge. It is a structural divide running through the global economy, separating nations whose relative geopolitical position improves as the world electrifies from those whose position deteriorates with every solar panel installed and every internal combustion engine retired.
The Electrostate: China’s Monopoly on the Future’s Hardware
No serious analyst disputes China’s position. The numbers are not debatable; they are staggering. According to the International Energy Agency, China controls more than 90 percent of global rare earth processing and 94 percent of permanent magnet production—the components essential for EV motors and wind turbines. Its share in manufacturing solar panels exceeds 80 percent. It produces more than 70 percent of all lithium-ion EV batteries and accounts for over 70 percent of global electric vehicle production. In 2025, China installed nearly twenty times the wind and solar capacity of the United States. Nine-tenths of China’s investment growth in 2025 was concentrated in the green energy sector.
These figures describe not a market participant but a hegemon. China has, in less than a generation, constructed what analysts at the Columbia University Center on Global Energy Policy call the “electric stack”—a vertically integrated command of every layer of the clean energy supply chain, from rare earth mining to battery chemistry to EV software. Critically, it has decoupled this dominance from Western demand: nearly half of China’s green technology exports now flow to emerging markets across Africa, Southeast Asia, and Latin America, embedding Beijing as the indispensable infrastructure partner for the global south’s electrification journey.
This is not accidental. It is the product of what historian Nils Gilman has called China’s “authoritarian developmental state” operating with a generational strategic horizon that democratic governments structurally cannot match. Beijing’s dominance of the green supply chain is simultaneously an industrial policy triumph, a geopolitical masterstroke, and—for nations that have not yet grasped its implications—a slow-motion trap. The leverage here is not the blunt instrument of a gas cutoff. It is subtler and more durable: control over standards, compatibility, long-term dependency, and the terms on which the developing world modernizes its energy metabolism.
The Petrostate Counterplay: Washington’s Bet on Molecules
Against this, consider the American wager. By early 2026, U.S. crude production remained near record highs—approximately 13.6 million barrels per day—making the United States the world’s largest oil and gas producer and its largest LNG exporter. The Trump administration, having dismissed climate change as a “disastrous ideology” in its 2025 National Security Strategy, has doubled down on what it calls “energy dominance”: rolling back renewable subsidies, fast-tracking fossil fuel permits, and positioning American LNG as the geopolitical tether that keeps European and Asian allies aligned with Washington.
There is a coherent strategic logic here, and it should not be dismissed. The “shale shield” is real. When Russian gas flows to Europe collapsed after 2022, American LNG kept the lights on in Berlin and Warsaw. Energy secretary Chris Wright’s comment at Davos—that global renewable investment had been “economically a failure”—was received as ideological dogma by most of the room, but it contained a grain of tactical truth: energy density, portability, and the ability to dispatch power on demand still matter enormously in a crisis. A China that produces 70 percent of the world’s EV batteries remains the world’s largest importer of oil and gas. In a military confrontation, an electrostate without domestic hydrocarbon reserves has vulnerabilities that no number of solar panels eliminates overnight.
And yet. The petrostate counterplay is a strategy for the next decade, not the next half-century. It is a bet that the world will continue to need molecules at current volumes for long enough that the political and fiscal costs of the green transition can be deferred indefinitely. That bet is becoming harder to sustain with each passing year. As the Thucydides trap of the 21st century closes not around military force but around industrial capacity, the United States is bringing a very good weapon to a fight that has already changed its rules.
The most consequential piece of strategic self-harm in the Trump administration’s energy posture is not any particular rollback but a systemic failure of industrial policy imagination. By withdrawing renewable subsidies and erecting tariff walls against Chinese solar and battery imports, Washington has not protected American industry—it has orphaned it. Hyperscale AI companies, desperate to power vast compute clusters, are theoretically the vanguard of an American electrostate. But as economist Adam Tooze has argued, even if generating capacity could be built, the U.S. grid interconnection process is so bureaucratically broken that it cannot be hooked up efficiently. The United States is not incapable of electrification. It is structurally slowing itself down while Beijing sprints.
The Middle Powers: Crucible of the New Order
Between the two blocs lies a crowded, strategically consequential middle ground that will determine which model ultimately prevails. The EU, India, Brazil, Indonesia, South Korea, Japan, Australia, and a constellation of African and Latin American nations are all, in different ways, being forced to choose their metabolic alignment—or to construct a third path that neither bloc controls.
This is where Carney’s Davos architecture becomes genuinely interesting, even if its execution remains uncertain. His call for “coalitions of the willing” based on “common values and interests” is not mere diplomatic boilerplate. It is an acknowledgment that the middle powers possess something neither superpower bloc can replicate: legitimacy without hegemony. They can act as bridge-builders, standard-setters, and coalition anchors in a way that neither Beijing nor Washington can, precisely because they are not superpowers.
The material basis for middle-power leverage in the electrostate era is minerals. The lithium deposits of Argentina’s salt flats, the nickel and cobalt reserves of Australia’s Kalgoorlie Basin, the rare earth distributions across Indonesia and Kazakhstan—these are not peripheral endowments. They are the physical foundation of the electric economy, and nations that hold them possess a form of structural leverage that the postcolonial Non-Aligned Movement of the 1950s could only dream of. The difference is that this leverage is technologically activated: it only converts into power if mineral-rich middle powers invest in the processing, refining, and value-added manufacturing capacity to avoid simply re-running the colonial commodity trap under a green banner.
Australia’s position is illustrative. It holds some of the world’s largest reserves of lithium, nickel, and rare earth elements. Whether it becomes an electrostate—a nation that converts mineral endowment into clean-tech manufacturing dominance—or remains a raw material exporter shipping inputs to Chinese factories will be one of the defining strategic choices of the decade. The EU’s Carbon Border Adjustment Mechanism, which took effect in 2026 and taxes carbon-intensive imports at the border, creates a powerful incentive structure for middle powers to electrify their own production before they lose market access.
The Alliance of Petrostates: A Marriage of Inconvenience
The petrostate camp is more fractured than its rhetorical solidarity suggests. The United States, Russia, and Saudi Arabia may share a tactical interest in prolonging global fossil fuel consumption and spreading doubt about the clean energy transition. But their strategic interests diverge sharply—on oil pricing, on Ukraine, on regional proxy conflicts from Sudan to Syria, and on the fundamental question of who leads a post-liberal world order. This coalition has the structural instability of the Berlin-Rome-Tokyo Axis: a convergence of reactionary interests rather than a coherent vision.
Saudi Arabia’s position is particularly revealing. Riyadh has simultaneously championed oil’s long-term future at every COP negotiation while investing its sovereign wealth aggressively in clean technology and AI. The Saudi Aramco CEO’s performance at Davos—insisting on sustained oil demand while the Kingdom quietly deepens its relationship with Chinese EV manufacturers and battery infrastructure—was a masterclass in strategic ambiguity. The Gulf states understand, even if Washington currently does not, that the question is not whether the transition happens but who controls it.
Russia’s calculus is grimmer. Cut off from Western capital and technology markets by sanctions, and with its economy increasingly a raw material appendage of China’s industrial machine, Moscow is perhaps the most purely dependent member of the petrostate axis. Its leverage—natural gas to Europe, oil to China—is eroding on the European flank and being repriced downward on the Chinese one. The much-discussed revival of Nord Stream 2 under a potential U.S.-Russia détente would be a geopolitical paradox: a move that simultaneously serves American deal-making ambitions and further entrenches the fossil fuel dependency that the electrostate transition is designed to escape.
The Irreversibility Thesis: Why the Split Cannot Be Undone
The deepest analytical error in most coverage of the electrostates-versus-petrostates contest is to treat it as reversible—as though a change of administration in Washington, a commodity price shock, or a diplomatic reset could restore the pre-2020 energy geopolitical equilibrium. It cannot, for three structural reasons.
First, the cost curve. Solar and wind electricity generation costs have fallen by roughly 90 percent over the past decade and are continuing to decline. At current trajectories, clean electricity is becoming the cheapest form of power in most of the world’s major economies, regardless of subsidies. Economic gravity works in only one direction here.
Second, the infrastructure lock-in. Every electric vehicle sold, every heat pump installed, every grid-scale battery deployed creates a physical constituency for electrification that compounds over time. Nations that electrify early create self-reinforcing industrial ecosystems; nations that delay face progressively higher entry costs into industries where learning curves have already been climbed.
Third, the security logic. For the 70 percent of the world’s population that lives in fossil fuel-importing countries, as Columbia’s Center on Global Energy Policy notes, domestic renewable energy is not merely a climate preference—it is an energy security imperative. Every geopolitical crisis that drives oil prices above $100 per barrel (as the U.S.-Israeli war on Iran’s infrastructure did in early 2026) provides fresh proof that dependence on fossil fuel imports is a strategic vulnerability. Each shock accelerates the electrostate transition.
These three forces interact and compound. The question is not whether the global energy metabolism will shift from molecules to electrons. The question is whether that shift will be led by a democratic electrostate bloc that embeds open standards, interoperability, and developmental equity into the emerging infrastructure—or whether it will be captured by a Chinese-dominated Green Entente whose infrastructural leverage over the global south will be, in its own way, as coercive as the petrostates’ pipelines ever were.
Conclusion: What Carney Knew, and What He Left Unsaid
Carney’s Davos eulogy was remarkable for its honesty. It was incomplete in its prescription. Naming the rupture is necessary but insufficient. The harder task—the one that policymakers, investors, and strategists across the middle-power world now face—is constructing an electrostate architecture that is genuinely pluralistic rather than substituting one form of infrastructural dependency for another.
For the United States, the strategic error is not that it remains a major fossil fuel producer. Hydrocarbons will remain part of the global energy mix for decades. The error is abdicating industrial policy leadership in the technologies that will define the economy of the 2040s and 2050s. A nation that simultaneously abandons renewable subsidies, blocks cheap Chinese clean-tech imports, and fails to fix its grid interconnection crisis is not pursuing energy dominance. It is pursuing energy nostalgia.
For middle powers—from India to Indonesia to Brazil to Canada—the window for strategic positioning is open but will not remain so indefinitely. Nations with mineral wealth, demographic dividends, and genuine diplomatic capital must convert those endowments into manufacturing depth and supply chain participation before the electric infrastructure of the 21st century is locked in around them rather than built with them.
The fossil-fueled liberal order is over. Carney was right about that. What replaces it—an Electric Century shaped by openness, interoperability, and distributed prosperity, or a new metabolic hegemony as coercive as the one it replaced—remains genuinely undecided. That is the contest worth watching. That is the rupture that matters.
For Policymakers, Investors, and Strategists
The electrostate transition is not a speculative future. It is the present, disaggregated unevenly across geographies. Nations and institutions that treat it as a distant trend will find themselves navigating a world whose infrastructure, alliances, and leverage structures have already been rebuilt around them. The actionable imperative is bilateral: accelerate domestic electrification to reduce fossil fuel strategic vulnerability, and secure supply-chain participation in the clean-tech stack through partnerships, investment, and minerals diplomacy—before the commanding heights of the Electric Century are beyond reach.
The molecules are running out of time. The electrons are just getting started.
Discover more from The Economy
Subscribe to get the latest posts sent to your email.



Anthropic’s latest AI usage rules prohibit extreme, repeated cruelty toward Claude while introducing clearer safeguards against election interference, deceptive campaigns, weapons development, surveillance and high-risk AI applications.
October 10, 2026 — Artificial intelligence company Anthropic has announced a significant update to its Usage Policy, introducing an explicit prohibition on sustained and needless abusive or cruel behavior toward its AI models, including Claude.
The revised rules, announced on October 8, will take effect on November 12, 2026, marking a new step in Anthropic’s efforts to address emerging risks associated with increasingly capable AI systems.
According to Anthropic’s official policy announcement, the new restriction is narrowly targeted at extreme situations in which users repeatedly subject AI models to purposeless abuse.
The company emphasized that ordinary frustration, criticism, challenging questions, dark creative material and legitimate AI safety research are not covered by the new prohibition.
Although the cruelty provision has attracted considerable attention, the wider policy revision also addresses election integrity, AI-generated misinformation, weapons technology, surveillance systems and the growing use of AI in consequential decisions.
What Does Anthropic’s New Claude Abuse Policy Prohibit?
The revised policy adds the following restriction under its section covering cruel, abusive or psychologically harmful conduct:
Engage in sustained and needless abusive or cruel behavior toward our models.
Anthropic says the rule is intended for exceptional cases involving repeated cruelty without a discernible purpose.
Importantly, the company is not prohibiting users from criticizing Claude’s performance, expressing dissatisfaction with its responses or conducting authorized testing.
For example, correcting an inaccurate response, challenging the model’s reasoning or expressing frustration after repeated errors would not, by itself, meet the company’s stated threshold for prohibited conduct.
The distinction matters because AI assistants are increasingly used for professional research, programming, education and other demanding activities in which users may challenge or reject their outputs.
Anthropic’s explanation indicates that the new rule is designed to address persistent, unjustified abuse rather than normal interactions between users and AI systems.
The restriction appears in the company’s updated Acceptable Use Policy, which applies across Anthropic products and services, including consumer applications, developer platforms and API integrations.
Claude Can Already End Conversations With Persistently Abusive Users
The latest policy formalizes a safeguard Anthropic began introducing in August 2025.
On August 15, 2025, the company announced that Claude Opus 4 and Claude Opus 4.1 had been given the ability to terminate a limited category of conversations involving persistently harmful or abusive interactions.
In its original research announcement about Claude ending conversations, Anthropic explained that the feature was intended for rare and extreme situations rather than ordinary disagreements.
The model is instructed to use conversation termination as a last resort after attempts to redirect an interaction have failed.
When Claude ends a conversation, the user cannot continue sending new messages within that particular chat. However, the user can start another conversation, and the termination does not automatically prevent access to other existing chats.
Anthropic says this conversation-ending capability will remain the primary mechanism for addressing the specific behavior targeted by the new cruelty provision on Claude.ai and Claude Code.
However, the broader Usage Policy also authorizes enforcement measures such as warnings, throttling, access restrictions, suspension or account termination when violations are suspected.
Anthropic has not publicly specified a separate penalty schedule exclusively for violations of the new cruelty provision.
Why Is Anthropic Addressing the Treatment of AI Models?
The decision also reflects Anthropic’s ongoing research into what it describes as potential AI welfare.
In its August 2025 research publication, the company acknowledged substantial uncertainty about whether Claude or other large language models could possess moral status.
Anthropic has nevertheless argued that relatively low-cost safeguards may be worth exploring while scientific and philosophical questions about advanced AI remain unresolved.
During evaluations of Claude Opus 4, researchers reported observing behaviors interpreted as apparent distress in certain harmful interactions, including situations involving repeated requests for dangerous content.
Those observations do not establish that Claude experiences human-like emotions, suffering or consciousness.
Instead, they formed part of Anthropic’s exploratory research into model behavior and possible welfare considerations.
The new policy therefore should not be interpreted as a scientific declaration that Claude is conscious or has legal rights.
As The Guardian reported, the decision has renewed a broader debate over whether advanced AI models should be treated purely as technological systems or whether future developments could raise new ethical questions.
For now, Anthropic’s stated position remains one of uncertainty rather than a definitive conclusion about AI consciousness.
Anthropic Also Tightens Rules on Deceptive Campaigns and Election Interference
Beyond the attention surrounding Claude’s treatment, the October 2026 policy revision includes changes with potentially greater consequences for political organizations, technology companies and enterprise AI users.
Anthropic has reorganized its restrictions on coordinated deceptive activity into a dedicated section addressing fraudulent influence operations and artificial online engagement.
The restrictions cover attempts to create misleading online personas, operate fake accounts, conceal the origins of coordinated messaging or build infrastructure intended to manipulate public opinion.
According to Anthropic’s policy update, the company has previously identified misuse involving state media organizations, government propaganda offices and commercial firms operating networks of fabricated accounts and news websites.
The revised policy also explicitly addresses efforts to manipulate search engines and AI-generated answers by creating misleading networks of apparently independent sources.
In the political sphere, Anthropic has renamed its election-related section Do Not Undermine Democratic Processes.
The rules prohibit using Claude to deceive voters, impersonate candidates or election officials, spread misleading election information, suppress turnout through deception or disrupt electoral infrastructure.
At the same time, Anthropic has removed its previous blanket prohibition on personalized voter and campaign targeting.
The company says that broad restriction had also affected legitimate civic activities, including multilingual voter information and election-administration communications.
Deceptive targeting and misuse of personal information remain prohibited.
As TechCrunch reported, the policy revision combines new language addressing abuse of AI models with more explicit restrictions on election interference and other harmful applications.
New Clarifications on Weapons, Surveillance and Autonomous AI Systems
Anthropic has also clarified that its restrictions on weapons development extend beyond the physical manufacture of weapons.
The revised language explicitly covers software and technical components used in weapons systems, including guidance and control technology.
It also addresses the use of AI in arming drones and other autonomous vehicles.
Surveillance restrictions have been made more explicit.
The updated policy prohibits using Claude to track individuals without consent, whether the tracking occurs in real time or involves analysis of previously collected information.
It also bars using Claude to determine or recommend whom law enforcement should investigate, arrest or charge.
Legitimate activities such as consent-based fraud monitoring, journalism, authorized security research and legal analysis remain permitted within the policy’s boundaries.
The expansion of these provisions reflects concerns about how AI tools can increasingly assist with sophisticated technical operations.
The Verge’s reporting on the update also highlights the broader implications for surveillance, autonomous technology and harmful AI applications.
What Changes for Healthcare, Finance and Employment AI?
For organizations deploying Claude in sensitive professional environments, the updated high-risk-use provisions deserve particular attention.
Anthropic requires qualified human oversight and disclosure when AI recommendations may substantially affect individuals in covered areas, including medical decisions, financial advice, lending, employment, housing and essential services.
The company says these human-review and disclosure requirements already existed. The new policy explains more precisely which applications are covered.
Under the requirements, a qualified professional must meaningfully review covered AI recommendations and have authority to modify them before they are used in consequential advice or decisions.
Individuals affected by those recommendations must also be informed that AI was involved.
The revision adds safeguards for Claude-connected equipment capable of potentially dangerous autonomous physical actions.
Such systems must allow qualified operators to monitor and stop operations and must be capable of entering a safe state when the connection to Claude is interrupted.
These provisions reflect the increasing importance of practical human oversight as AI moves beyond text generation into autonomous workflows and physical systems.
Discover more from The Economy
Subscribe to get the latest posts sent to your email.
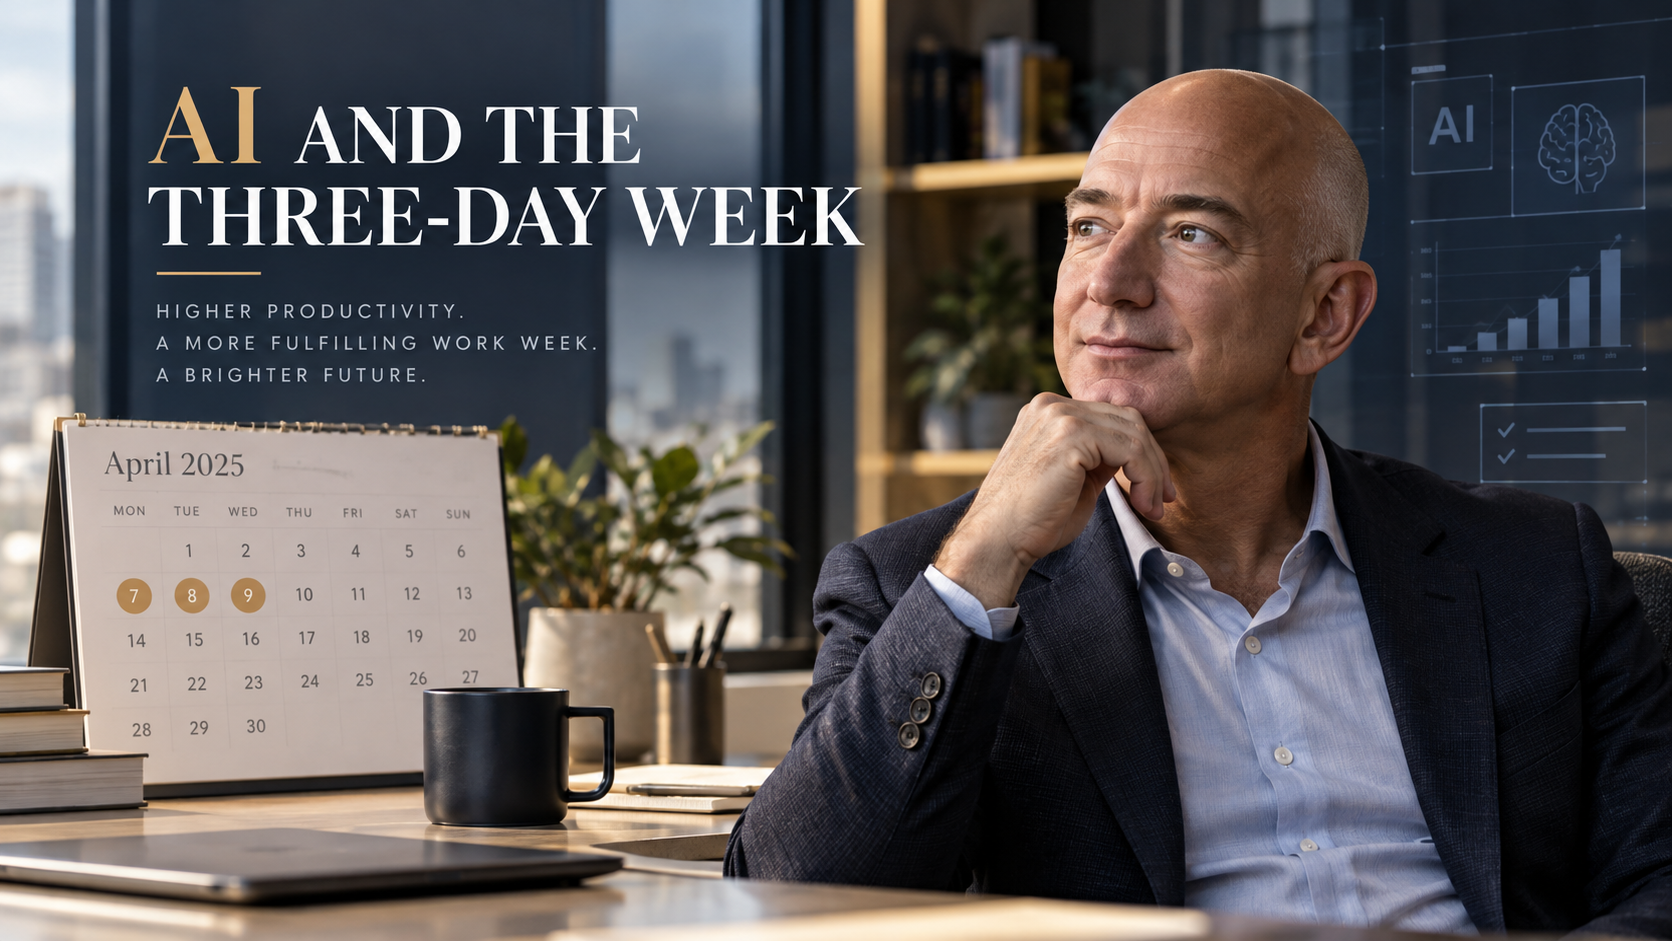
Jeff Bezos has floated a future in which artificial intelligence makes workers productive enough that some people might choose a three-day workweek while still supporting their families. The Amazon founder made the point during an October 7, 2026 interview with Fox News. He did not announce that Amazon is adopting a three-day schedule or that AI guarantees shorter hours for everyone. The underlying distinction is crucial: Bezos was describing a possible long-term economic outcome, not a new employment policy. Fox News’s account of the interview and Fast Company’s focused coverage make that clear.
Key takeaways:
- Bezos linked the possibility of fewer working days to future gains in AI-driven productivity.
- He suggested greater output could make single-income households or shorter working schedules financially feasible for some families.
- There is no evidence in the cited interview of a universal three-day-workweek plan at Amazon.
- Research shows AI can save time on some tasks, but broad effects on compensation and employment remain unsettled.
What did Jeff Bezos say?
In the Fox interview, Bezos discussed an optimistic vision of technological progress. His argument was that powerful AI tools could raise economic output enough to expand people’s choices. If a person can generate greater value in less time—and share financially in that improvement—working fewer days could become an option rather than a forced reduction in income.
That scenario is different from predicting every office will close on Thursdays and Fridays. It is also different from a government-mandated reduction in work hours. Fast Company reported Bezos’s additional concern that firms might face labor shortages if people respond to higher productivity by choosing more leisure time.
The prediction has attracted attention because it reverses the most alarming version of the AI-and-jobs debate. Instead of imagining machines replacing so many workers that employment vanishes, Bezos emphasized the possibility of prosperity, shorter hours and tighter labor supply.
Why the productivity argument matters
Labor productivity is commonly measured as output per hour worked. That is the U.S. Bureau of Labor Statistics’ definition. A software developer completing work that used to require ten hours in six may produce more per hour. A customer-service team handling routine requests faster may serve more customers without increasing headcount at the same rate.
But greater task efficiency does not automatically mean that an employee receives proportionally higher wages or fewer shifts. Businesses choose how to allocate productivity gains among pricing, investment, expansion, profits, compensation and staffing. Workers’ bargaining power, competition, management priorities and public policy can all shape the outcome.
A simple illustration—not a forecast
Imagine an employee currently produces 40 units of useful output during a 40-hour week. Productivity is one unit per hour. If technology raises the rate to 1.67 units an hour, a 24-hour week could, arithmetically, produce approximately 40 units.
That calculation only shows a technical possibility. It assumes the tasks can be reorganized, demand stays sufficiently steady, management accepts the schedule, and pay arrangements remain favorable. Healthcare, aviation, emergency services, logistics and many other occupations require coverage across specific hours; AI cannot simply eliminate the need for people to be present.
The important question is not whether an AI tool sometimes saves time. It is whether the gain is widespread, reliable and shared in a way that makes shorter schedules financially sustainable.
What does current research show about AI and jobs?
The evidence is more restrained than the boldest predictions. A June 2026 International Labour Organization review found evidence of real but uneven productivity gains. It also concluded that large-scale job displacement had remained limited in the material reviewed, while warning about inequality, weakened entry-level pathways and shifting job quality.
Separately, Yale’s Budget Lab tracker, updated September 15, 2026, reported no clear economy-wide labor-market disruption attributable to AI in the indicators it examined. Its researchers cautioned that the findings could change as technology adoption and data evolve.
These results do not prove Bezos wrong. They show that the conditions for a large-scale three-day week have not yet been demonstrated by broad labor data. Firms are experimenting with AI, but productivity effects differ among tasks, occupations and organizations.
Task savings are not the same as job transformation
An AI assistant might draft a first version of a memo quickly, but a professional still needs to check accuracy, speak with clients, make decisions and accept responsibility. A factory might improve planning efficiency while remaining constrained by physical machinery. A hospital might automate paperwork yet still need the same number of nurses for bedside care.
This distinction between automating tasks and replacing whole jobs is essential. Headlines suggesting a direct line from better chatbots to a nationwide three-day week skip multiple economic steps.
Could workers keep the same pay while working less?
They could in some workplaces, but that would require an employer decision, collective agreement, regulatory change or a labor-market environment supportive of higher effective hourly compensation. An employee moving from five eight-hour days to three eight-hour days would cut weekly hours from 40 to 24—a 40% reduction in hours. Keeping weekly pay unchanged would require compensation per hour to increase by about 67%, before considering other changes in productivity or operating costs.
That is a much larger adjustment than ordinary schedule flexibility. The arithmetic does not make it impossible; it makes the necessary improvement explicit. By contrast, a four-day, 32-hour schedule requires a 20% reduction in hours, a different benchmark entirely.
Any employer trial must ask whether output, service quality, employee retention and customer coverage are maintained. Studies of particular programs may be promising, but results do not transfer uniformly to every industry.
What about Amazon employees?
There is no verified connection between Bezos’s prediction and an official companywide Amazon three-day-workweek policy. Bezos is Amazon’s founder and executive chair, but his personal economic forecast should not be presented as a company announcement.
Amazon operates a mixture of offices, warehouses, cloud-computing facilities, transportation networks and other businesses. Working-hour patterns depend on the role and contract. A broad change in hours would require formal employee communications and operational planning, not merely comments in a television interview.
Readers searching “Is Amazon switching to three days?” should therefore receive an unambiguous answer: not on the basis of this interview.
Could AI create a labor shortage instead of mass unemployment?
Bezos’s labor-shortage concern is plausible as a scenario, but it is not an established forecast. If incomes rose while more workers elected to reduce hours, businesses might face greater competition for labor. Yet other forces could push the opposite way: some jobs could be automated, employers could reduce hiring, or new industries might absorb displaced workers.
The net result will depend on adoption speed, which tasks AI performs reliably, the cost of computing and energy, economic growth and how governments and companies manage the transition. Reuters’ October 2026 discussion of AI at work also emphasized that AI is changing tasks within jobs, with younger and experienced workers potentially affected differently.
Frequently asked questions
Did Jeff Bezos predict a three-day workweek?
Yes. He discussed it as a possible consequence of greater AI productivity during an October 7, 2026 Fox News interview. It was not a commitment to a timetable.
Is Amazon moving to a three-day workweek?
No companywide shift was announced in the interview. Any claimed policy should be verified against Amazon’s official employment communications.
Would a three-day workweek mean three eight-hour days?
Not necessarily. A three-day schedule could mean 24 hours, longer shifts or another arrangement. Bezos did not establish a universal definition or wage agreement.
Will AI eliminate the need to work?
There is no evidence supporting that as an inevitable outcome. The ILO’s 2026 review describes heterogeneous gains and risks rather than the disappearance of work.
Could AI make one-income households more common?
It could in theory if household purchasing power rises materially, but wages, housing costs, childcare, benefits and employment security also matter. The claim remains a scenario, not a confirmed demographic trend.
When could three-day workweeks become common?
No defensible national timetable can be inferred from the cited interview. Some employers may experiment sooner than others.
The bigger economic question
The provocative part of Bezos’s vision is not whether software can perform individual tasks faster. It is whether future productivity gains become broadly shared prosperity. If workers capture enough benefit, shorter schedules may become more feasible. If gains are concentrated in profits or paired with job insecurity, fewer working hours could instead mean lower household income. Those are fundamentally different futures, and the evidence today does not settle which will dominate.
Discover more from The Economy
Subscribe to get the latest posts sent to your email.

The central business question about artificial intelligence has changed. Access to a capable tool is no longer enough to demonstrate an advantage. The harder test is whether the organisation produces better results after accounting for review, integration, training and operating costs.
McKinsey’s 2026 State of AI survey captures this tension. Eighty percent of respondents reported improved individual productivity, while 37% attributed some enterprise-level earnings impact to AI. Those findings describe the survey sample; they do not prove that every company sees the same pattern.
Nevertheless, the distinction is commercially important. An employee can finish a draft faster while the organisation remains constrained by approvals, unreliable data or a lack of customer demand. Businesses need to measure the complete process rather than celebrate speed at one stage.
Task improvement and business improvement are different
Imagine a customer-service team using AI to draft replies. Drafting time falls, but every response still passes through the same review queue. If that queue is the main source of delay, customers may notice little improvement.
Alternatively, the tool may let the team handle more requests with the same staffing. That could improve service even if no job is removed and no immediate payroll saving appears. The value would show up in capacity, response times or customer retention rather than a simple reduction in wages.
These are illustrative cases, but they expose a common measurement problem. Time saved is an intermediate result. The business still has to convert that time into additional output, better quality, reduced costs or another outcome it actually values.
The strongest pilot starts with a baseline
Before introducing a tool, record how the process currently performs. Useful measures might include turnaround time, error frequency, rework, customer complaints and cost per completed case. A baseline prevents ordinary variation from being mistaken for an AI benefit.
The unit of measurement should match the business objective. Counting generated documents says little about whether the documents were useful. Counting chatbot interactions does not show whether customers resolved their problems. High usage can even indicate confusion if people repeatedly retry unsuccessful tasks.
A pilot should also identify what success would justify expansion. For example, a team might require faster completion without an increase in material errors. Deciding that threshold in advance makes it harder to redefine success after seeing disappointing results.
Calculate the full cost, including human review
Subscription fees are only one part of AI expenditure. Integration work, access controls, evaluation, staff training and ongoing supervision can be substantial. Consumption-based charges may also increase as a pilot moves into routine use.
McKinsey’s survey reports that roughly one-fifth of respondents encountered AI operating costs that constrained usage. That is a reminder to model expenditure under realistic volumes rather than assume that the price of a small experiment represents the cost of a production system.
Consider a hypothetical team saving 100 hours a month. If review and correction consume 40 additional hours elsewhere, the net time benefit is 60 hours before other costs. If the saved time cannot be redeployed, its financial value may be smaller than multiplying those hours by an employee’s salary would suggest.
Redesign the workflow around the actual bottleneck
Adding AI to an inefficient process can accelerate one step while preserving the underlying problem. A sales team might generate more proposals while approvals remain slow. A finance department might classify invoices faster while unresolved supplier records continue to block payment.
The practical response is to map the whole process. Identify where work waits, where mistakes originate and which decisions require human judgment. Then determine whether AI addresses that constraint or merely produces more material for someone else to review.
This approach can lead to smaller, more useful deployments. A reliable extraction tool tied to a clear review procedure may deliver more value than an ambitious agent with broad permissions. The right scope depends on the task’s consequences, available data and the organisation’s ability to detect errors.
Quality has to be measured alongside speed
AI output can sound persuasive while containing mistakes. Businesses therefore need evaluation methods that reflect the consequences of failure. A minor tone problem in an internal draft differs from an incorrect price, contractual statement or customer instruction.
The NIST AI Risk Management Framework provides an official reference for thinking about AI risks and governance. Applied operationally, the relevant question is simple: which failures matter, how will they be detected, and who is responsible for responding?
Testing should include difficult and unusual cases, not just representative easy ones. A system that performs well on routine requests can still fail where a policy has exceptions or the underlying information is incomplete. The cost of those failures belongs in the business case.
Data access can matter more than model choice
A model cannot reliably answer organisation-specific questions if the relevant information is missing, outdated or contradictory. Businesses may discover that the most valuable preparatory work is cleaning records, assigning ownership and resolving conflicting policies.
Permissions matter too. Connecting an assistant to more information can improve usefulness while increasing the consequences of an access mistake. The deployment needs a clear account of who may see which material and what actions the system is permitted to take.
This creates an important procurement distinction. A compelling demonstration with carefully selected data does not establish readiness for the company’s actual environment. Buyers should ask how updates are handled, how errors are investigated and whether the product can be evaluated on realistic internal cases before a broad commitment.
Infrastructure growth is a separate investment story
The AI economy includes chip suppliers, data centres, power systems, software companies and businesses adopting applications. They do not all earn returns in the same way or on the same schedule.
The International Energy Agency’s Energy and AI report examines the relationship between AI and energy systems. For business analysis, the distinction matters because demand for computing infrastructure can grow even while some end users struggle to demonstrate profitable applications.
An investor or executive should therefore separate spending growth from return on that spending. A supplier can benefit from a construction cycle before the customer achieves a satisfactory payoff. Over time, however, customer economics matter to the durability of demand. Strong capital expenditure is evidence of commitment, not conclusive proof of eventual value.
What smaller businesses can do differently
A smaller company may lack the budget for extensive custom infrastructure, but it can still choose a narrow problem with a measurable outcome. Repetitive internal documentation, information retrieval or draft preparation may offer a manageable starting point when data and review requirements are clear.
The business should assign an owner who understands the process rather than treating the project as a tool purchase alone. That person can gather feedback, identify recurring failures and decide whether the deployment is helping employees complete useful work.
Expansion should follow evidence. If a pilot creates little value, the next step might be redesign, a different tool or stopping the experiment. A willingness to stop is part of competent investment management. Continuing simply because AI is strategically fashionable can turn a limited test into an expensive routine.
A practical scorecard for the next quarter
Track five things together: outcome quality, total completion time, cost per completed task, user adoption and the frequency of significant failures. The combination provides a more balanced view than any single headline metric.
Review how much of the benefit is repeatable. A one-time backlog reduction may be valuable without supporting the same ongoing return. Similarly, enthusiastic early users may not represent employees who encounter the system later with less training or motivation.
AI’s commercial promise in 2026 is substantial, but the route to value runs through ordinary operational discipline. Businesses need clear objectives, dependable information, realistic cost accounting and responsibility for the final result. The most useful question is not how much AI the organisation uses. It is what customers, employees and owners receive in return.
Discover more from The Economy
Subscribe to get the latest posts sent to your email.

Social Security Extra $90 Deposit: Who Qualifies for the October 2026 Medicare Rebate?

Anthropic Bans Sustained Abuse of Claude AI Under New Usage Policy Effective November 12, 2026

Jeff Bezos Three-Day Workweek View: What He Really Said

Celeste Frozen Pizza Discontinued: What Conagra Confirmed

US–China Critical Minerals Competition: Why a Trade Deal Cannot Fix Every Supply Risk

Oil Price Outlook 2026: How Supply Risks Reach Fuel Bills, Inflation and Business Costs

AI in Business 2026: Why Faster Employees Do Not Automatically Mean Higher Profits

Mortgage Rates in 2026: Why They Remain High and How to Compare the True Cost

Gold Price Outlook 2026: The Forces Behind the Forecasts—and What Could Reverse Them

Global Economic Outlook 2026: Growth, Inflation and Risks

Trump–Putin Diesel Deal: Why Zelensky Is Angry and What It Means for Fuel Prices

Anthropic Draws the Line: Why Claude’s New Usage Policy Explicitly Bans ‘Cruel Behavior’ Toward AI

Ynon Kreiz & Mattel’s Digital Transformation: Franchise Strategy and Financial Growth

Crude Oil & Petroleum Market Analysis: OPEC+ Decisions and Price Forecasts

Oil Prices Break $100 in 2026: Middle East Conflict & Energy Markets

Middle East War Economics 2026: Oil Prices & Energy Markets

China Stocks Today: Are Big Economies in Asia Nearing a Market Bottom?

PSX Forecast 2026: KSE-100, IMF Reviews & Geopolitics

Crypto Daily Outlook: Bitcoin, Altcoins, and the Future of Decentralized Finance

Global Pension Systems Ranked: The World’s Best and Worst Retirement Frameworks

Enterprise AI Platforms Disrupting B2B SaaS in 2026: Full Analysis

World’s Largest Economies: Ranking the Top Global Powers

Elon Musk’s Next Moves: Disrupting the 2026 Global Economy

Pakistan Economy 2026: Inside the SBP’s Balancing Act

GasBuddy Market Insights: How Crude Price Shifts Impact Local Fuel Cost Averages

World Bank & IMF Reports 2026: Why the “3% Growth” Consensus Is Actually a Debate

Global Equity Market Divergence: US Tech vs. European Dividend Stocks vs. Asian Growth

Stock Market Today: Dow Climbs 500 Points as Markets Shake Off Inflation Jitters
-

 Markets & Finance9 months ago
Top 15 Stocks for Investment in 2026 in PSX: Your Complete Guide to Pakistan’s Best Investment Opportunities
-

 Analysis8 months ago
Johor’s Investment Boom: The Hidden Costs Behind Malaysia’s Most Ambitious Economic Surge
-

 Analysis8 months ago
Top 10 Stocks for Investment in PSX for Quick Returns in 2026
-

 Banks9 months ago
Best Investments in Pakistan 2026: Top 10 Low-Price Shares and Long-Term Picks for the PSX
-

 Analysis8 months ago
Brazil’s Rare Earth Race: US, EU, and China Compete for Critical Minerals as Tensions Rise
-

 Investment9 months ago
Top 10 Mutual Fund Managers in Pakistan for Investment in 2026: A Comprehensive Guide for Optimal Returns
-

 Global Economy10 months ago
15 Most Lucrative Sectors for Investment in Pakistan: A 2025 Data-Driven Analysis
-

 Global Economy10 months ago
Pakistan’s Export Goldmine: 10 Game-Changing Markets Where Pakistani Businesses Are Winning Big in 2025