
Labour
The Medicaid Churn: Front-End Revenue Cycle Risks for Enterprise Hospitals


CMS published an interim final rule on June 3, 2026, requiring adult Medicaid enrollees aged 19–64 to meet an 80-hour-per-month work or community-engagement threshold as a condition of continued eligibility, according to Exactrx. The rule took effect July 31, 2026, with full state compliance required by January 1, 2027, per contractingproviders.com. For enterprise hospital systems and revenue-cycle leaders, this is not a distant policy abstraction — it is a payer-mix event with a known start date, a projected enrollment impact, and a direct, quantifiable path into accounts-receivable performance.
The Regulatory Timeline Enterprise Finance Teams Need
| Date | Milestone | Source |
|---|---|---|
| July 4, 2025 | Section 71119 of H.R. 1 (One Big Beautiful Bill Act) signed into law, establishing statutory basis | contractingproviders.com |
| June 3, 2026 | CMS publishes interim final rule detailing 80-hour/month work requirement | Exactrx |
| July 31, 2026 | Work-requirement rule takes effect | contractingproviders.com |
| September 2026 (est.) | Patient inquiries about coverage status begin increasing, per ContinuumCloud | ContinuumCloud |
| December 31, 2026 | Deadline for redetermination workflows to be fully operational | PointCare |
| January 1, 2027 | Full state compliance required; twice-yearly (semiannual) redeterminations begin for expansion adults | PointCare, ContinuumCloud |
Sources: Exactrx, contractingproviders.com, ContinuumCloud, PointCare — see citations above.
The Enrollment-Loss Numbers, Reconciled
Multiple projections exist, and enterprise finance teams should understand why they differ:
- CMS’s own interim final rule projects approximately 2.3 million fewer Medicaid enrollees in fiscal year 2027, rising to over 3 million in subsequent years, per Exactrx.
- The Congressional Budget Office’s earlier, broader estimate projects a reduction of 5.2 million adults by 2034 — a longer time horizon than CMS’s near-term figure, per definitivehc.com.
- A separate CBO estimate cited elsewhere projects 4.8 million people losing coverage over the next decade, per ContinuumCloud — broadly consistent with the CBO’s longer-horizon figures.
- These sit within a larger estimated 15 million people losing health insurance overall under the OBBBA, according to the CBO figures cited by HFMA.
The reconciliation: CMS’s 2.3–3 million figure is the near-term (FY2027) work-requirement-specific impact; the CBO’s 4.8–5.2 million figures represent longer-horizon (through 2034) cumulative effects; and the 15 million figure captures the full scope of the broader legislative package beyond Medicaid work requirements alone.
The Structural Problem: Doubled Administrative Burden, Same Headcount
The operational core of the churn problem is that redetermination frequency is doubling — from annual to semiannual reviews — without a corresponding doubling of enrollment-team headcount, according to PointCare. This structural mismatch is the direct driver of increased “administrative churn” — patients losing and regaining coverage due to paperwork friction rather than genuine eligibility changes.
The scale of this administrative-churn problem is already documented: according to the Commonwealth Fund, cited by RSM, one in ten Medicaid enrollees loses and regains coverage within 12 months, often due to administrative hurdles rather than true eligibility changes — a pattern semiannual redeterminations are projected to intensify.
Quantified Financial Exposure at the Provider Level
A mid-sized provider managing 25,000 Medicaid patients could see an 18% jump in claim denials and a 12% rise in patient churn, potentially resulting in up to $2.4 million in annual uncompensated care losses, according to ContinuumCloud. This is compounded by a broader industry baseline problem: hospitals collectively spent $18 billion fighting claim denials in 2025, with average AR days rising 5.2% despite that spending, per Exactrx.
Beyond Hospitals: The ASC and Outpatient Blind Spot
Revenue-cycle leaders at ambulatory surgery centers and outpatient practices often assume Medicaid churn is primarily a safety-net-hospital and federally-qualified-health-center problem — an assumption worth interrogating, per Exactrx. Medicaid-covered patients represent a meaningful share of elective and semi-elective procedure volume at ASCs in expansion states, and when coverage disappears, those patients don’t vanish from the practice’s patient population — they either shift to commercial/marketplace coverage (requiring new 90–150-day credentialing cycles) or become uninsured, generating direct uncompensated-care exposure regardless of facility type.
An Enterprise Revenue-Cycle Risk Framework
- Verify eligibility at every visit, not just at registration. Point-of-registration-only verification is structurally inadequate under semiannual redetermination cycles; per-visit CHAMPS/HIPAA 270-271 eligibility transactions are becoming operationally necessary, per medsolercm.com.
- Automate re-verification workflows now, ahead of the 2027 deadline. Automated re-verification every five months, aligned to the semiannual cycle, can cut 30–45 days off enrollment-timeline exposure, per ContinuumCloud.
- Diversify payer mix ahead of the enrollment decline, not after. Because commercial-payer credentialing takes 90–150 days, practices waiting until 2027 volume declines materialize will face a revenue gap during the credentialing lag itself, per contractingproviders.com.
- Build patient-facing coverage-retention infrastructure, not just back-office redetermination workflows. Verifying coverage before scheduled services, flagging unconfirmed eligibility, and connecting patients quickly to financial counselors are explicitly recommended proactive steps, per RSM.
- Track license/sanction status continuously. Automated alerts on provider license and sanction changes, aligned to 2026 standards, can materially compress enrollment timelines and reduce compliance risk, per ContinuumCloud.
The Bottom Line for Enterprise Healthcare Finance
Medicaid churn has structurally shifted from an eligibility/enrollment-department problem into a CFO-level revenue-cycle risk with quantified, near-term financial exposure. With semiannual redeterminations doubling administrative workload without a corresponding staffing increase, and CMS’s own projections showing 2.3+ million enrollees losing coverage by FY2027, hospital systems, ASCs, and outpatient practices across all 41 Medicaid-expansion states have a defined, dated window — through December 31, 2026 — to build the automated verification and payer-mix-diversification infrastructure the post-2027 environment will require.
Discover more from The Economy
Subscribe to get the latest posts sent to your email.


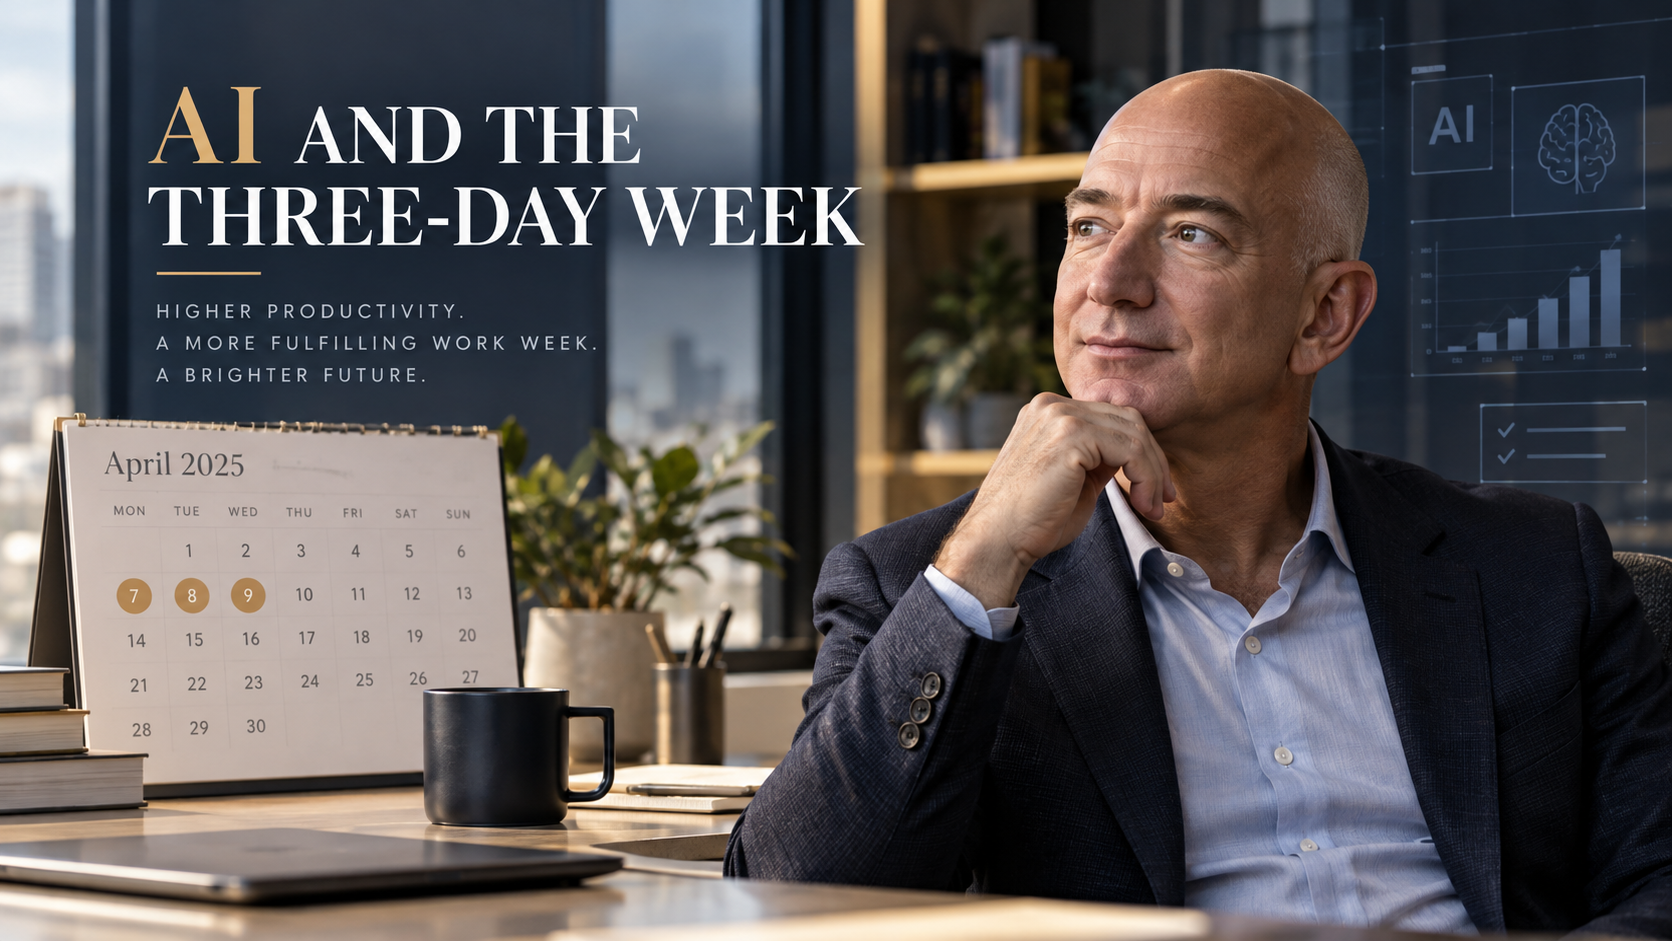
Jeff Bezos has floated a future in which artificial intelligence makes workers productive enough that some people might choose a three-day workweek while still supporting their families. The Amazon founder made the point during an October 7, 2026 interview with Fox News. He did not announce that Amazon is adopting a three-day schedule or that AI guarantees shorter hours for everyone. The underlying distinction is crucial: Bezos was describing a possible long-term economic outcome, not a new employment policy. Fox News’s account of the interview and Fast Company’s focused coverage make that clear.
Key takeaways:
- Bezos linked the possibility of fewer working days to future gains in AI-driven productivity.
- He suggested greater output could make single-income households or shorter working schedules financially feasible for some families.
- There is no evidence in the cited interview of a universal three-day-workweek plan at Amazon.
- Research shows AI can save time on some tasks, but broad effects on compensation and employment remain unsettled.
What did Jeff Bezos say?
In the Fox interview, Bezos discussed an optimistic vision of technological progress. His argument was that powerful AI tools could raise economic output enough to expand people’s choices. If a person can generate greater value in less time—and share financially in that improvement—working fewer days could become an option rather than a forced reduction in income.
That scenario is different from predicting every office will close on Thursdays and Fridays. It is also different from a government-mandated reduction in work hours. Fast Company reported Bezos’s additional concern that firms might face labor shortages if people respond to higher productivity by choosing more leisure time.
The prediction has attracted attention because it reverses the most alarming version of the AI-and-jobs debate. Instead of imagining machines replacing so many workers that employment vanishes, Bezos emphasized the possibility of prosperity, shorter hours and tighter labor supply.
Why the productivity argument matters
Labor productivity is commonly measured as output per hour worked. That is the U.S. Bureau of Labor Statistics’ definition. A software developer completing work that used to require ten hours in six may produce more per hour. A customer-service team handling routine requests faster may serve more customers without increasing headcount at the same rate.
But greater task efficiency does not automatically mean that an employee receives proportionally higher wages or fewer shifts. Businesses choose how to allocate productivity gains among pricing, investment, expansion, profits, compensation and staffing. Workers’ bargaining power, competition, management priorities and public policy can all shape the outcome.
A simple illustration—not a forecast
Imagine an employee currently produces 40 units of useful output during a 40-hour week. Productivity is one unit per hour. If technology raises the rate to 1.67 units an hour, a 24-hour week could, arithmetically, produce approximately 40 units.
That calculation only shows a technical possibility. It assumes the tasks can be reorganized, demand stays sufficiently steady, management accepts the schedule, and pay arrangements remain favorable. Healthcare, aviation, emergency services, logistics and many other occupations require coverage across specific hours; AI cannot simply eliminate the need for people to be present.
The important question is not whether an AI tool sometimes saves time. It is whether the gain is widespread, reliable and shared in a way that makes shorter schedules financially sustainable.
What does current research show about AI and jobs?
The evidence is more restrained than the boldest predictions. A June 2026 International Labour Organization review found evidence of real but uneven productivity gains. It also concluded that large-scale job displacement had remained limited in the material reviewed, while warning about inequality, weakened entry-level pathways and shifting job quality.
Separately, Yale’s Budget Lab tracker, updated September 15, 2026, reported no clear economy-wide labor-market disruption attributable to AI in the indicators it examined. Its researchers cautioned that the findings could change as technology adoption and data evolve.
These results do not prove Bezos wrong. They show that the conditions for a large-scale three-day week have not yet been demonstrated by broad labor data. Firms are experimenting with AI, but productivity effects differ among tasks, occupations and organizations.
Task savings are not the same as job transformation
An AI assistant might draft a first version of a memo quickly, but a professional still needs to check accuracy, speak with clients, make decisions and accept responsibility. A factory might improve planning efficiency while remaining constrained by physical machinery. A hospital might automate paperwork yet still need the same number of nurses for bedside care.
This distinction between automating tasks and replacing whole jobs is essential. Headlines suggesting a direct line from better chatbots to a nationwide three-day week skip multiple economic steps.
Could workers keep the same pay while working less?
They could in some workplaces, but that would require an employer decision, collective agreement, regulatory change or a labor-market environment supportive of higher effective hourly compensation. An employee moving from five eight-hour days to three eight-hour days would cut weekly hours from 40 to 24—a 40% reduction in hours. Keeping weekly pay unchanged would require compensation per hour to increase by about 67%, before considering other changes in productivity or operating costs.
That is a much larger adjustment than ordinary schedule flexibility. The arithmetic does not make it impossible; it makes the necessary improvement explicit. By contrast, a four-day, 32-hour schedule requires a 20% reduction in hours, a different benchmark entirely.
Any employer trial must ask whether output, service quality, employee retention and customer coverage are maintained. Studies of particular programs may be promising, but results do not transfer uniformly to every industry.
What about Amazon employees?
There is no verified connection between Bezos’s prediction and an official companywide Amazon three-day-workweek policy. Bezos is Amazon’s founder and executive chair, but his personal economic forecast should not be presented as a company announcement.
Amazon operates a mixture of offices, warehouses, cloud-computing facilities, transportation networks and other businesses. Working-hour patterns depend on the role and contract. A broad change in hours would require formal employee communications and operational planning, not merely comments in a television interview.
Readers searching “Is Amazon switching to three days?” should therefore receive an unambiguous answer: not on the basis of this interview.
Could AI create a labor shortage instead of mass unemployment?
Bezos’s labor-shortage concern is plausible as a scenario, but it is not an established forecast. If incomes rose while more workers elected to reduce hours, businesses might face greater competition for labor. Yet other forces could push the opposite way: some jobs could be automated, employers could reduce hiring, or new industries might absorb displaced workers.
The net result will depend on adoption speed, which tasks AI performs reliably, the cost of computing and energy, economic growth and how governments and companies manage the transition. Reuters’ October 2026 discussion of AI at work also emphasized that AI is changing tasks within jobs, with younger and experienced workers potentially affected differently.
Frequently asked questions
Did Jeff Bezos predict a three-day workweek?
Yes. He discussed it as a possible consequence of greater AI productivity during an October 7, 2026 Fox News interview. It was not a commitment to a timetable.
Is Amazon moving to a three-day workweek?
No companywide shift was announced in the interview. Any claimed policy should be verified against Amazon’s official employment communications.
Would a three-day workweek mean three eight-hour days?
Not necessarily. A three-day schedule could mean 24 hours, longer shifts or another arrangement. Bezos did not establish a universal definition or wage agreement.
Will AI eliminate the need to work?
There is no evidence supporting that as an inevitable outcome. The ILO’s 2026 review describes heterogeneous gains and risks rather than the disappearance of work.
Could AI make one-income households more common?
It could in theory if household purchasing power rises materially, but wages, housing costs, childcare, benefits and employment security also matter. The claim remains a scenario, not a confirmed demographic trend.
When could three-day workweeks become common?
No defensible national timetable can be inferred from the cited interview. Some employers may experiment sooner than others.
The bigger economic question
The provocative part of Bezos’s vision is not whether software can perform individual tasks faster. It is whether future productivity gains become broadly shared prosperity. If workers capture enough benefit, shorter schedules may become more feasible. If gains are concentrated in profits or paired with job insecurity, fewer working hours could instead mean lower household income. Those are fundamentally different futures, and the evidence today does not settle which will dominate.
Discover more from The Economy
Subscribe to get the latest posts sent to your email.

Britain’s labour market has now been shedding jobs for as long as it did during the depths of the global financial crisis — and this time, employers are explicitly naming artificial intelligence as a reason for the cuts.
The closely watched S&P Global/CIPS Purchasing Managers’ Index showed services firms and the wider private sector reducing headcount for a 22nd consecutive month in July 2026, according to data reported by Bloomberg. That run now equals the length of the downturn seen during the 2008-09 crash in the dominant services sector, and is just one month short of matching it across the wider economy.
A Downturn Two Years in the Making
Unlike the 2008 crisis, which was triggered by a sudden banking collapse, this slump has crept up gradually. The survey shows the pace of job losses easing slightly in July compared with prior months, but the cumulative duration — nearly two full years of continuous headcount reduction — is what has alarmed economists watching the data, as detailed by Staffing Industry Analysts.
Crucially, firms surveyed gave two distinct explanations for the cuts: general cost-reduction efforts, and — increasingly — a reduced need for workers after investing in AI tools to boost productivity. That second factor marks a shift from earlier phases of the downturn, when cost pressure alone dominated employer commentary.
The PMI Numbers Behind the Story
The deterioration has been building for months. Earlier readings from S&P Global’s official PMI release showed the sector losing momentum steadily through the spring, with survey respondents explicitly citing the fallout from the US-Iran conflict as a drag on client confidence, layered on top of already-elevated domestic political uncertainty.
Separate flash data tracked by FX.co showed the UK Services PMI slipping to 48.7 in June — below the 50.0 threshold that separates expansion from contraction, and short of the 50.5 markets had expected. That marked the sharpest downturn since January 2023, driven by weaker new business volumes, shrinking order backlogs and further job cuts, even as input cost inflation — from transport to IT equipment surcharges — continued to squeeze margins.
The survey’s own methodology notes are telling: data collected in June found “a sustained reduction in backlogs of work across the service economy, largely reflecting a lack of pressure on business capacity due to weak demand,” according to the official S&P Global report. In plain terms, companies have less work to do, and they are responding by not replacing staff who leave rather than launching mass redundancy rounds — a slower but more persistent form of labour market erosion.
The Political Backdrop
The prolonged downturn deepens pressure on the Labour government, which took office in the summer of 2024 promising to reinvigorate growth. Nearly two years of continuous private-sector job losses is a difficult data point for any incumbent administration to explain away, particularly as it now sits alongside separately reported gilt market volatility and scrutiny of the Bank of England’s policy path.
Why AI Is a Different Kind of Headwind
What distinguishes this downturn from previous UK labour market slumps is the structural, rather than purely cyclical, nature of some of the job losses. Employers citing AI-driven productivity gains as a reason for not replacing departing staff suggests that even a rebound in demand may not translate into a proportional rebound in hiring — a dynamic that echoes concerns raised in the US, where financial-sector employment — an industry widely seen as exposed to AI adoption — has fallen to a four-year low.
Economists warn this creates a harder policy problem than a conventional cyclical downturn. Interest rate cuts and fiscal stimulus can revive demand, but they do less to reverse a structural shift in how many workers a given level of output requires.
What to Watch Next
Three data points will determine whether Britain’s labour market stabilises or deteriorates further into autumn:
- The August PMI releases, which will show whether July’s slight easing in the pace of job cuts was a genuine inflection point or a one-month pause.
- Bank of England commentary on how much weight it assigns to labour market weakness versus persistent inflation in setting the path for interest rates.
- Sector-level AI adoption data, particularly in financial and professional services, where the productivity-driven hiring freeze appears most entrenched.
The Bottom Line
Two years of continuous UK private-sector job cuts is no longer a temporary post-pandemic adjustment — it has become the longest sustained labour market downturn since the financial crisis. With employers now openly citing AI adoption alongside cost discipline as drivers of headcount reduction, the shape of any eventual recovery may look very different from past cycles: output could recover well before payrolls do.
Discover more from The Economy
Subscribe to get the latest posts sent to your email.

A labor market that looked resilient just weeks ago has cracked, and traders are now wagering the Federal Reserve will have no choice but to cut interest rates as soon as next month.
The US Bureau of Labor Statistics reported on August 7 that nonfarm payrolls fell by a seasonally adjusted 23,000 in July — a stunning miss against the Dow Jones consensus forecast of an 83,000 gain, according to CNBC. Worse, the agency slashed prior estimates for May and June by a combined 103,000 jobs, dragging the trailing 12-month average payroll gain down to just 34,000 — among the weakest stretches outside a recession in over a decade.
A Report That Rewrites the Narrative
For much of 2026, the prevailing story on Wall Street was that the US economy had shrugged off tariff shocks and geopolitical turbulence. That narrative is now under serious strain. The unemployment rate ticked down to 4.1%, but for the wrong reason: the Bureau of Labor Statistics confirmed the labor force participation rate slid to 61.4%, its lowest level in more than five years outside the pandemic, as hundreds of thousands of Americans simply stopped looking for work.
Household employment — the survey used to calculate the jobless rate — actually fell by 87,000, even as the official rate declined. That divergence is a red flag economists watch closely, because it signals discouraged-worker dynamics rather than genuine labor market strength.
“The July employment report solidified that the labor market is not out of the woods quite yet,” ZipRecruiter labor economist Nicole Bachaud told CNBC.
Where the Damage Is Concentrated
The sectoral breakdown tells a story of an economy bifurcating under pressure. According to a detailed Spokesman-Review analysis of the BLS release:
- Leisure and hospitality employment fell to its lowest level in nearly a year, with restaurants and bars shedding staff — a particularly bitter disappointment given forecasters had expected a boost from the FIFA World Cup, which concluded July 19.
- Financial activities payrolls dropped to a four-year low, with the BLS confirming losses concentrated in credit intermediation (-9,000) and insurance carriers (-7,000). The sector — seen as among the most exposed to AI-driven automation — is now down 121,000 jobs since its May 2025 peak.
- Retail trade shed jobs at warehouse clubs, supercenters and general merchandise stores (-21,000), alongside a smaller decline at gasoline stations.
- Manufacturing and construction, by contrast, continued to climb, a trend economists partly attribute to the ongoing AI data-center build-out even as high interest rates keep homebuilding subdued.
The month also arrived alongside a wave of high-profile layoff announcements from Microsoft, Uber and Visa, reinforcing the sense that white-collar hiring caution has broadened beyond tech.
Why the Iran War Keeps Showing Up in Economic Data
Bloomberg’s economics desk framed the report bluntly: a surprise drop in US payrolls has renewed worries about the health of the world’s largest labor market, with employers growing cautious “amid rising prices and fallout from the Iran war,” according to Bloomberg. Elevated energy costs stemming from Middle East supply disruption have fed directly into hiring plans, compounding the drag from tariff-related input cost inflation that has squeezed margins across retail and manufacturing since early in the year.
Notably, the US is not alone. The same Bloomberg dispatch pointed to the UK, where private-sector employment surveys are even more negative — a downturn now rivaling the length of the 2008-09 financial crisis in the country’s dominant services sector.
What It Means for the Federal Reserve
Markets moved fast. Futures pricing shifted decisively toward a September rate cut in the hours following the release, as traders concluded the Fed’s dual mandate now tilts firmly toward the employment side of the ledger. A weakening labor market, combined with a participation rate at generational lows, gives the Federal Open Market Committee cover to ease even with inflation still running above target — a trade-off that will be closely watched at the Fed’s next meeting.
The revisions matter as much as the headline. A downward adjustment of 103,000 jobs across just two months suggests the “resilient” labor market story that dominated the first half of 2026 was, in part, a statistical mirage. Economists now widely expect the upcoming preliminary benchmark revision — due August 28 from the BLS — to confirm further softness in the annual payroll count.
The Investor Playbook
For traders and portfolio managers across the nine markets this publication tracks, the implications cascade quickly:
- Rate-sensitive equities — regional banks, homebuilders, and small caps — are best positioned to benefit from a confirmed dovish pivot.
- The dollar faces downward pressure as rate-cut expectations firm, a dynamic that matters directly for emerging-market currencies from the Pakistani rupee to the Indonesian rupiah, both of which import inflation partly through dollar-denominated debt and energy costs.
- Treasury yields have room to fall further if the September cut is confirmed, which would ease financing costs for governments and corporates globally.
- Gold and other haven assets typically firm on rate-cut expectations paired with geopolitical risk — a combination now squarely in play.
The Bottom Line
The July jobs report did not show a labor market in freefall, but it did puncture the illusion of a soft landing achieved without cost. Falling participation, deep downward revisions, and sector-specific stress in finance and hospitality point to an economy where headline resilience is increasingly propped up by fewer people working, not more people finding jobs. With the Fed’s September meeting now the market’s central focus, the coming weeks of data — including the August 28 benchmark revision — will determine whether this was a one-month air pocket or the start of a genuine slowdown.
Discover more from The Economy
Subscribe to get the latest posts sent to your email.

Global Banking Trends 2026: Digital Banks, AI and Compliance

Gold vs US Dollar vs Bitcoin in 2026: Inflation Hedge Compared

How Global Interest Rates Affect Savings, Loans and Investments

How to Invest During High Inflation: A Global Guide

Best Global Stocks to Watch in 2026: Four Sectors to Research

Pakistan’s 2027 Growth Strategy: Exports, AI, Energy and Jobs

Pakistan Economy FY2027: IMF Reform, Debt and Recovery Outlook

Global Interest Rates 2027: Risks for Pakistan’s Rupee and Debt

Energy Shock 2026–2027: Oil, Gas and Pakistan’s Economy

World Trade 2027: Tariffs, Supply Chains and Pakistan Exports

AI Investment Boom 2026–2027: Can Pakistan Capture the Upside?

Global Economy 2026–2027: What Slower Growth Means for Pakistan

Why Global Inflation Is Rising Again in 2026, and What It Means for Pakistan

Raast Pakistan 2026: Digital Payments, Fintech

Crude Oil & Petroleum Market Analysis: OPEC+ Decisions and Price Forecasts

World’s Largest Economies: Ranking the Top Global Powers

Pakistan Economy 2026: Inside the SBP’s Balancing Act

Silver Price Today: Why the Xi-Trump AI Standoff Is Fueling a Safe-Haven Rally

Oil Prices 2026: Inside the Hormuz Crisis That Won’t End

SpaceX IPO 2026: History’s Biggest Stock Debut?

Top US Convenience Store Chains: Store Counts, EV Charging, and Sales Trends

Algorithmic Dogfights: Why the U.S. and China Must Establish Rules of Engagement for Autonomous Air Power

Who Is Shivon Zilis? The Neuralink Executive at the Center of the Musk–OpenAI Trial

Global Economic Outlook 2026: 7 Forces Reshaping Markets, Trade and Business

Business Insurance: What Coverage You Actually Need and What It Costs in 2026

Corporate America Faces a New Debt Test as US Borrowing Costs Surge

Is AI a Stock Bubble in 2026? What the Data Shows

Social Security Extra $90 Deposit: Who Qualifies for the October 2026 Medicare Rebate?
-

 Markets & Finance10 months ago
Top 15 Stocks for Investment in 2026 in PSX: Your Complete Guide to Pakistan’s Best Investment Opportunities
-

 Analysis8 months ago
Johor’s Investment Boom: The Hidden Costs Behind Malaysia’s Most Ambitious Economic Surge
-

 Analysis8 months ago
Top 10 Stocks for Investment in PSX for Quick Returns in 2026
-

 Banks9 months ago
Best Investments in Pakistan 2026: Top 10 Low-Price Shares and Long-Term Picks for the PSX
-

 Analysis9 months ago
Brazil’s Rare Earth Race: US, EU, and China Compete for Critical Minerals as Tensions Rise
-

 Investment9 months ago
Top 10 Mutual Fund Managers in Pakistan for Investment in 2026: A Comprehensive Guide for Optimal Returns
-

 Global Economy10 months ago
15 Most Lucrative Sectors for Investment in Pakistan: A 2025 Data-Driven Analysis
-

 Global Economy10 months ago
Pakistan’s Export Goldmine: 10 Game-Changing Markets Where Pakistani Businesses Are Winning Big in 2025