
Opinion
Pakistan Assumes Digital Cooperation Organization Presidency: A Pivotal Moment for Global Digital Inclusion

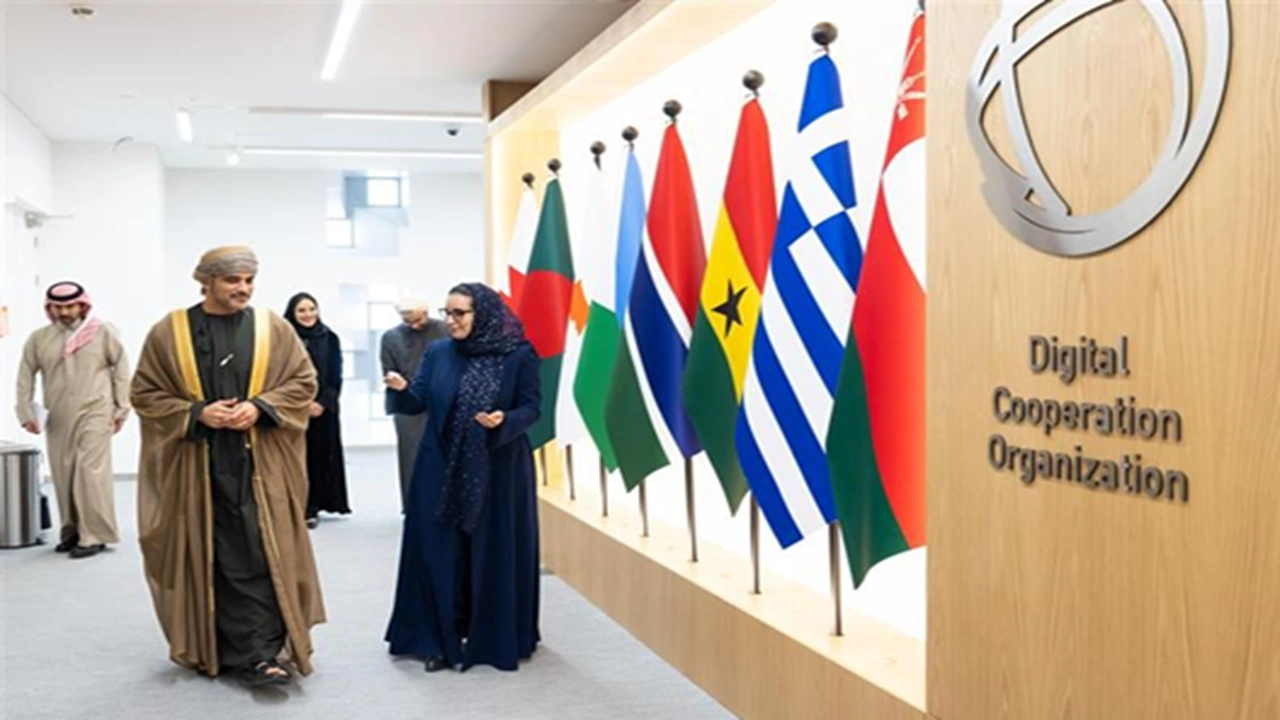
As Islamabad takes the helm of the DCO in 2026, the world watches to see whether this coalition can bridge the widening digital divide—or simply become another multilateral talking shop.
KUWAIT CITY — Pakistan took control Thursday of a little-known but increasingly influential digital governance coalition, assuming the presidency of the 16-nation Digital Cooperation Organization at a moment when debates over artificial intelligence, data sovereignty and cybersecurity are fracturing the global tech landscape.
The handover at the organization’s fifth General Assembly in Kuwait elevates Shaza Fatima Khawaja, Pakistan’s minister of state for information technology, to the chairmanship of a bloc that represents more than 800 million internet users across the Middle East, South Asia and parts of Africa—a collective attempting to assert technological independence from both Western platforms and Chinese infrastructure.
The transfer of leadership wasn’t merely ceremonial. It represented a calculated bet by the 16-member organization—which now accounts for over 800 million digitally connected citizens across three continents—that Pakistan’s unique position between the developed and developing digital worlds could catalyze meaningful progress on issues ranging from cybersecurity frameworks to artificial intelligence governance. The question now is whether Islamabad can deliver substance to match the symbolism.
The DCO’s Rapid Evolution: From Regional Initiative to Global Digital Force
Founded in November 2020 by just five countries—Bahrain, Jordan, Kuwait, Pakistan, and Saudi Arabia—the Digital Cooperation Organization emerged from a recognition that the architecture of global digital governance was being written without sufficient input from emerging markets. What began as a modest Middle Eastern initiative has metastasized into something far more ambitious: a counterweight to Western-dominated tech policy frameworks that many members believe inadequately address the realities of developing digital economies.
The organization’s expansion tells its own story. From its original quintet, the DCO has grown to encompass 16 member states, creating a sprawling coalition that bridges the Gulf’s petrostate-funded digital ambitions with South Asia’s massive user bases and Africa’s leapfrog innovation ecosystems. According to research published by The Economist, the DCO’s focus on digital public infrastructure—the unsexy but essential backbone of modern digital economies—has positioned it as a serious player in debates about technological sovereignty and data governance.
The timing of Pakistan’s DCO presidency 2026 is particularly significant. As global powers fracture over AI regulation, data localization, and platform governance, middle powers are finding unprecedented leverage. The DCO represents an attempt to create what policy analysts call “regulatory optionality”—the ability for emerging economies to choose frameworks that serve their developmental needs rather than simply importing Silicon Valley’s libertarian ethos or Beijing’s surveillance-enabled model.
Shaza Fatima Khawaja’s Vision: Beyond Digital Rhetoric
In her acceptance remarks at the Kuwait assembly, Shaza Fatima Khawaja DCO leadership began with characteristic pragmatism. “I would like to reaffirm Pakistan’s unwavering support for the DCO,” she stated, her words carefully calibrated to signal both continuity and ambition. “Together through collaboration and shared purpose we can ensure that digital transformation delivers inclusive growth and shared prosperity for all and as a founding member Pakistan is proud to see it growing and see it prospering and working towards a shared future.”
The statement, while diplomatically anodyne, hints at Pakistan’s strategic priorities for its year-long tenure. Unlike previous presidencies that emphasized infrastructure connectivity or e-government platforms, Khawaja’s ministry has signaled that Pakistan’s chairmanship will prioritize what insiders call the “human layer” of digital transformation: education, safety, and genuinely inclusive access.
This focus isn’t accidental. Pakistan’s own digital journey has been characterized by stark contradictions. The country boasts over 125 million internet users and a thriving freelance economy that generates hundreds of millions in annual remittances, yet nearly 40% of its population remains offline, trapped on the wrong side of infrastructure, affordability, and literacy barriers. These domestic realities have made Khawaja’s ministry acutely aware of the gap between digital policy rhetoric and ground-level implementation—a gap the DCO digital economy goals must address if the organization wants to maintain credibility.
Pakistan Digital Transformation 2026: Ambition Meets Implementation Challenges
Pakistan’s assumption of the DCO presidency coincides with its own aggressive domestic digital agenda. The government’s “Digital Nation Pakistan” initiative—a sweeping framework unveiled in late 2025—aims to bring 50 million additional Pakistanis online by 2028 while quadrupling the IT services export sector to $15 billion annually. The DCO chairmanship offers Islamabad an opportunity to beta-test these initiatives on a regional scale while learning from peer countries facing similar challenges.
The priorities Pakistan has outlined for its DCO tenure reflect this dual focus on domestic transformation and regional cooperation:
Digital Education Infrastructure: Pakistan plans to champion the creation of a DCO-wide framework for digital literacy, drawing on successful models like Bangladesh’s “Learning Passport” initiative and adapting them for contexts where internet penetration remains sporadic. The goal is to create portable, standardized digital credentials that allow workers to move seamlessly across DCO member labor markets—a potentially revolutionary shift for regional economic integration.
Cybersecurity and Online Safety: With DCO member states experiencing a 340% increase in ransomware attacks between 2022 and 2025, according to cybersecurity data compiled by Forbes, Pakistan’s presidency will prioritize the establishment of a regional Computer Emergency Response Team (CERT) network. This infrastructure would allow real-time threat intelligence sharing—critical for countries that lack the resources for sophisticated independent cyber defense capabilities.
AI Collaboration and Governance: Perhaps most ambitiously, Pakistan intends to use its DCO platform to advocate for what Khawaja has termed “AI pluralism”—the principle that artificial intelligence development should reflect diverse cultural values and developmental priorities rather than converging on a single Western or Chinese model. This aligns with Pakistan’s own experimentation with large language models trained on Urdu and regional languages, an effort that has attracted interest from other Global South nations frustrated by English-language AI hegemony.
How Pakistan’s DCO Leadership Boosts Global Digital Inclusion: The Geopolitical Calculus
For observers tracking the evolving digital world order, Pakistan’s DCO presidency matters for reasons that transcend the organization’s specific policy agenda. The country occupies a strategic position in multiple overlapping technology ecosystems: it’s a major recipient of Chinese digital infrastructure investment through the Belt and Road Initiative, maintains deep technical partnerships with Turkey and the Gulf states, and retains significant educational and business ties to Western tech ecosystems through its vast diaspora.
This positioning allows Pakistan to serve as what diplomatic theorists call a “hinge state” in digital governance debates—capable of translating between competing visions of internet governance and potentially brokering compromises that pure regional blocs cannot achieve. The DCO digital inclusion agenda that emerges under Pakistan’s leadership will test whether this theoretical advantage translates into practical policy innovation.
Early indications suggest cautious optimism. Pakistan’s Ministry of IT has already convened working groups on three priority areas: establishing minimum standards for algorithmic transparency in government services, creating mutual recognition frameworks for digital identity systems, and developing shared protocols for cross-border data flows that balance privacy protection with economic efficiency. These aren’t revolutionary proposals, but they represent the kind of incremental technical diplomacy that can yield lasting institutional benefits.
The geopolitical implications extend beyond the DCO itself. If Pakistan can demonstrate effective digital multilateralism, it strengthens the case for middle-power leadership on technology governance at venues like the United Nations and the G20. Conversely, a presidency that produces only vague communiqués and unimplemented action plans would reinforce skepticism about whether emerging markets can move beyond grievance-based tech politics to constructive institution-building.
The Economist’s Take: Can Digital Cooperation Overcome Political Fragmentation?
Skeptics—and they are numerous—point to the DCO’s fundamental structural challenge: its members agree on the problem (Western digital dominance) far more than they agree on solutions. Saudi Arabia’s vision of digital development emphasizes state-directed megaprojects and close integration with Western tech giants. Pakistan’s approach favors distributed innovation and regulatory frameworks that empower local entrepreneurs. Jordan prioritizes becoming a regional tech services hub. These aren’t necessarily incompatible visions, but they create coordination problems that no single presidency can fully resolve.
Moreover, the DCO operates in an increasingly hostile geopolitical environment. U.S.-China tech decoupling creates pressure for countries to choose sides in ways that cut across DCO membership. India’s conspicuous absence from the organization—despite its obvious interests in digital governance—reflects concerns about associating too closely with Saudi and Gulf-led initiatives. And domestic political instability in several member states raises questions about whether governments can maintain consistent long-term digital strategies.
Yet these challenges also create opportunities. The very fragmentation of global digital governance—what scholars call the “splinternet”—increases demand for bridge institutions that can facilitate cooperation without requiring full alignment on values or political systems. The DCO’s emphasis on practical, technical cooperation rather than grand ideological projects positions it well for this role, particularly if Pakistan’s presidency can demonstrate tangible deliverables.
Looking Ahead: The 2026 Agenda and Beyond
As Pakistan settles into its DCO chairmanship, several concrete initiatives will test the organization’s effectiveness:
The planned launch of a DCO Digital Skills Certification Program in Q3 2026, designed to create portable credentials for tech workers across member states, will indicate whether the organization can move beyond policy documents to operational programs. Pakistan’s Ministry of IT is already piloting the framework with 5,000 students across three technical universities, with plans to scale to 100,000 participants by year-end if the model proves viable.
A proposed DCO Cybersecurity Fund, capitalized with $200 million in initial commitments, would provide grants and technical assistance to members building out national cyber defense capabilities. Pakistan is lobbying Gulf states to anchor the fund, leveraging its traditional diplomatic ties in the region.
Perhaps most significantly, Pakistan intends to use its presidency to convene the first-ever DCO summit on AI governance in Islamabad during November 2026. The gathering would bring together not just government officials but technologists, civil society representatives, and private sector leaders to hash out common approaches to algorithmic accountability, bias mitigation, and the ethical deployment of AI systems in contexts where regulatory capacity remains limited.
These initiatives operate on different timescales and face varying probability of success. But collectively, they represent an attempt to build what development economists call “institutional thickness”—the layered relationships and shared practices that allow cooperation to persist even when political headwinds shift.
The Bottom Line: Digital Sovereignty Meets Practical Multilateralism
Pakistan’s assumption of the Digital Cooperation Organization presidency arrives at a moment when digital governance feels simultaneously more urgent and more intractable than ever. The promise of technology to accelerate development and empower citizens competes with mounting evidence of surveillance capitalism, algorithmic discrimination, and the consolidation of digital power in the hands of a few platform giants.
The DCO won’t solve these dilemmas. No single organization can. But under Pakistan’s leadership, it has the opportunity to demonstrate that middle powers can craft pragmatic, culturally informed approaches to digital policy that serve their citizens’ needs without simply choosing between Washington’s market fundamentalism and Beijing’s digital authoritarianism.
Shaza Fatima Khawaja’s challenge is to convert the organization’s aspirational rhetoric into measurable progress—whether that’s thousands of newly certified tech workers, reduced cyber vulnerability across member states, or simply more robust dialogue on AI ethics that centers Global South perspectives. These would be modest achievements by the standards of revolutionary digital transformation, but meaningful ones nonetheless.
As the world fragments into competing digital blocs, the success or failure of institutions like the DCO will help determine whether technology becomes a force for global integration or further fragmentation. Pakistan’s year at the helm offers a chance to tip the scales toward cooperation. Whether Islamabad can deliver on that promise will become clear long before the next presidency rotates in February 2027.
Discover more from The Economy
Subscribe to get the latest posts sent to your email.



A single slip-and-fall lawsuit against an uninsured small business can wipe out years of profit in one settlement — yet a large share of small business owners still operate without even basic general liability coverage, often simply because no one ever explained clearly what’s actually required versus optional.
Business insurance isn’t a single product — it’s a category spanning general liability, workers’ compensation, professional liability, commercial property, and more, each protecting against different risks. Figuring out which coverage your specific business actually needs, and what it should reasonably cost, is one of the most commonly delayed and misunderstood decisions small business owners face.
This guide breaks down the core types of business insurance, current 2026 cost benchmarks, and how to build the right coverage package without overpaying.
How Business Insurance Actually Works: The Core Coverage Types
Most small businesses don’t need every type of commercial insurance — the right combination depends heavily on industry, whether you have employees, and whether you interact with the public or handle client data.
Key takeaway: General liability insurance isn’t legally required in most states, but it’s often necessary to secure a client contract, obtain a business license, or sign a commercial lease — meaning many business owners end up needing it as a practical requirement of doing business, even without a legal mandate.
The Core Business Insurance Types
- General liability insurance — covers third-party bodily injury, property damage, and personal injury claims arising from your business operations.
- Workers’ compensation insurance — required in most states once you hire employees, covering medical costs and lost wages for work-related injuries.
- Professional liability insurance (errors & omissions) — protects service-based businesses against claims of negligence, mistakes, or failure to deliver promised services.
- Commercial property insurance — covers physical business assets (equipment, inventory, the building itself) against fire, theft, and other covered perils.
- Business Owner’s Policy (BOP) — bundles general liability and commercial property coverage into a single, typically discounted policy.
- Cyber liability insurance — increasingly essential for businesses handling customer payment data or sensitive personal information.
Step-by-Step: Building Your Business Insurance Package
- Assess your specific risk profile — client-facing businesses, those with employees, and those handling sensitive data each face different primary risks.
- Determine legal and contractual requirements — workers’ comp is state-mandated once you have employees, and many commercial leases and client contracts require proof of general liability coverage.
- Get quotes for a Business Owner’s Policy first, since bundling liability and property coverage is typically more cost-effective than purchasing separately.
- Add specialized coverage as needed — professional liability for advice-based businesses, cyber liability for data-handling businesses, commercial auto for businesses with vehicles.
- Review coverage limits against your actual risk exposure, not just the cheapest available policy, since underinsurance can be as costly as no insurance in a serious claim.
- Reassess annually as your business grows, since coverage needs — and available discounts — change as revenue, staff count, and operations evolve.
Financial and Strategic Implications: 2026 Business Insurance Cost Benchmarks
Costs vary substantially by industry, business size, and claims history, but understanding typical ranges helps set realistic budget expectations.
| Coverage Type | Typical Monthly Cost (2026) | Notes |
|---|---|---|
| General liability insurance | $40–$100/month for most small businesses | Median new-customer rate around $55/month per Progressive Commercial data |
| Workers’ compensation | $45–$70/month median, varies heavily by industry risk | Office-based businesses pay far less than construction or manual-labor industries |
| Business Owner’s Policy (BOP) | $57–$150/month | Bundled liability + property, typically cheaper than separate policies |
| Professional liability (E&O) | Varies by profession and revenue | Higher for advice-heavy professions (consulting, financial services, healthcare-adjacent) |
Expert insight: Most small businesses pay roughly $500 to $2,000 a year for general liability or a BOP, with total costs climbing meaningfully once workers’ compensation, commercial auto, or professional liability are added — meaning a realistic total insurance budget should account for the full coverage stack your business actually needs, not just a single policy.
Why Cost Varies So Much by Industry
A home-based bookkeeper and a residential construction crew face fundamentally different risk profiles, and insurers price accordingly. A small consulting firm with a clean claims history might pay $750 to $1,200 per year for general liability coverage, while a construction company with similar revenue could pay $3,000 to $5,000 or more for the same coverage type, reflecting the materially higher claims frequency and severity in higher-risk industries.
Bundling and Discount Strategies
Bundling multiple policies with a single insurer commonly produces automatic discounts of 10% to 15%, and choosing a higher deductible — when cash flow allows — can meaningfully lower monthly premiums for businesses confident in their ability to absorb a modest out-of-pocket cost in the event of a claim.
How to Choose the Right Business Insurance
- Start with a Business Owner’s Policy if you qualify — most small businesses without significant specialized risk exposure fit within a standard BOP more cost-effectively than piecing together separate policies.
- Don’t skip workers’ compensation once you hire employees — it’s legally required in nearly every state and the penalties for non-compliance can be severe.
- Get quotes from at least three insurers, since — as with other insurance categories — identical coverage can price very differently between carriers for the same business profile.
- Work with an independent broker for complex risk profiles, since brokers can shop multiple insurers and identify industry-specific coverage gaps a single-carrier quote might miss.
- Review your policy annually as your business changes — added employees, new locations, or expanded services can all create coverage gaps if the policy isn’t updated.
- Don’t assume a personal umbrella policy covers business activity — business risks generally require dedicated commercial coverage, and mixing personal and business insurance can leave real gaps.
Key takeaway: The businesses that get burned by inadequate insurance are rarely the ones that skipped coverage entirely — they’re far more often the ones that bought a policy years ago and never revisited it as the business grew, leaving real gaps between what’s covered and what the business now actually does.
Future Outlook: Business Insurance Trends Through 2027
- “Social inflation” continues to pressure premiums upward. Rising litigation costs and larger jury awards continue to put upward pressure on general liability premiums nationally, a trend insurers refer to as social inflation, meaning even businesses with clean claims histories may see gradual rate increases independent of their own risk profile.
- Cyber liability coverage is shifting from optional to expected. As data breach costs and regulatory penalties continue rising, more commercial leases, client contracts, and vendor agreements are beginning to require proof of cyber liability coverage alongside traditional general liability.
- Digital-first insurers continue to compress quote-to-bind timelines. More small business insurance providers now offer instant online quotes and same-day coverage, reducing a process that historically took days or weeks through a traditional broker.
- State-level regulatory divergence on liability rules continues. States with joint-and-several-liability frameworks and higher litigation rates continue to see meaningfully higher general liability premiums than lower-litigation states, reinforcing the value of location-aware comparison shopping.
Frequently Asked Questions
Is business insurance legally required?
It depends on the type. Workers’ compensation is legally required in nearly every state once you have employees, while general liability insurance is not legally mandated in most states but is frequently required by landlords, lenders, and client contracts.
What’s the difference between general liability and professional liability insurance? General liability covers third-party bodily injury and property damage claims, while professional liability (errors & omissions) covers claims of negligence, mistakes, or failure to deliver services as promised — the coverage most relevant to service and advice-based businesses.
How much does small business insurance typically cost?
Most small businesses pay roughly $500 to $2,000 a year for general liability or a bundled Business Owner’s Policy, with total costs increasing once workers’ compensation, professional liability, or commercial auto coverage is added.
What is a Business Owner’s Policy (BOP)?
It’s a bundled policy combining general liability and commercial property coverage into a single, typically discounted package, well-suited to most small businesses without highly specialized risk exposure.
Do I need cyber liability insurance for a small business?
Increasingly yes, particularly if your business handles customer payment information or sensitive personal data, as data breach costs and related legal exposure have grown substantially in recent years.
Discover more from The Economy
Subscribe to get the latest posts sent to your email.
Executive Summary & Key Takeaways
The global macroeconomic landscape is defined by monetary policy shifts, technological supply chain realignments, and shifting demographic dynamics. According to official economic monitoring by the International Monetary Fund (IMF World Economic Outlook) and the World Bank Group, global GDP exceeds $125 trillion in nominal terms.
- Top Position: The United States maintains its position as the largest nominal economy at $32.38 trillion, driven by tech innovation, resilient consumer demand, and deep capital markets, as highlighted by the U.S. Bureau of Economic Analysis.
- PPP Leader: China dominates Purchasing Power Parity (PPP) with an output of $44.30 trillion, reflecting its massive industrial capacity and domestic consumption scale.
- European Dynamics: Germany holds the 3rd spot nominally ($5.45 trillion), navigating energy transitions and industrial re-tooling ahead of Japan ($4.38 trillion).
- Emerging Growth Engines: India leads among major emerging markets with real GDP growth expanding above 6.4%, positioning it to challenge top-tier positions over the coming decade.
Global GDP Ranking Matrix: Top 10 Economies
Below is a comparative breakdown of the top 10 economies, combining Nominal GDP, PPP GDP, Nominal GDP Per Capita, and Real GDP Growth Rates aggregated from primary statistical repositories including Eurostat and the Federal Reserve Economic Data (FRED).
| Rank | Country | Nominal GDP (USD)∣PPPGDP(Int.) | Nominal GDP Per Capita | Real Growth Rate (%) | Key Dominant Sector |
| 1 | United States | $32.38 Trillion | $32.38 Trillion | $94,430 | 2.32% |
| 2 | China | $20.85 Trillion | $44.30 Trillion | $14,874 | 4.41% |
| 3 | Germany | $5.45 Trillion | $6.41 Trillion | $65,303 | 0.79% |
| 4 | Japan | $4.38 Trillion | $7.26 Trillion | $35,703 | 0.72% |
| 5 | United Kingdom | $4.26 Trillion | $4.72 Trillion | $61,056 | 0.80% |
| 6 | India | $4.15 Trillion | $18.90 Trillion | $2,813 | 6.48% |
| 7 | France | $3.60 Trillion | $4.73 Trillion | $52,083 | 0.86% |
| 8 | Italy | $2.74 Trillion | $3.87 Trillion | $46,505 | 0.52% |
| 9 | Russia | $2.66 Trillion | $7.53 Trillion | $18,525 | 1.09% |
| 10 | Brazil | $2.64 Trillion | $5.23 Trillion | $12,313 | 1.91% |
In-Depth Profile of the Top 10 Economies
1. United States
- Nominal GDP: $32.38 Trillion | PPP GDP: $32.38 Trillion | Per Capita: $94,430
- Growth Rate: 2.32%
- Economic Analysis: The U.S. economy remains the world’s chief financial powerhouse. Its growth is underpinned by flexible labor markets, dominant technology giants, and capital allocation mechanisms tracked by the Federal Reserve System. The nation’s strength in artificial intelligence, software infrastructure, biotechnology, and energy self-sufficiency shields it against foreign supply chokepoints.
- Macro Risk: High national debt levels and elevated interest rates aimed at controlling service-sector inflation.
2. China
- Nominal GDP: $20.85 Trillion | PPP GDP: $44.30 Trillion | Per Capita: $14,874
- Growth Rate: 4.41%
- Economic Analysis: China is the world’s industrial foundation and the largest economy measured by Purchasing Power Parity. According to global trade documentation from UNCTAD, China leads in global manufacturing export volumes, electric vehicle supply chains, solar tech, and rare earth processing.
- Macro Risk: Real estate market structural adjustments, local government debt debt-servicing burdens, and demographic headwinds from an aging workforce.
3. Germany
- Nominal GDP: $5.45 Trillion | PPP GDP: $6.41 Trillion | Per Capita: $65,303
- Growth Rate: 0.79%
- Economic Analysis: Germany serves as the industrial core of the European Union. Supported by a specialized network of medium-sized industrial leaders (Mittelstand), Germany excels in high-precision engineering, chemical processing, and industrial machinery.
- Macro Risk: Transitioning away from historically cheap pipeline gas toward green hydrogen/renewable infrastructure, combined with structural labor shortages.
4. Japan
- Nominal GDP: $4.38 Trillion | PPP GDP: $7.26 Trillion | Per Capita: $35,703
- Growth Rate: 0.72%
- Economic Analysis: Known for technological innovation and precision manufacturing, Japan benefits from high foreign assets, advanced robotics, and heavy domestic research investment. Trade flows published by the OECD iLibrary highlight Japan’s high value-add manufacturing integration across Asia and the Americas.
- Macro Risk: Persistent demographic contraction and high public debt-to-GDP ratios managed by the Bank of Japan.
5. United Kingdom
- Nominal GDP: $4.26 Trillion | PPP GDP: $4.72 Trillion | Per Capita: $61,056
- Growth Rate: 0.80%
- Economic Analysis: The UK relies heavily on services, which account for roughly 80% of total economic output. London remains one of the world’s premier financial centers, excelling in asset management, insurance, cross-border fintech, and legal services.
- Macro Risk: Supply-chain re-anchoring post-Brexit and sluggish domestic capital investment rates.
6. India
- Nominal GDP: $4.15 Trillion | PPP GDP: $18.90 Trillion | Per Capita: $2,813
- Growth Rate: 6.48%
- Economic Analysis: India is the world’s fastest-growing major economy. Driven by rapid digital public infrastructure expansion, nationwide transport investments, and expanding manufacturing under global supply chain diversification strategies (“China + 1”), India is rapidly scaling up both domestic consumption and industrial exports.
- Macro Risk: Job creation for a massive young workforce and infrastructure expansion bottlenecks.
7. France
- Nominal GDP: $3.60 Trillion | PPP GDP: $4.73 Trillion | Per Capita: $52,083
- Growth Rate: 0.86%
- Economic Analysis: France operates a diversified economy featuring strong tourism, aerospace (Airbus), luxury consumer conglomerates (LVMH, Kering), and nuclear energy generation. Its low-carbon electricity grid provides cost-stability advantages over neighboring industrial markets.
- Macro Risk: Public deficit management and rigid labor market structural adjustments.
8. Italy
- Nominal GDP: $2.74 Trillion | PPP GDP: $3.87 Trillion | Per Capita: $46,505
- Growth Rate: 0.52%
- Economic Analysis: Italy’s economy relies on an export-oriented manufacturing base in its northern regions, specializing in luxury automobiles, industrial automation, pharmaceutical production, and high-end textiles.
- Macro Risk: Public sector debt servicing and structural regional economic disparities between North and South.
9. Russia
- Nominal GDP: $2.66 Trillion | PPP GDP: $7.53 Trillion | Per Capita: $18,525
- Growth Rate: 1.09%
- Economic Analysis: Russia’s economy is anchored by natural resources, defense-industrial state expenditures, and energy commodity exports to non-Western trading partners across Eurasia and Africa.
- Macro Risk: International financial restrictions, currency volatility, and sanctions-driven technology supply constraints.
10. Brazil
- Nominal GDP: $2.64 Trillion | PPP GDP: $5.23 Trillion | Per Capita: $12,313
- Growth Rate: 1.91%
- Economic Analysis: Brazil dominates Latin America’s economic landscape, propelled by agricultural exports (soybeans, beef, sugar), iron ore extraction via Vale, deepwater oil exploration, and a sophisticated fintech banking sector.
- Macro Risk: Fiscal deficit volatility and vulnerability to global commodity price cycles.
Methodology: How Economic Output is Measured
Evaluating economic scale requires understanding three primary economic indicators:
                  ┌────────────────────────────────────────────────┐
                  │          Gross Domestic Product (GDP)          │
                  └───────────────────────┬────────────────────────┘
                                          │
            ┌─────────────────────────────┼─────────────────────────────┐
            ▼                             ▼                             ▼
┌───────────────────────┐     ┌───────────────────────┐     ┌───────────────────────┐
│     Nominal GDP       │     │        PPP GDP        │     │    GDP Per Capita     │
├───────────────────────┤     ├───────────────────────┤     ├───────────────────────┤
│ Expressed in current  │     │ Adjusted for local    │     │ Total output divided  │
│ USD exchange rates.   │     │ purchasing power.     │     │ by population.        │
│ Identifies global     │     │ Reflects internal     │     │ Measures average      │
│ capital power.        │     │ economic scale.       │     │ living standard.      │
└───────────────────────┘     └───────────────────────┘     └───────────────────────┘
- Nominal GDP (Current Prices in USD): Measures the market value of all final goods and services produced within a country in a given year. Nominal values convert domestic output using prevailing market exchange rates. While ideal for assessing international purchasing power, it fluctuates with currency market swings.
- Purchasing Power Parity (PPP): Adjusts for relative price levels and local living costs using an international basket of goods. According to data methodology guides from the Bank for International Settlements (BIS), PPP offers a realistic view of domestic production capability and domestic consumer capacity.
- GDP Per Capita: Divides total economic output by total population. This distinguishes between sheer economic scale (e.g., India or China) and individual living standards (e.g., Switzerland, Luxembourg, or the United States).
Key Takeaways for Global Economic Trends
- The Shift Toward Multipolar Growth: Asia’s expanding market share—led by China, India, Indonesia, and Vietnam—continues to outpace global growth averages, shifting the center of gravity of manufacturing and consumption.
- Energy Transition Dynamics: Nations with sovereign clean tech supply chains (China) or independent nuclear grids (France) gain structural cost advantages over those dependent on imported fossil fuels.
- Demographics vs. Productivity: Aging populations across Europe and East Asia mean future expansion depends heavily on capital deployment into automation, AI infrastructure, and high-margin service exports.
Discover more from The Economy
Subscribe to get the latest posts sent to your email.

When a company delivery van, rideshare car, or work truck causes a crash, the driver behind the wheel is rarely the only party who should be paying — and knowing how to reach the employer’s insurance is often the difference between a modest payout and full compensation.
Commercial vehicle accidents cover a much broader category than semi-trucks: delivery vans, utility trucks, company fleet sedans, rideshare vehicles operating commercially, and contractor pickups all fall under this umbrella. What unites them legally is a single concept — employer liability — that most injury victims don’t realize applies to their case until an experienced commercial vehicle accident lawyer explains it.
This guide covers how liability, insurance, and settlement value work when the at-fault vehicle was being operated for business purposes, and what separates a commercial vehicle claim from an ordinary car accident case.
How Commercial Vehicle Liability Actually Works
The foundational legal doctrine in these cases is respondeat superior — Latin for “let the superior answer” — which holds an employer liable for the negligent acts of an employee committed within the scope of employment. In practice, this means a delivery company, contractor, or fleet operator can be held directly responsible for a crash caused by one of its drivers while on the job.
Key takeaway: The critical legal question in almost every commercial vehicle case is scope of employment — was the driver performing a work-related task at the time of the crash? A driver commuting to work is generally not “on the job” for liability purposes, but a driver making a delivery, running a work errand, or operating a company vehicle during business hours almost always is.
Common Categories of Commercial Vehicle Accidents
- Delivery and courier vehicles — package delivery vans, food delivery drivers, and freight couriers under tight scheduling pressure.
- Rideshare and taxi services — vehicles operating under a transportation network company’s commercial insurance policy while a passenger is booked or in transit.
- Contractor and utility vehicles — construction, plumbing, electrical, and utility company trucks, often involving employer negligence in vehicle maintenance or driver training.
- Company fleet vehicles — sales reps, service technicians, or any employee driving a business-owned or business-leased vehicle during work duties.
- Government and municipal vehicles — a distinct category with different procedural rules, since claims against government entities typically require a formal notice of claim within a short statutory window.
Step-by-Step: Establishing a Commercial Vehicle Claim
- Confirm employment and scope-of-employment status. Was the driver clocked in, performing a delivery, or otherwise acting on the employer’s behalf?
- Identify the correct commercial insurance policy. Commercial auto policies typically carry far higher limits than personal auto policies and may be layered with an umbrella policy.
- Investigate independent negligence by the employer. Beyond vicarious liability, the company itself may be liable for negligent hiring, inadequate training, unsafe scheduling, or poor vehicle maintenance.
- Preserve dispatch and telematics records. Many commercial fleets use GPS tracking and driver-behavior monitoring that can independently establish speed, braking, and route data at the time of the crash.
- Negotiate against corporate defense counsel. Companies typically deploy experienced defense attorneys and adjusters from the outset, which is precisely why matching legal representation matters.
Financial and Strategic Implications: What Commercial Coverage Means for Claim Value
Commercial auto insurance policies are structured very differently from personal auto policies, and that difference is often the single biggest driver of settlement size.
| Vehicle/Driver Type | Typical Commercial Liability Coverage | Key Liability Consideration |
|---|---|---|
| Personal auto (for comparison) | Often as low as state-mandated minimums (commonly $25,000–$50,000 per person) | Single-driver negligence only |
| Rideshare/TNC vehicle (passenger in car) | Commonly $1 million combined single limit while a ride is active | Coverage tier depends on driver app status at time of crash |
| Delivery/courier company vehicle | Often $500,000–$1 million or more | Employer vicarious liability plus potential negligent-hiring claim |
| Contractor/utility fleet vehicle | Often $500,000–$1 million, sometimes higher with umbrella coverage | Maintenance and training records frequently central to liability |
| Interstate trucking (for comparison) | Federally mandated $750,000–$5 million depending on cargo | FMCSA regulatory framework applies |
Expert insight: Rideshare cases are particularly nuanced — coverage tiers change depending on whether the driver’s app was off, on but waiting for a ride request, or actively transporting a passenger. Identifying the correct coverage tier at the moment of the crash is often the first and most consequential step in the claim.
Contingency Fees and Case Costs
As with most personal injury practice areas, commercial vehicle accident lawyers typically work on contingency, commonly in the 25%–40% range, with no upfront cost to the client and case expenses advanced by the firm and reimbursed from the recovery.
Statutes of Limitations Still Apply — and Can Be Shorter Against Government Entities
Personal injury statutes of limitations generally range from one to six years depending on the state, with most states falling between two and three years. However, claims against a government-operated commercial vehicle (a municipal bus, a city utility truck) frequently require a formal notice of claim within a much shorter window — sometimes as little as 90 days — making prompt legal consultation essential when a public entity is involved.
How to Choose the Right Commercial Vehicle Accident Lawyer
- Experience against corporate and institutional defendants — this is materially different from negotiating with an individual driver’s personal insurer.
- Familiarity with the relevant industry — rideshare, delivery logistics, construction fleets, and municipal vehicles each carry distinct insurance structures and regulatory frameworks.
- Investigative resources for telematics and dispatch data — GPS logs, dash-cam footage, and driver-app data are often decisive evidence and can be difficult to obtain without formal legal process.
- A track record of pursuing employer negligence claims, not just driver negligence — this is frequently where the largest additional recovery is found.
- Transparent, written contingency-fee terms confirmed at the initial consultation, which is standard and free across the industry.
Key takeaway: The biggest mistake injury victims make in commercial vehicle cases is accepting a quick settlement offer from the driver’s personal insurer before confirming whether the vehicle and driver were covered under a separate, much larger commercial policy.
Future Outlook: Commercial Vehicle Liability Trends Through 2027
- E-commerce delivery volume continues to expand fleet exposure. As last-mile delivery growth persists, delivery-vehicle crash claims — against both dedicated courier companies and gig-economy delivery platforms — represent a growing share of commercial vehicle litigation.
- Telematics and dash-cam evidence are becoming standard in litigation. More fleets now equip vehicles with continuous recording and driver-behavior scoring, giving plaintiff attorneys richer evidence but also giving defense counsel new tools to contest fault.
- Rideshare insurance-tier disputes remain a frequent litigation flashpoint. Coverage-tier ambiguity at the moment of a crash continues to generate disputes between transportation network companies and their insurers, directly affecting how quickly injury victims are compensated.
- Nuclear verdicts in commercial fleet cases are prompting earlier settlements. As with trucking litigation, a pattern of large jury verdicts against corporate fleet operators has made insurers more willing to settle high-exposure claims before trial.
Frequently Asked Questions
Can I sue a company if their employee caused my accident? Generally yes. Under the doctrine of respondeat superior, employers can be held liable for crashes caused by employees acting within the scope of their employment, in addition to any direct negligence by the company itself, such as inadequate driver training.
Is a rideshare accident treated differently than a regular car accident? Yes. Rideshare accidents involve tiered insurance coverage that depends on whether the driver’s app was off, on and waiting, or actively transporting a passenger at the time of the crash, which directly affects which policy and coverage limit applies.
What if the commercial vehicle was owned by the government? Claims against government-operated vehicles typically require a formal notice of claim within a much shorter deadline than standard personal injury statutes of limitations, sometimes as little as 90 days, making prompt legal action critical.
How is a commercial vehicle accident settlement different from a personal auto accident settlement? Commercial vehicles typically carry substantially higher insurance limits than personal auto policies, and cases often involve additional claims against the employer for negligent hiring, training, or maintenance, which can increase total recoverable compensation.
Do commercial vehicle accident lawyers charge upfront fees? No. Most work on a contingency-fee basis, typically 25%–40% of the recovery, with no payment required unless the case succeeds.
Discover more from The Economy
Subscribe to get the latest posts sent to your email.

Solar Panel Installation Cost in 2026: Why the Math Changed Overnight

Business Insurance: What Coverage You Actually Need and What It Costs in 2026

Auto Insurance Quotes: How to Get the Lowest Rate Without Losing Coverage

Huntington Online Banking: Full Features, Fees, and How It Compares in 2026

Apply for a Bank Account Online: What You Need and How Long It Actually Takes

World’s Largest Economies: Ranking the Top Global Powers

Business Loan: A Complete 2026 Guide to Rates, Types, and Qualifying

Fast Invoice Factoring: How to Turn Unpaid Invoices Into Cash Within 24 Hours

Investment Banking Services: What They Cost and How to Choose the Right Firm in 2026

Structured Settlement Loan: What “Cash Now” Offers Actually Cost You

DUI Attorney: Why Your First Call After an Arrest Should Never Be to the Court

Personal Injury Lawyer: A Complete Guide to Filing Your Claim in 2026

Commercial Vehicle Accident Lawyer: Holding Companies Accountable Beyond the Driver

Inside the White House Feud: How Trump’s Allies Are Painting Anthropic’s Dario Amodei as the Face of ‘AI Doomerism’

Top 30 Stocks for Investment in PSX for Massive ROI in 2026

SpaceX Starship Flight 14: First Orbital Attempt & Starlink V3 Launch Explained

Oil Prices Break $100 in 2026: Middle East Conflict & Energy Markets

Fidelity Investments Review 2026: SPAXX Yields & Zero-Fee Funds

AI Chip Stocks 2026: The Best Semiconductor Investments Beyond Marvell

BRICS+ Cross-Border Payments 2026: Interoperability Explained

Tween Back-to-School Trends 2026: What’s Driving the $85B Season

10-Year Treasury Yield Hits 4.80%: What It Means for Rates & Portfolios

Shein Clothes Quality & Safety in 2026: What Lab Tests Show

China’s US$10.8 Billion Trade Shortcut: Why the Pinglu Canal Matters

MRVL Earnings 2026: Why Marvell Sank Despite Beating Estimates

IMF & World Bank 2026 Global Economic Outlook: Growth, Inflation, Debt

High-CPM Finance Niches 2026: Publisher Monetization Blueprint

Middle East War Economics 2026: Oil Prices & Energy Markets
-

 Markets & Finance9 months ago
Top 15 Stocks for Investment in 2026 in PSX: Your Complete Guide to Pakistan’s Best Investment Opportunities
-

 Analysis7 months ago
Johor’s Investment Boom: The Hidden Costs Behind Malaysia’s Most Ambitious Economic Surge
-

 Analysis7 months ago
Top 10 Stocks for Investment in PSX for Quick Returns in 2026
-

 Banks8 months ago
Best Investments in Pakistan 2026: Top 10 Low-Price Shares and Long-Term Picks for the PSX
-

 Analysis8 months ago
Brazil’s Rare Earth Race: US, EU, and China Compete for Critical Minerals as Tensions Rise
-

 Investment9 months ago
Top 10 Mutual Fund Managers in Pakistan for Investment in 2026: A Comprehensive Guide for Optimal Returns
-

 Global Economy9 months ago
15 Most Lucrative Sectors for Investment in Pakistan: A 2025 Data-Driven Analysis
-

 Global Economy9 months ago
Pakistan’s Export Goldmine: 10 Game-Changing Markets Where Pakistani Businesses Are Winning Big in 2025