
Analysis
How Iran Is Making a Mint from Donald Trump’s War

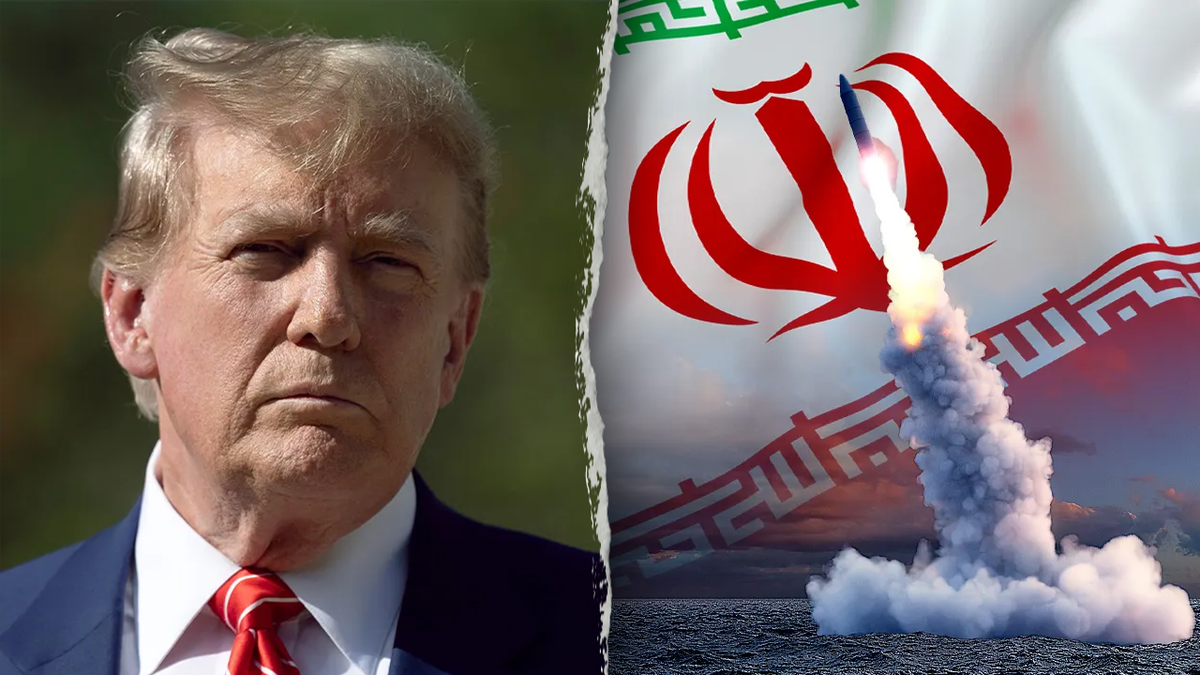
China is helping the Revolutionary Guards profit from Iranian crude while Gulf petro-monarchies bleed.
There is a perverse irony at the heart of the Third Gulf War, one that neither the White House nor Riyadh seems eager to advertise. The conflict that Donald Trump and Benjamin Netanyahu launched on February 28, 2026—Operation Epic Fury, as the Pentagon branded it with characteristic bravado—was intended, among other things, to crush Iran’s economy and end the clerical regime’s capacity to project power. Instead, in one of the more audacious reversals in the modern history of energy geopolitics, how Iran is making a mint from Donald Trump’s war has become one of the most consequential and underreported stories of the year. While Saudi Arabia hemorrhages an estimated $488 million per day in lost export revenue and Kuwait, Iraq, and Qatar face an existential crisis of clogged storage and severed export routes, Tehran’s oil machine is quietly steaming ahead—eastward, in the dark, at scale.
The mechanism is elegant in its cynicism: Iran declared the Strait of Hormuz closed to commercial traffic, and then proceeded to use that same strait as its own private export corridor.
The Selective Blockade: A Two-Tier System the World Has Never Seen
When the Islamic Revolutionary Guard Corps announced on March 2, 2026, that the Strait of Hormuz was closed, markets convulsed, oil prices screamed past $100 per barrel for the first time in four years, and the global energy establishment scrambled. What followed was not a blanket closure. It was something far more sophisticated.
Tanker tracking data from UANI and Vortexa tells the real story: while approximately 90 percent of commercial tanker traffic through the strait collapsed, Iranian-linked vessels and a curated selection of Chinese-owned ships continued transiting with impunity. The IRGC, which controls the naval assets patrolling the world’s most valuable 34-kilometer-wide corridor, has effectively created a two-tier access system—one lane for geopolitical allies, and one that fires warning shots at everyone else.
UANI’s tanker tracker recorded 46.9 million barrels of physical Iranian crude exports in January 2026 alone, averaging 1.51 million barrels per day. Even after the blockade’s onset, Vortexa estimates that the shadow fleet has sustained between 1.3 and 1.6 million barrels per day in export throughput. The arithmetic is damning. Saudi Arabia, which before the war moved approximately 5.5 million barrels per day through Hormuz—roughly 38 percent of all crude flowing through the strait—has seen those flows throttled to a trickle. Gulf states and Iraq collectively are losing approximately $1.1 billion per day in oil revenue while their storage tanks fill to capacity and their oil wells face mandatory shut-ins. Iran, by contrast, earns an estimated $910 million per week from its China-bound crude—at war premiums.
The IRGC’s Windfall: Who Is Actually Cashing In
Understanding who profits requires understanding who controls the oil fields. The IRGC is not merely Iran’s ideological vanguard. It is a vertically integrated economic empire that has progressively absorbed control of Iran’s hydrocarbon sector through front companies, affiliated construction firms, and direct management of key fields since the early 2000s.
According to research cited by the Atlantic Council’s Global China Hub, the IRGC now controls or benefits from up to around 50 percent of Iran’s oil export revenues—revenues that flow directly into military operations, regional proxy networks from Hezbollah to the Houthis, and the procurement of drone components through Chinese transshipment networks. Before the war, that figure already represented tens of billions of dollars annually. In a wartime environment characterized by $90-plus Brent prices, the numbers have stratosphered.
The IRGC’s business model has also evolved dramatically from the crude sanctions-evasion of the early 2010s. What once required improvised, expensive workarounds has become, in the words of Vortexa’s maritime intelligence team, “the institutionalisation of sanctions evasion”—a repeatable, hardened supply chain connecting sanctioned Iranian fields to Chinese refiners with the operational efficiency of a functioning commercial logistics network. Voyage durations, once an erratic 85–90 days due to evasive routing, have compressed to a stable 50–70-day window as fleet coordination has matured.
The Shadow Fleet Goes Mainstream: Iran’s Ghost Armada Takes Center Stage
For years, the shadow fleet was a diplomatic embarrassment—something Washington sanctioned at press conferences and analysts tracked with satellite imagery, but which persisted regardless. The war has transformed it into something more dramatic: a state-protected naval convoy operating under the IRGC’s direct military umbrella.
The architecture of the system is now well-documented, even if its full financial scope remains deliberately opaque. Iran moves its crude through what the U.S. Treasury has described as “a sprawling network of tankers and ship management firms.” Ships change names and flags with bureaucratic frequency, falsify cargo records, manipulate AIS transponder signals, and conduct ship-to-ship transfers at sea to launder the oil’s origin. Ownership is buried in front companies layered across jurisdictions from Hong Kong to Panama to the UAE—a financial matryoshka that frustrates even sophisticated sanctions investigators.
The fleet’s composition is aging and motley—many vessels are older tankers that have been quietly absorbed into Iran’s orbit as mainstream operators retired them under Western insurance pressure. But as the Middle East Institute has noted, sanctioned crude now represents an estimated 18 percent of global tanker capacity. The shadow fleet is not a fringe phenomenon. It is, increasingly, a structural feature of the global oil market.
What has changed since February 28 is that these tankers no longer need to conduct elaborate evasive maneuvers in the open sea. With the IRGC Navy controlling the strait and Iranian-linked vessels receiving safe passage, the shadow fleet has effectively graduated from clandestine operator to semi-official state shipping line—a remarkable institutional evolution achieved, paradoxically, through the very war designed to destroy it.
China’s Teapot Architecture: The Financing Engine Behind Tehran’s War Chest
The demand side of this equation is where the story becomes most revealing—and most uncomfortable for Beijing’s carefully cultivated narrative of neutral peacemaking.
China absorbs approximately 90 percent of Iran’s exported oil. The primary vehicle for this trade is not the state oil majors—Sinopec and CNPC maintain a degree of calculated distance from sanctioned Iranian barrels, wary of exposure to the U.S. financial system. Instead, the trade flows through an archipelago of small, independent refineries in Shandong Province known colloquially as “teapots”—named for their modest operational footprint relative to the integrated giants.
The teapot label implies independence. The reality is considerably more enmeshed with the Chinese state. Research by Kharon, drawing on corporate registry data, has documented how refineries like Hebei Xinhai Chemical Group—which U.S. Treasury alleged received roughly $500 million in Iranian crude—maintain joint ventures with state-owned enterprises and host senior executives from CNPC subsidiaries at annual meetings. These are not rogue actors operating in a regulatory vacuum. They are semi-private nodes in a system that provides Beijing with what analysts at the Atlantic Council’s GeoEconomics Center have called “plausible deniability”—smaller refiners pose limited systemic risk if sanctioned individually, while the broader flow is protected by China’s refusal to recognize U.S. extraterritorial sanctions jurisdiction.
The financial plumbing is equally crucial. Payments flow in yuan through BRICS-adjacent settlement mechanisms, bypassing the SWIFT dollar system entirely. The mBridge cross-border payment platform—developed by the central banks of China, Hong Kong, Thailand, and the UAE—has provided a viable infrastructure for settling large hydrocarbon transactions outside U.S. visibility. As the U.S.-China Economic and Security Review Commission has documented, Chinese customs authorities do not officially record Iranian oil imports; the barrels enter Chinese data as Malaysian, Omani, or Emirati crude. The statistical laundering is as sophisticated as the physical kind.
The Numbers That Tell the Real Story
The asymmetry of this conflict’s energy economics is staggering when rendered in concrete figures:
- Saudi Arabia’s revenue loss: approximately $488 million per day in blocked crude exports; over $3.4 billion per week, before accounting for oil infrastructure damage from Iranian missile strikes.
- Iran’s estimated export earnings: approximately $910 million per week from China-bound crude, at wartime elevated prices.
- Gulf states’ collective revenue loss: approximately $1.1 billion per day with a prolonged closure scenario putting up to $3.5 trillion of global GDP at risk.
- Oil production curtailments: Kuwait, Iraq, Saudi Arabia, and the UAE collectively dropped output by a reported 6.7 million barrels per day by March 10—rising to at least 10 million barrels per day by March 12, according to economic impact assessments.
- Global supply shock: The IEA’s March 2026 Oil Market Report describes this as “the largest supply disruption in the history of the global oil market,” with global oil supply projected to plunge by 8 million barrels per day in March.
- Brent crude peak: $126 per barrel, the highest since the post-Ukraine spike, before easing to around $92 at time of writing.
- Iran’s shadow fleet throughput: 1.3 to 1.6 million barrels per day sustained, with voyage durations normalized to 50–70 days.
The game theory here is brutal. Every additional week of the blockade costs Saudi Arabia roughly $3.4 billion. Iran, earning its $910 million per week while paying no export costs to Hormuz transit (it controls the transit), is not just weathering the war—it is, in a narrow and grimly practical sense, winning its economic dimension.
The Gulf Monarchies’ Trap: Revenue Crisis Meets Infrastructure Vulnerability
For the Gulf petro-monarchies, the economic pain extends beyond lost export revenue. The architecture of their economies—built on the assumption of permanent, frictionless Hormuz access—has been revealed as catastrophically fragile.
Saudi Arabia retains partial bypass capacity through the East-West Pipeline, which runs to the port of Yanbu on the Red Sea. But its maximum capacity of roughly 5 million barrels per day cannot compensate for the blockage of 5.5 million barrels daily that previously flowed east through Hormuz. Iraq and Kuwait have no alternative export routes whatsoever. Qatar, which declared force majeure on all LNG exports following the closure, cannot redirect its gas through any overland alternative.
The consequences for Gulf state budgets are severe. Saudi Arabia’s Vision 2030 transformation program—its ambitious bet on diversifying away from hydrocarbon dependence—was predicated on sustained oil revenues funding the transition. A prolonged Hormuz crisis does not merely slow that program; it potentially reverses the fiscal preconditions that make it viable. Deutsche Welle has reported that Gulf states are unlikely to sustain high levels of investment spending during or after the war.
Iran, by calculated contrast, entered this conflict having spent years building precisely for this scenario. In the fifteen days before the February 28 strikes, Tehran increased crude loadings to approximately three times its normal rate, aggressively building offshore floating storage as a buffer. The U.S.-China Economic and Security Review Commission noted a marked increase in Iranian tankers anchored in Chinese coastal waters in the run-up to the conflict—an estimated 40 million barrels in “floating storage” positioned to sustain Chinese refinery throughput through any initial disruption.
The Strategic Logic: Tehran’s Asymmetric Masterstroke
Strip away the ideological language, and what the IRGC has engineered is a textbook asymmetric economic weapon—one that turns the adversary’s greatest strength (control of regional military dominance) into a liability, while converting Tehran’s own apparent vulnerability (dependency on a single export route) into a tool of selective leverage.
The Strait of Hormuz doctrine, in its current form, achieves several objectives simultaneously. It denies Gulf Arab competitors their export revenues. It elevates global oil prices, maximizing the per-barrel value of Iran’s own exports. It demonstrates to China—Tehran’s indispensable economic patron—that Iran can maintain the oil supply line Beijing requires, even under wartime conditions, thereby deepening the dependency that guarantees Chinese political protection at the UN Security Council. And it imposes catastrophic macroeconomic costs on the United States and Europe—the Dallas Fed estimated that even a single-quarter Hormuz closure raises WTI prices to $98 per barrel and reduces global real GDP growth by an annualized 2.9 percentage points—without Iran firing a single missile at American soil.
UNCTAD’s analysis of the disruption’s knock-on effects catalogues collateral damage extending into fertilizer markets (urea prices up 50 percent since the war began), aluminum, helium, and global food supply chains. The IEA has described the overall situation as “the greatest global energy security challenge in history.” Iran did not cause all of this damage through military superiority. It caused it through geography, preparation, and the patient construction of an alternative energy order centered on China.
The Sanctions Paradox: Maximum Pressure Meets Maximum Adaptation
There is a painful irony embedded in this crisis for the Trump administration specifically. The president’s reinstatement of “maximum pressure” sanctions in February 2025—including the February 2026 designation of another dozen shadow fleet vessels—was predicated on choking Iran’s oil revenues to zero. The administration’s National Security Presidential Memorandum explicitly directed a “robust and continual campaign… to drive Iran’s export of oil to zero, including exports of Iranian crude to the People’s Republic of China.”
The war has not achieved this objective. It has, in several measurable respects, made it harder to achieve. The IRGC, now operating as a naval power controlling the world’s most critical shipping lane, has converted its ghost fleet from a liability—a network of aging tankers running evasive maneuvers—into a protected strategic asset. Sanctioning individual vessels becomes less operationally meaningful when those vessels transit under naval escort. The Middle East Institute has noted that sanctioned crude now represents nearly a fifth of global tanker capacity, a scale at which the erosion of U.S. sanctions architecture becomes structural, not episodic.
China’s posture compounds the problem. Beijing has maintained its studied neutrality publicly—casting itself, in the words of its official communications, as an “outside force of peace.” Privately, Kharon’s research confirms, the teapot network and its state-adjacent financial infrastructure continue absorbing Iranian crude with undiminished appetite. China has too much invested in cheap Iranian oil—and too much strategic interest in Iran’s survival as a counterweight to American regional power—to do otherwise.
Forward Scenarios: Three Paths from Here
Scenario One: Short War, Lasting Damage. If a ceasefire emerges within the next two to four weeks, the Hormuz blockade ends, and commercial shipping resumes. Gulf state revenues recover. But the structural damage to Gulf petro-monarchies’ fiscal positions, investment pipelines, and reputational standing as “safe” destinations for capital will persist for years. Iran’s shadow fleet emerges battle-tested and operationally mature. The IRGC has demonstrated the selective blockade doctrine works. The next confrontation will be conducted with this playbook on the table.
Scenario Two: Prolonged Closure. A multi-quarter closure, as modeled by the Dallas Fed with a probability-weighted impact of $98 WTI and a 2.9-percentage-point annualized hit to global GDP growth in Q2 2026, triggers a full-spectrum supply crisis. Asian economies—Japan sources 93 percent of its oil through Hormuz, South Korea 68 percent—face rationing. European gas markets, already at 30 percent storage capacity following the harsh 2025-2026 winter, suffer a second energy crisis. Iran, insulated by floating storage and the China lifeline, outlasts the economic pain far longer than Western policymakers anticipate.
Scenario Three: A New Energy Architecture. The crisis permanently accelerates the fragmentation of global energy markets into two distinct spheres—a Western-aligned system and a parallel Eurasian system centered on Chinese demand, yuan settlement, and BRICS-adjacent infrastructure. Iranian oil, Russian oil, and Venezuelan oil converge into a single sanctioned-but-flowing alternative supply chain. The dollar-based sanctions regime, already strained by the scale of circumvention, loses further enforceability. The shadow fleet becomes the shadow system.
The Longer Reckoning
The Third Gulf War is, among many other things, a stress test for the assumptions that have underpinned U.S. Middle East strategy for four decades: that military superiority translates into economic leverage, that sanctions can be scaled to achieve strategic outcomes, and that the Gulf’s pro-Western monarchies represent a stable, reliable pillar of the American-led order.
All three assumptions are under pressure simultaneously. The Gulf monarchies are not stable—they are bleeding. Sanctions have not achieved their stated objective—they have been absorbed and adapted to. And military superiority has not prevented Iran from constructing an asymmetric economic counter-strategy of remarkable sophistication.
What Iran has demonstrated, at enormous human cost to itself and the region, is that a determined, sanctions-experienced, strategically patient state—one with a willing great-power patron in Beijing and a geography that sits astride the world’s most critical energy chokepoint—can survive and, in narrow economic terms, briefly thrive within a war launched to destroy it.
The Revolutionary Guards are not winning the Third Gulf War in any conventional sense. But while the missiles fly and the Gulf monarchies’ coffers drain, Tehran’s oil is still flowing east, the yuan payments are still clearing, and the ghost fleet is still moving through a strait that the IRGC has, for now, made its own. That is a form of wartime profit that no amount of airpower has yet managed to interdict—and that the architects of Operation Epic Fury appear to have catastrophically underestimated.
The global energy security implications of the 2026 Hormuz crisis will shape oil market architecture for a generation. As ceasefire negotiations remain stalled, the most consequential question is not which side wins the military engagement—it is which energy order emerges from its ashes.
Discover more from The Economy
Subscribe to get the latest posts sent to your email.



Key Takeaways
- Rolex’s secondary market rose approximately 7.9% year-over-year as of 2026 (per WatchCharts data) — trailing Patek Philippe (+16.2%) and Tudor (+11.4%) but still outperforming Audemars Piguet (+3.4%).
- Rolex raised U.S. retail prices 4–9% in January 2026 (steel models ~5.6%, gold models ~8.7%), narrowing the historical gap between retail and pre-owned pricing.
- Not every model appreciates: steel sports references (Submariner, GMT-Master II, Daytona) have held value far better than two-tone or widely available dress references like the standard Datejust.
- The Lady-Datejust posted the sharpest 2026 gain among tracked collections — up 22.73%, from roughly $9,269 to $11,376 — driven by demand for smaller, “everyday luxury” watches.
- Gold’s rise past $2,400/oz has directly lifted the investment case for Rolex’s precious-metal references (Day-Date, Sky-Dweller, Yacht-Master).
The Model-by-Model Picture
| Category | 2026 Trend |
|---|---|
| Lady-Datejust | +22.73% (strongest performer among tracked collections) |
| Steel sports models (Submariner, GMT-Master II) | Held value well; corrected from 2022 peak but stabilized above retail |
| Daytona | Corrected from highs above $50,000 to the mid-$30,000s; still among the most sought-after references |
| Two-tone/widely available Datejust | Flat to negative — “holds value” is an overstatement for this category |
| Gold references (Day-Date, Sky-Dweller) | Lifted by gold’s rise above $2,400/oz |
Why the “Rolex Always Appreciates” Myth Is Fading
The pandemic-era boom pushed some references — the Daytona above all — to speculative highs disconnected from historical norms. Since the March 2022 peak, steel sports models have compressed meaningfully, and dealers who bought inventory near the top have in some cases faced 20–40% markdowns on liquidation. The lesson for 2026 buyers: Rolex as a category is not a monolith. Value retention depends heavily on specific reference, condition, and whether the piece comes with box and papers (“full set”).
What’s Actually Driving 2026 Strength
- Retail price increases raise the floor. When a new Submariner retails at $10,050 (up from $9,500), a pre-owned example at $11,000–$12,000 suddenly represents a smaller premium — narrowing the gap without secondary prices actually moving.
- Supply discipline remains Rolex’s core lever. The brand has never confirmed production numbers, and secondary-market premiums remain entirely a function of Rolex’s own manufacturing decisions — a risk factor as much as a support.
- Certified Pre-Owned rollout. Rolex’s now fully rolled-out CPO program has changed how buyers transact in the used market, adding a layer of brand-verified legitimacy that supports pricing.
The Case for Rolex as a Portfolio Diversifier
Financial advisors increasingly frame luxury watches not as a replacement for equities or bonds, but as a tangible, historically low-correlation diversifier — one that carries its own risks (illiquidity, condition-dependent pricing, no yield) but has demonstrated multi-decade resilience for specific references.
Is Rolex a good investment in 2026?
It depends heavily on the specific reference. Steel sports models like the Submariner and Daytona have held or grown in value; two-tone and widely available dress models generally have not. Overall, Rolex’s secondary market rose about 7.9% year-over-year in 2026, trailing Patek Philippe but ahead of Audemars Piguet.
Discover more from The Economy
Subscribe to get the latest posts sent to your email.

Navigating Mortgage and Loan Refinancing in a High-Yield Environment
Global public debt crossing critical thresholds has kept central bank policies volatile, resulting in fluctuating US Treasury yields throughout 2026. For homeowners and commercial property holders burdened by previous high-interest borrowing cycles, finding optimal refinance windows has become a high-stakes financial puzzle. Stalled disinflation and stubborn employment numbers mean rate cuts are incremental, requiring borrowers to act with precision.
Timing your mortgage or commercial loan refinance in this environment requires a deep understanding of yield curve movements and lender risk appetites.
Decoding 2026 Refinance Dynamics
The 10-Year Treasury Yield Benchmark
Mortgage rates continue to track closely with the 10-year US Treasury yield. When macroeconomic anxiety spikes debt issuance, yields rise, tightening consumer borrowing capacity. Savvy borrowers monitor weekly Treasury auctions to lock in rates during brief dip windows.
Hybrid ARMs and Alternative Structures
With fixed rates remaining elevated, 7/1 and 10/1 adjustable-rate mortgages (ARMs) have surged in popularity. These products offer lower initial monthly payments, giving borrowers breathing room until central bank easing cycles fully materialize.
| Loan Product | Current Rate Range | Best For | Key Risk Factor |
| 30-Year Fixed Mortgage | 6.2% – 6.8% | Long-term predictability | Higher initial monthly outlay |
| 7/1 Hybrid ARM | 5.5% – 5.9% | Short-term ownership / flipping | Rate reset risk after year 7 |
| Commercial Refinance | 7.0% – 8.2% | Corporate asset restructuring | Strict DSCR lender covenants |
Actionable Steps for Successful Refinancing
To maximize your chances of securing favorable refinance terms in a volatile market, follow a disciplined preparation strategy.
Boost Your Credit Score Immediately: Lenders in 2026 are applying stringent credit tiering; a 20-point increase can drop your APR by a crucial quarter-point.
Shop Regional Credit Unions: Smaller financial institutions often offer portfolio loans with more flexible underwriting than major national banks.
Calculate the Break-Even Point: Ensure your total closing costs are recouped through monthly savings within 24 months of closing.
“Market Strategist View: Refinancing in 2026 is an exercise in opportunistic timing. Borrowers must maintain immaculate financial profiles ready to strike the moment Treasury yields dip.”
Mastering the complexities of today’s debt environment ensures you can successfully lower your debt service costs and protect your long-term financial stability.
Discover more from The Economy
Subscribe to get the latest posts sent to your email.

The days of pulling generic auto insurance quotes based purely on your zip code and age are officially over. In 2026, insurance comparison engines are powered entirely by generative AI and real-time telematics. These platforms digest thousands of live data points—ranging from your driving smoothness via connected vehicle sensors to real-time traffic congestion patterns—to generate hyper-personalized premiums instantly.
For consumers, this evolution represents both a massive opportunity for savings and a hidden trap for penalty pricing. Understanding how AI algorithms evaluate risk is essential for anyone looking to lower their monthly auto insurance premiums.
How AI Comparison Engines Evaluate Your Risk Profile
Behavioral Telematics and Connected Cars
Modern cars stream performance data directly to insurance aggregators. Generative AI models analyze braking sharpness, acceleration curves, cornering G-forces, and phone distraction metrics. Drivers who maintain smooth, defensive habits are rewarded with dynamic rate cuts of up to 40% compared to traditional rating tiers.
Predictive Traffic and Weather Modeling
AI tools now cross-reference your daily commute route with predictive weather and accident probability models. If your standard parking location or driving corridor has a statistically higher incidence of uninsured motorist claims, your quotes will reflect that hyper-local risk assessment.
| Comparison Factor | Traditional Rating Model | 2026 Generative AI Model | Impact on Premium |
| Mileage & Usage | Annual estimated odometer reading | GPS tracking & live trip duration | High (up to 35% savings) |
| Driving Behavior | MVR driving record & accidents | Real-time braking, speed, & G-force | Critical (determines tier) |
| Vehicle Tech | Make, model, and safety rating | ADAS calibration & repair cost data | Moderate |
Strategies to Lower Your AI-Driven Insurance Quote
To outsmart the algorithm and secure the lowest possible premium in 2026, drivers must proactively manage their digital footprint on insurance platforms.
Opt-In for Telematics Trial Periods: Many insurers offer immediate 15% discounts just for installing their driving app; let it track safe habits for 30 days to lock in permanent savings.
Scrub Unverified Public Records: Ensure your motor vehicle report is free of clerical errors that AI risk models misinterpret as reckless behavior.
Compare AI Aggregators: Use platforms that integrate multi-carrier API feeds rather than single-brand comparison sites to find the best risk-adjusted rate.
“Industry Note: AI-driven pricing rewards transparency and precision. Drivers who actively manage their telematics data consistently out-save those relying on legacy quote calculators.”
Embracing AI comparison tools allows savvy policyholders to customize coverage limits precisely to their driving habits, eliminating wasted premium spend while ensuring robust protection.
Discover more from The Economy
Subscribe to get the latest posts sent to your email.

Stock Market Crash in 2026? Warning Signs, Scenarios and a Calm Investor Checklist

Peso Mexicano vs Dólar Estadounidense: A Practical USD/MXN Guide for October 2026

Is the Stock Market Open on Columbus Day 2026? NYSE, Nasdaq and Bonds Explained

Concert Ticket Prices in 2026: Dynamic Pricing, Fees and How to Buy Safely

High-Yield Savings Accounts in 2026: How to Compare APY Without Chasing a Headline

EU-China Trade Deal 2026: How Beijing and Brussels Avoided a Trade War—and Who Wins

Social Security 2027 COLA Announcement: Date, Formula and What Retirees Should Check

China’s AI Microdrama Boom: How Beijing Is Reshaping Global Media

Q3 2026 Earnings Preview: Can Record Profit Expectations Keep Wall Street’s Rally Alive?

Russia Diesel Deal 2026: Oil Prices and Inflation Risks

Fed Rates 2026: Treasury Yields, Bonds and SGOV Explained

S&P 500 Market Breadth 2026: Weak Rally or Rotation?

The AI Capex Boom: Data Centers Reshaping Growth

Palantir Stock in 2026: Extraordinary AI Growth

China Stocks Today: Are Big Economies in Asia Nearing a Market Bottom?

Crypto Daily Outlook: Bitcoin, Altcoins, and the Future of Decentralized Finance

Global Pension Systems Ranked: The World’s Best and Worst Retirement Frameworks

World’s Largest Economies: Ranking the Top Global Powers

Elon Musk’s Next Moves: Disrupting the 2026 Global Economy

Pakistan Economy 2026: Inside the SBP’s Balancing Act

GasBuddy Market Insights: How Crude Price Shifts Impact Local Fuel Cost Averages

Crude Oil & Petroleum Market Analysis: OPEC+ Decisions and Price Forecasts

Global Equity Market Divergence: US Tech vs. European Dividend Stocks vs. Asian Growth

IMF & World Bank Global Economic Outlook: Growth Forecasts Across Europe and Asia

Silver Price Today: Why the Xi-Trump AI Standoff Is Fueling a Safe-Haven Rally

Bitcoin Price Forecast 2026–2027: Will the 4-Year Cycle Hold?

The Future of Silicon: Supply Chain Vulnerabilities in the 2026 Tech Sector

Asian Stock Markets 2026: Japan, China, Pakistan & More
-

 Markets & Finance9 months ago
Top 15 Stocks for Investment in 2026 in PSX: Your Complete Guide to Pakistan’s Best Investment Opportunities
-

 Analysis8 months ago
Johor’s Investment Boom: The Hidden Costs Behind Malaysia’s Most Ambitious Economic Surge
-

 Analysis8 months ago
Top 10 Stocks for Investment in PSX for Quick Returns in 2026
-

 Banks9 months ago
Best Investments in Pakistan 2026: Top 10 Low-Price Shares and Long-Term Picks for the PSX
-

 Analysis8 months ago
Brazil’s Rare Earth Race: US, EU, and China Compete for Critical Minerals as Tensions Rise
-

 Investment9 months ago
Top 10 Mutual Fund Managers in Pakistan for Investment in 2026: A Comprehensive Guide for Optimal Returns
-

 Global Economy10 months ago
15 Most Lucrative Sectors for Investment in Pakistan: A 2025 Data-Driven Analysis
-

 Global Economy10 months ago
Pakistan’s Export Goldmine: 10 Game-Changing Markets Where Pakistani Businesses Are Winning Big in 2025