
Analysis
When Wars Are Chosen: The Financial Ruin and Human Wreckage of the 2026 US-Iran Conflict
The US-Iran conflict of 2026 crashed oil markets, froze the Strait of Hormuz, and pushed developing nations from Pakistan to Egypt toward economic collapse. A deep analysis of the financial and social fallout.
The Day the World Paid for a War It Did Not Choose
On the morning of March 6, 2026, Ahmed Farouk had already been waiting three hours at a petrol station on the outskirts of Cairo when an attendant walked out and hung a hand-written sign on the pump: No Diesel. Ahmed drives a freight truck for a living. No diesel means no work. No work means no bread — not for him, and not for the forty families whose weekly produce deliveries he hauls from the Nile Delta to the capital. He sat back in his cab, pulled out his phone, and read about a war being fought 2,000 kilometres away — a war, he would tell a journalist later, “that no one asked us about.”
The US-Israel strikes on Iran — launched on February 28, 2026, under the codename Operation Epic Fury — represent one of the most consequential geopolitical decisions of the decade. The immediate military objectives: to degrade Iran’s nuclear facilities and missile infrastructure. The immediate economic consequences: a supply disruption the International Energy Agency described as “the greatest global energy security challenge in history”, the closure of the Strait of Hormuz — through which roughly 20 percent of global oil demand flows daily — and a cascade of financial shocks that have pushed developing nations from Pakistan to sub-Saharan Africa to the edge of economic collapse.
This is not merely a story about oil prices. It is a story about what happens when powerful states choose war and the world’s poorest nations pay the bill.
A Familiar Architecture of Catastrophe
History has seen this before, and its lessons are rarely learned in time.
When the United States invaded Iraq in March 2003, global oil prices climbed steadily from roughly $30 per barrel toward $60 within a year, feeding inflationary pressure across import-dependent economies that were entirely peripheral to the war’s stated purposes. The 1973 Arab oil embargo — itself a retaliatory geopolitical move — triggered a global recession, destroyed a generation of Western consumer confidence, and pushed countless low-income nations into debt spirals from which some never truly recovered. Russia’s invasion of Ukraine in February 2022 sent Brent crude surging to $139 per barrel and precipitated a global food crisis that, according to the World Food Programme, drove an estimated 70 million additional people toward acute hunger.
What distinguishes the 2026 US-Iran conflict from those episodes is not its severity alone — though its severity is historically unprecedented — but its structural architecture. As analysts at Al Jazeera and the World Economic Forum have documented, prior shocks were sanctions-driven or logistical in nature, allowing for rerouting, substitution, and policy intervention. The current crisis is a physical chokepoint crisis: Iran’s retaliatory closure of the Strait of Hormuz has taken offline not merely trade routes but the very capacity of producers to export, pushing markets beyond the reach of conventional adjustment mechanisms.
The logic of escalation that produced this outcome was, in retrospect, grimly predictable. Iran — its economy already battered by sanctions, with inflation exceeding 40 percent in 2025 and its rial in freefall — had little to lose strategically by weaponizing the Strait once strikes began. Unable to match the US and Israel militarily, Tehran chose to internationalize the costs of war, targeting energy infrastructure, shipping lanes, and civilian water supplies across the Gulf. The calculation, as the World Economic Forum’s analysis put it, was blunt: raise the price of escalation until pressure for de-escalation builds.
It worked. The question is who bears the cost of that arithmetic.
The Oil Shock: Numbers That Reshape Economies
By March 4, 2026 — six days after the opening strikes — Iran had effectively closed the Strait of Hormuz to commercial tanker traffic. Brent crude, which had surged 10–13 percent to around $80–82 per barrel in the conflict’s opening days, blew past $120 per barrel as markets began pricing in sustained disruption. QatarEnergy declared force majeure on all exports. The collective oil production of Kuwait, Iraq, Saudi Arabia, and the UAE dropped by a reported 6.7 million barrels per day by March 10, and reached at least 10 million barrels per day by March 12 — the largest supply disruption in the recorded history of global oil markets, according to the IEA.
For context: the 2022 Ukraine crisis, which shocked financial markets worldwide, was primarily a sanctions-driven disruption. Producers could still pump; buyers could still source alternatives. In 2026, the pumps are still running in some Gulf fields, but the oil has nowhere to go. Oilfields forced to shut in across the region as storage capacity fills could take “days or weeks or months” to return to pre-war output levels even after a ceasefire, according to Amir Zaman of Rystad Energy — a detail that markets have begun, belatedly, to price in.
The transmission from crude markets to consumer prices is faster and more brutal than most economic models predict in real time. As certified financial planner Stephen Kates told CNBC, “unlike last year’s higher tariffs, which took months to filter meaningfully into prices, increases in oil prices are quickly reflected” — in gasoline, airline tickets, shipping costs, and anything touched by oil-based inputs. In the United States, the national average gasoline price reached $3.41 per gallon within the first week of the conflict, up $0.43. US crude prices soared more than 35 percent, posting their biggest weekly gain since crude futures began trading in 1983.
For the eurozone, the arithmetic is worse. Capital Economics projected that inflation would peak above 4 percent year-on-year in the euro area, with the ECB likely forced to reverse its rate-cutting trajectory — a painful reversal for economies still navigating post-pandemic debt burdens. Japan, which imports virtually all of its crude, faces a structural dilemma between defending the yen’s purchasing power and supporting domestic growth. Even in the United States, despite record domestic production levels, supply-chain linkages to global markets mean that price insulation is largely illusory — a decade of building export infrastructure has effectively tied American pump prices to the same global benchmarks it once sought to escape.
Equity markets reflected the shock imperfectly but unmistakably. Asian and European indices fell more sharply than US benchmarks — a pattern Frederic Schneider of the Middle East Council on Global Affairs attributed to their greater exposure to the energy crisis and thinner cushion of corporate winners in defense and oil. Russian stocks trended upward, as any oil-price shock that bypasses Moscow’s export routes functions as a windfall for the Kremlin — a grim irony of the geoeconomic landscape.
The Federal Reserve’s Impossible Dilemma
Central banks have been here before, and they have rarely found a good answer.
A supply-side energy shock presents monetary policy with a structural trap. Raising interest rates to contain the inflationary impulse risks choking economic growth and employment. Cutting rates to support activity risks pouring fuel on price pressures. The Federal Reserve, according to Morgan Stanley analysts, is likely to favor a holding pattern — smaller adjustments or outright pauses — while it watches incoming data. But the political pressure to act is enormous: with US midterm elections on the horizon, voters are acutely sensitive to gasoline prices and grocery bills, and a Reuters/Ipsos poll found only about 27 percent approval for the initial strikes.
IMF Managing Director Kristalina Georgieva, speaking at a symposium hosted by Japan’s Ministry of Finance on March 9, warned that a prolonged conflict poses an inflationary risk to the global economy that policymakers must prepare for now. The IMF’s scenarios are not comforting. Capital Economics projected that if conflict is contained to three months, Brent crude could average $150 per barrel over the following six months — a figure that, if realized, would constitute the most prolonged and severe oil price shock since the 1970s Arab embargo.
What begins as a battlefield decision hardens, in the language of financial markets, into a geoeconomic constraint: not a temporary shock to be absorbed but a restructuring of the conditions under which global growth is possible at all.
The Invisible Casualties: Fertilizer, Food, and the Coming Agricultural Crisis
Beyond the oil price charts, a slower and more devastating crisis is taking shape — one that threatens food security for hundreds of millions of people who have never heard of Operation Epic Fury.
The Strait of Hormuz handles roughly 50 percent of global urea and sulfur exports, and 20 percent of global LNG trade — the latter a critical feedstock for nitrogen-based fertilizers. Since the strait’s effective closure, fertilizer exports from the Persian Gulf have dropped precipitously. According to Morningstar projections reported by Reuters, nitrogen fertilizer prices could roughly double from 2024 levels, while phosphate prices may rise by approximately 50 percent.
The timing is catastrophic. These disruptions are coinciding with the Northern Hemisphere’s spring planting season — the window in which farmers in South Asia, the Middle East, and sub-Saharan Africa must apply fertilizers to secure yields for the year. The World Food Programme’s deputy executive director Carl Skau has warned bluntly: “In the worst case, this means lower yields and crop failures next season. In the best case, higher input costs will be included in food prices next year.”
There is no cavalry coming. China, the world’s largest nitrogen and phosphate fertilizer producer, is prioritizing domestic supply and is unlikely to resume urea shipments before May. Russian plants are already running near full capacity. As Máximo Torero, the UN Food and Agriculture Organization’s chief economist, told NPR: “The loss of Gulf exports creates an immediate global shortfall with no quick substitutes.” Unlike oil, there are no strategic international fertilizer stockpiles to release.
Even short delays matter enormously at the farm level. Research from Zambia cited by agricultural analysts suggests that delayed fertilizer application can reduce maize yields by approximately 4 percent per season — a figure that may sound modest in aggregate but translates, at scale, into tens of millions of people facing inadequate caloric intake during the 2026–27 harvest cycle.
The Developing World at the Breaking Point
The architecture of the global economy is not neutral. It distributes the costs of distant decisions in ways that fall heaviest on those least responsible for them.
Pakistan: The Arithmetic of Austerity
In Lahore, motorcyclists queue for hours at filling stations. Pakistan — a country still recovering from the 2022 floods that ravaged a third of its national territory, and from an IMF bailout process that has demanded painful fiscal consolidation — is among the most acutely exposed economies in the world to this particular shock. The government has raised state-controlled energy prices by 20 percent, instituted a four-day work week for public offices, and closed educational institutions for two weeks to conserve fuel. As Khalid Waleed of the Sustainable Development Policy Institute told Al Jazeera, “diesel is the backbone of Pakistan’s freight and agricultural economy. Trucking costs have started climbing, and that will feed into everything from flour to fertiliser in the weeks ahead.”
Pakistan’s foreign exchange reserves were already thin before the conflict. The rupee — like most emerging market currencies — has come under renewed pressure as global investors flee to dollar-denominated safe assets. Pakistan may need to roll over around $1 billion in outstanding eurobonds in the coming year, a burden that becomes structurally harder as the dollar strengthens. Plants producing fertilizer domestically have, in some cases, been forced to halt production entirely as natural gas prices spike. A country already on the edge of balance-of-payments crisis is now absorbing a simultaneous fuel shock, food production threat, and capital outflow.
Bangladesh: Universities Dark, Queues at Every Pump
Bangladesh, which imports approximately 95 percent of its oil and receives roughly 25 percent of the natural gas that fuels its power plants from Qatar, is facing what analysts at Yale’s School of Management have termed an existential energy dependency crisis. The government has closed all universities to conserve electricity, anticipating power shortages as the country’s LNG supply from Qatar has been effectively interrupted. Petrol pumps in some districts have run dry despite fuel rationing measures. The Bangladesh Petroleum Corporation has imposed per-vehicle refueling limits.
These are not abstract economic statistics. They are the contours of daily life for 170 million people, many of whom were only recently climbing toward middle-income status — a fragile trajectory that this war is now threatening to reverse.
Egypt: Suez Losses, Currency Collapse, and the Emergency Declaration
Egypt occupies a uniquely painful position in this crisis. As one of the region’s largest energy importers and most indebted economies, the country was already navigating a grueling IMF stabilization program when the war began. Now it faces simultaneous pressure from multiple directions.
The Egyptian pound has depreciated more than 8 percent against the US dollar since the conflict’s opening days. Reduced traffic through the Suez Canal — caused by war-related shipping disruptions — is costing the country approximately $10 billion in losses according to World Bank estimates. Egypt provides extensive fossil fuel subsidies to its population; with global prices surging, those subsidies have become fiscally unsustainable, but unwinding them risks triggering street-level inflation and political instability. President el-Sisi has ordered malls and cafes to close by 9pm, cut back public lighting, and described his country’s economy as being in a “state of near-emergency.”
Egypt needs to roll over more than $4 billion in outstanding eurobonds within the next year. Against the backdrop of currency depreciation, energy price inflation, and capital outflow, the mathematics of that debt servicing are becoming precarious. The Centre for Global Development in Washington has placed Egypt explicitly on its watch list of countries at serious risk of fiscal crisis if the conflict continues.
Sub-Saharan Africa: Fiscal Buffers Already Gone
The countries least equipped to absorb this shock are those already operating without fiscal margin. Janes analysts have identified Burkina Faso, Burundi, the Central African Republic, the Democratic Republic of Congo, Liberia, and Mozambique as particularly vulnerable — countries that entered this crisis with depleted buffers, high petroleum import reliance, and deep pre-existing poverty.
For smallholder farmers in East Africa, the fertilizer crisis is already tangible. Stephen Muchiri, a Kenyan maize farmer and CEO of the Eastern African Farmers Federation — which represents 25 million smallholders — notes that early heavy rains have left a narrow planting window. Fertilizer shortages and price hikes are forcing farmers to apply less, with knock-on consequences for yields. The UN World Food Programme has explicitly warned that disruptions are driving long-term global food price increases that could replicate or exceed the severity of the 2022 food crisis.
The Remittance Rupture
One dimension of the developing-world impact has received insufficient attention: the collapse of Gulf remittances. Workers in Gulf countries — predominantly from South Asia, Southeast Asia, and sub-Saharan Africa — collectively send home $88 billion annually, according to Centre for Global Development analysis. Egypt, Pakistan, and Jordan each receive more than 4 percent of GDP from Gulf remittances. Nepal and the Philippines receive remittances equivalent to over 25 percent of GDP, with Qatar and the UAE among the largest sources.
As large infrastructure projects in the Gulf are paused or abandoned and the mass evacuation of foreign residents accelerates in the wake of strikes on civilian infrastructure, the construction and service workers who sustain these remittance flows are returning home to economies that cannot absorb them. The social implications — families losing their primary income source, children pulled from school, small businesses shuttered — unfold quietly and are rarely captured in GDP data.
Beyond Economics: The Social Fractures That Wars Ignite
The social implications of this US-Iran conflict 2026 economic impact extend well beyond macroeconomic metrics. They are written on the faces of children eating half-rations in Karachi, on the ledgers of microfinance institutions in Cairo watching loan repayment rates collapse, and in the decisions of families in Dhaka calculating whether to pull their daughters out of school to reduce household expenses.
Research consistently demonstrates that energy and food price shocks have non-linear social effects. The standard economic framing — inflation reduces real income, which reduces consumption — captures only the mechanical surface. What it misses is the deeper structural damage: the interruption of educational trajectories, particularly for girls in societies where female schooling is the first casualty of household fiscal stress; the acceleration of child labor; the erosion of community savings structures that took years to build; the triggering of migration decisions that become permanent.
A Centre for Global Development analysis has documented the risk explicitly: governments facing the double bind of depleted fiscal buffers and surging import costs will initially attempt to subsidize households. “However, with depleted fiscal buffers and shrinking revenues, this becomes unsustainable. The ensuing austerity, combined with hyperinflation, can trigger widespread social unrest and a full-blown fiscal crisis.”
History offers no reassurance here. The Arab Spring of 2010–2012 was preceded by a spike in global wheat prices — itself a product of drought and the Ukraine-Russia breadbasket disruption of that period. The bread riots that preceded Tunisia’s uprising began in the produce markets of provincial towns, not in ideological seminars. What is happening in Egypt, Pakistan, Jordan, and sub-Saharan Africa today is not categorically different in structure. The question is not whether social pressure will build, but how quickly, and whether governments have the legitimacy and institutional capacity to manage it.
The humanitarian crisis in the Gulf adds another layer of complexity. Iranian strikes on desalination plants — which provide 99 percent of drinking water in Kuwait and Qatar — have turned an economic crisis into an existential one for those societies. The mass evacuation of foreign residents from Gulf cities is not only a human tragedy; it is the collapse of the labor architecture that underpins the entire remittance economy stretching from Kathmandu to Nairobi.
Scenarios: The Fork in the Road
Scenario One: Short, Contained Conflict (Resolution within 4–6 Weeks)
If a ceasefire is reached and Iran reopens the Strait within the next month, Capital Economics projects that Brent crude would fall back sharply toward $65 per barrel by year-end. Inflation pressures would ease, emerging market currencies would stabilize, and the fertilizer supply shock — while severe — would be partially mitigated by late-season planting. The economic damage to developing nations would be significant but potentially recoverable with targeted international support. The political damage to the United States — domestically and globally — would be harder to quantify.
Scenario Two: Prolonged Conflict (3–6 Months or Longer)
The scenario that keeps economists awake. If oil prices average $150 per barrel over the next six months, the global inflationary impulse would be comparable to or exceed the 1973 oil shock. The IMF’s emergency financing mechanisms would be overwhelmed by simultaneous requests from multiple vulnerable economies. Fertilizer shortages would translate directly into crop failures across South Asia and sub-Saharan Africa during the 2026–27 harvest cycle. The WFP estimates that this could push tens of millions of people into acute food insecurity. In countries like Bangladesh, Pakistan, and Egypt, fiscal crises would likely materialize, triggering IMF programs that impose the kind of austerity that historically precedes political upheaval.
The IEA has assessed the current episode as the largest supply disruption in the history of the global oil market — larger than the 1973 embargo, larger than the post-Ukraine disruption. In Scenario Two, the tools used in 2022 — diversification, rerouting, strategic reserve releases — simply do not apply. The chokepoint is physical, not logistical.
Policy: What Needs to Happen, and Quickly
The Centre for Global Development’s prescriptions are clear and urgent. The IMF must deploy rapid financing facilities at scale — potentially including a revived Food Shock Window — for vulnerable economies unable to self-finance through this shock. The World Bank should mobilize IDA crisis response financing and consider frontloading IDA 21 disbursements. The G20, under the US presidency, should convene an emergency discussion of debt service relief for the most exposed countries.
For the longer term — a horizon that this crisis has brutally compressed — the lesson is energy system architecture. The 1979 Iranian Revolution drove Japan’s aggressive energy-efficiency transformation; the 2022 Ukraine crisis accelerated European renewable energy investment. The 2026 conflict has simultaneously exposed the dangerous physical concentration of global hydrocarbon flows in a single strait and the absence of any serious equivalent in fertilizer markets. Both vulnerabilities require structural remedies that no amount of military power can substitute for.
Djibouti’s finance minister Ilyas M. Dawaleh put it with unvarnished directness: the fighting will “bring severe economic consequences for developing countries” — nations that had no seat at the table when the decision for war was made, no vote on the calculus of Operation Epic Fury, and no mechanism to claim compensation for the losses now accruing in their petrol queues, their darkened universities, and their half-planted fields.
The Broader Lesson Wars Will Not Teach Themselves
Ahmed Farouk, the Cairo freight driver, eventually got diesel — three days later, from a black-market reseller at nearly double the official price. He passed the cost on in his next delivery, which passed it on to the market vendors, which passed it on to families who were already spending 60 percent of their income on food. By the time the price of a war 2,000 kilometres away reaches a household budget in a Cairo apartment building, it has traveled through oil futures, currency markets, shipping logistics, fertilizer supply chains, and grocery store shelves. It has been amplified, invisibly, at every step.
This is the hidden accounting of intentional and authoritative wars — the ledger that appears in no military briefing, no presidential authorization, no congressional resolution. The formal costs of war are denominated in strategic objectives, casualty counts, and defense budgets. The real costs are denominated in rupees and Egyptian pounds and Zambian kwacha, in missed harvests and interrupted schooling and remittances that no longer arrive.
The International Energy Agency’s description of this crisis as the “greatest global energy security challenge in history” is not hyperbole. It is a precise description of a structural reality: that the world has built an energy system so concentrated in a single 33-kilometre-wide strait that one country’s retaliation for a war it did not start can disrupt the livelihoods of hundreds of millions of people across three continents.
History will record what happened on February 28, 2026. Whether it will also record what was done to prevent the next time — whether the financial and social devastation now radiating outward through developing economies will catalyze the energy system reform, the multilateral financing architecture, and the diplomatic frameworks that might reduce the cost of the next crisis — remains an open and urgent question.
Wars, as the developing world knows better than anyone, rarely end when the shooting stops. Their economic afterlife can last a generation.
References
Al Jazeera. (2026, March 8). Iran war threatens prolonged impact on energy markets as oil prices rise. Al Jazeera. https://www.aljazeera.com/news/2026/3/8/iran-war-threatens-prolonged-impact-on-energy-markets-as-oil-prices-rise
Al Jazeera. (2026, March 16). The tell-tale signs: How bad has the Iran war hit the global economy? Al Jazeera. https://www.aljazeera.com/news/2026/3/16/the-tell-tale-signs-how-bad-has-the-iran-war-hit-the-global-economy
Al Jazeera. (2026, March 23). Why the oil and gas price shock from the Iran war won’t just fade away. Al Jazeera. https://www.aljazeera.com/opinions/2026/3/23/why-the-oil-and-gas-price-shock-from-the-iran-war-wont-just-fade-away
Al Jazeera. (2026, March 25). From Pakistan to Egypt: Iran war drives up fuel prices in the Global South. Al Jazeera. https://www.aljazeera.com/economy/2026/3/25/from-pakistan-to-egypt-iran-war-drives-up-fuel-prices-in-the-global-south
Center for American Progress. (2026). The war in Iran will raise fuel prices and costs throughout the economy. https://www.americanprogress.org/article/the-war-in-iran-will-raise-fuel-prices-and-costs-throughout-the-economy/
Centre for Global Development. (2026). Will the Iran war be the breaking point for vulnerable countries? https://www.cgdev.org/blog/will-iran-war-be-breaking-point-vulnerable-countries
CNBC. (2026, March 10). Iran war spikes oil prices — what consumers need to know. CNBC. https://www.cnbc.com/2026/03/10/iran-war-spikes-oil-prices-consumers.html
Deloitte Insights. (2026). Iran and Middle East conflict: Impacts on the global economy. Deloitte. https://www.deloitte.com/us/en/insights/topics/economy/iran-middle-east-conflict-impacts-global-economy.html
International Food Policy Research Institute. (2026). The Iran war: Potential food security impacts. IFPRI. https://www.ifpri.org/blog/the-iran-war-potential-food-security-impacts/
Janes Defence Intelligence. (2026). Iran conflict 2026: Disruption to Strait of Hormuz increases energy and food production risks. Janes. https://www.janes.com/osint-insights/defence-and-national-security-analysis/iran-conflict-2026-disruption-to-strait-of-hormuz-increases-energy-and-food-production-risks
Morgan Stanley. (2026). Iran war, oil prices, inflation, and the stock market. Morgan Stanley Wealth Management. https://www.morganstanley.com/insights/articles/iran-war-oil-inflation-stock-market-2026
NPR. (2026, March 20). How the Iran war threatens global food supply. NPR. https://www.npr.org/2026/03/20/nx-s1-5750812/how-the-iran-war-threatens-global-food-supply
U.S. News & World Report. (2026, March 26). The war in Iran sparks a global fertilizer shortage and threatens food prices. U.S. News. https://www.usnews.com/news/business/articles/2026-03-26/the-war-in-iran-sparks-a-global-fertilizer-shortage-and-threatens-food-prices
Washington Post. (2026, March 12). Iran, the economy, oil, gas, and inflation. The Washington Post. https://www.washingtonpost.com/business/2026/03/12/iran-economy-oil-gas-inflation/
Wikipedia. (2026). Economic impact of the 2026 Iran war. Wikimedia Foundation. https://en.wikipedia.org/wiki/Economic_impact_of_the_2026_Iran_war
World Economic Forum. (2026, March). The global price tag of war in the Middle East. WEF. https://www.weforum.org/stories/2026/03/the-global-price-tag-of-war-in-the-middle-east/
Yale School of Management. (2026). What are the consequences of the Iran war for the developing world? Yale Insights. https://insights.som.yale.edu/insights/what-are-the-consequences-of-the-iran-war-for-the-developing-world
Discover more from The Economy
Subscribe to get the latest posts sent to your email.


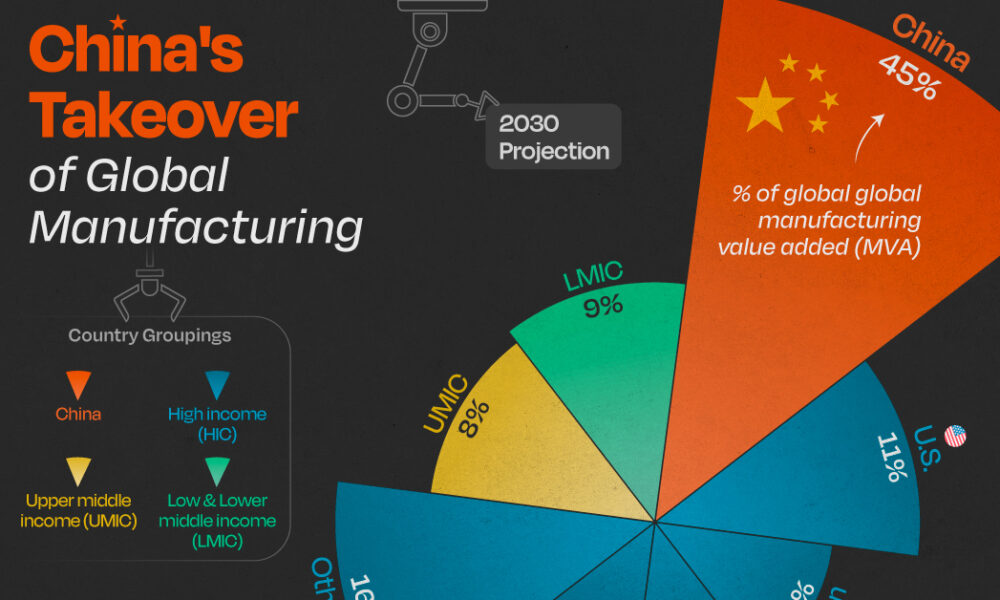
China’s exports have been the good-news story in an otherwise mixed economic picture. They’re not just holding up; through the first four months of 2026 they were running about 14% to 15% above the same period a year earlier, according to figures cited by the US-China Economic and Security Review Commission and Vanguard’s economic outlook. That’s the kind of number that would normally signal a healthy economy. The complication is what’s happening underneath it.
A growth model showing its age
Manufacturing capacity utilization fell to 73.9% in early 2026 — near a decade low outside of the pandemic shutdowns, per the Commission’s bulletin. That’s the tell. China is producing and shipping more, but a growing share of its industrial base is running under capacity, which points to a structural mismatch: the country’s manufacturing engine has outgrown both its domestic consumption and, increasingly, what the rest of the world is willing to absorb without pushback.
Goldman Sachs Research, in a report cited by Goldman Sachs’ own analysis, forecasts 4.8% real GDP growth for 2026 — above consensus expectations of 4.5% — driven substantially by continued export strength and a softening drag from the property downturn. But that same report flags the labor market as a genuine weak spot: hiring, measured across a weighted average of PMI employment sub-indexes, is at its most depressed level in a decade outside Covid, and urban nominal wage growth slowed to just 3.8% year-on-year in Q3 2025.
Why Beijing isn’t reaching for stimulus
Given the export strength, one might expect policymakers to feel less urgency about consumption-side stimulus. That’s roughly what’s happening — and it’s a deliberate choice, not an oversight. Xi Jinping’s government remains committed to dominating high-value manufacturing, which means comprehensive fiscal stimulus aimed at consumers remains unlikely even as domestic demand stays soft, according to the Commission’s bulletin.
The People’s Bank of China is expected to hold its policy rate steady through the rest of the year, preferring targeted structural tools over a broad-based rate cut, per Vanguard’s forecast. That’s a notably cautious stance given how weak the property sector remains — property investment indicators are down 50% to 80% from their 2020–21 peaks, and a “meaningful domestic-demand turnaround remains elusive,” in Vanguard’s own words.
The regulatory push to keep capital at home
Two moves by Chinese regulators in mid-2026 point to where Beijing’s real priority sits: keeping household savings and private capital funneled toward domestic industrial policy rather than flowing overseas. New rules taking effect July 1 restrict outbound investment that could be used to export restricted technology or expertise under the guise of ordinary capital flows, with violations carrying fines, visa restrictions and industry blacklisting, according to the Commission’s bulletin. The regulations follow Beijing’s move to block the founders of AI firm Manus from completing a sale to Meta, even after the company had relocated its headquarters from China to Singapore — a signal that Beijing is willing to reach across borders to keep promising tech assets tethered to domestic or Hong Kong listings.
The currency and trade angle
Goldman’s team makes an out-of-consensus call worth flagging: it expects China’s current account surplus to rise to 4.2% of GDP in 2026, up from 3.6% in 2025, while the broader analyst consensus surveyed by Bloomberg expects a decline to 2.5%. The divergence comes down to export resilience — falling export prices are making Chinese goods more competitive even as the yuan is expected to appreciate slightly, with export-price inflation in dollar terms forecast to turn positive, rising to 0.7% from -2.7% the prior year.
The bottom line
China’s economy in 2026 is a study in contrasts: robust headline export growth sitting on top of underutilized factories, a weak labor market, and a property sector still in its fifth year of decline. The World Bank’s own baseline, published in its country program materials, projects growth moderating toward 4.0% by 2026 — a more conservative read than Goldman’s. Either way, the consensus across forecasters is the same: exports are carrying more of China’s growth than is healthy for the long run, and Beijing’s policy choices this year suggest it’s betting on technological dominance to eventually solve the demand problem, rather than opening the stimulus taps to solve it directly.
Discover more from The Economy
Subscribe to get the latest posts sent to your email.
There’s a number that keeps showing up in every conversation about Pakistan’s economy, and it keeps getting bigger: circular debt. As of early July 2026, the gas sector’s share of that debt alone has topped Rs 3.44 trillion, and Islamabad has missed a deadline the IMF set for tariff reforms meant to arrest the slide, according to Dawn.
What circular debt actually is, and why it won’t go away
Circular debt is the chain of unpaid obligations that builds up when the price consumers pay for electricity or gas doesn’t cover what it actually costs to produce and deliver it. Someone in the chain — a power producer, a gas utility, a state-owned enterprise — ends up carrying an IOU, and that IOU gets passed down the line. Earlier this year, IMF officials pressed Pakistan on exactly this dynamic, questioning the government’s plan to zero out gas-sector circular debt, according to Aaj English. At the time, officials said around Rs 150 billion remained payable to companies including Oil and Gas Development Company Limited and Pakistan Petroleum Limited.
Islamabad’s proposed fix included a Rs 5-per-unit levy on gas, dividends from state-owned companies redirected toward debt reduction, and the sale of 35 LNG cargoes annually on the international market. The IMF, per that same reporting, raised pointed questions about whether the plan was actually viable.
The commitments Pakistan has already made
Under its Extended Fund Facility, Pakistan has committed to capping circular debt growth at Rs 300 billion for FY2027 and cutting power-sector subsidies from 0.7% of GDP to 0.6%, according to details reported by ProPakistani. The government has also shifted Nepra’s annual tariff-rebasing cycle from July to January, and Ogra now revises gas tariffs twice a year instead of once.
Structurally, some of this is working. The IMF’s own review in May 2026 credited Pakistan with a primary fiscal surplus of 1.6% of GDP for FY26, broadly in line with program targets, and noted gross reserves had climbed to $16 billion by end-December, up from $14.5 billion six months earlier, according to the IMF’s own press release. That progress unlocked roughly $1.1 billion under the EFF and $220 million under a parallel climate-resilience facility, bringing total disbursements under the two arrangements to about $4.8 billion.
Where the fault lines actually are
The uncomfortable part of this story, laid out by commentary reported in The Hans India, is that revenue targets get IMF scrutiny with great precision, while structural reform of loss-making public enterprises — Pakistan International Airlines and Pakistan Steel Mills chief among them — moves far more slowly. Those enterprises’ losses are absorbed by the national exchequer through subsidies, guarantees, and debt restructuring year after year, and privatization plans keep slipping because the political cost of confronting them is high.
Distribution company inefficiency compounds the problem. In FY25, Discos posted Rs 265 billion in losses, an improvement on FY24’s Rs 276 billion but still a substantial drag, according to Geo News, with Quetta, Peshawar and Hyderabad among the worst-performing utilities.
What happens if the pattern holds
Pakistan’s debt-to-GDP ratio sits between 70% and 80% as of 2026, according to Wikipedia’s economic summary, with debt servicing occasionally consuming two-thirds of government spending. That’s the backdrop against which every circular-debt conversation happens: there is very little fiscal room left to absorb another missed deadline.
The missed gas tariff deadline doesn’t automatically trigger a program breakdown — Pakistan has weathered similar friction points before during its current EFF arrangement. But with the IMF’s own documentation showing persistent concern about the credibility of debt-reduction plans, and with global energy prices still elevated in the aftermath of the Iran war, the margin for further slippage is thin. The next review will likely hinge less on the rhetoric around reform and more on whether the Rs 5 levy and LNG cargo sales actually show up in the numbers.
Discover more from The Economy
Subscribe to get the latest posts sent to your email.
Analysis
Malaysia Bets Its 2026 on “Execution” — And the Semiconductor Upcycle Is Doing the Heavy Lifting

Malaysia’s government has declared 2026 a year of “execution” and “discipline” as the Anwar Ibrahim administration races to deliver on the 13th Malaysia Plan (RMK13) ahead of elections that could come as early as February 2028, according to Fortune’s interview with economy minister Akmal Nasrullah Mohd Nasir.
A Strong Base to Build From
Malaysia’s economy grew 4.9% in 2025 following 5.1% growth the year before, with unemployment falling to 2.9% — the lowest in a decade — and the ringgit trading at its strongest level in five years. HSBC’s ASEAN economist Yun Liu forecasts 4.6% growth for 2026, citing strength in electrical equipment manufacturing, tourism, and sound government policy, while Nomura economists have projected an even more bullish 5.2%, pointing to infrastructure spending under RMK13.
The ASEAN+3 Macroeconomic Research Office (AMRO) projects growth moderating slightly to 4.6% from an estimated 4.9% in 2025, describing Malaysia’s performance as reflecting its “entrenched position in global semiconductor and electronics value chains” and the broader global tech upcycle, according to AMRO’s assessment of Malaysia’s investment upcycle.
Navigating Washington Without Picking Sides
Malaysia’s trade relationship with the US has been turbulent. Washington imposed 25% tariffs on Malaysian goods in April 2025, rattling the country’s export-led economy, before a deal reduced US duties to 19% in exchange for Malaysia lowering tariffs on select American products, with exemptions carved out for aviation components and electrical equipment. Malaysia’s trade hit a record high of more than 3 trillion ringgit (roughly $780 billion) last year despite the friction.
Deputy finance minister Liew Chin Tong has framed Malaysia’s positioning explicitly around neutrality: the country is “not China, not the US,” a stance he argues gives Malaysia a strategic advantage in both geopolitical and supply-chain terms, according to Fortune’s reporting from the Forum Ekonomi Malaysia summit.
Capital Is Flowing In — From Everywhere
Malaysia recorded 22.8 billion ringgit (about $5.8 billion) in foreign direct investment in the first quarter of 2026, a 6.0% year-on-year increase, moderating from the prior quarter’s 48.7% surge. Inflows into information and communication technology services remained particularly strong, with China, Hong Kong, and Singapore serving as the primary capital sources, according to McKinsey’s Southeast Asia quarterly economic review. Bank Negara Malaysia has held its policy rate steady following a pre-emptive 25 basis-point cut in July 2025, with headline inflation projected to average just 2.0% in 2026.
The Long Game: Semiconductors, Rare Earths, and Nuclear Power
Beyond RMK13’s near-term targets, Malaysian officials are positioning the country’s industrial strategy around decades, not years. Minister Akmal has reiterated commitments to eliminate coal use by 2044 and reach net zero by 2050, while confirming Malaysia is actively “exploring the potential” of nuclear power to meet the energy demands of its expanding data-center and semiconductor sectors. AMRO’s structural policy guidance urges Malaysia to develop domestic semiconductor and rare-earth capabilities as a hedge against ongoing US-China “geoeconomic fracturing,” positioning the country as a trusted neutral hub for global manufacturers diversifying away from concentrated exposure to either superpower.
Discover more from The Economy
Subscribe to get the latest posts sent to your email.

China Economy 2026: Export Growth Masks Manufacturing Overcapacity

Pakistan Iran-US Ceasefire Mediation 2026: Diplomatic Gains, Economic Risks

Pakistan Circular Debt Crisis 2026: IMF Deadline Missed, Rs 3.44 Trillion

Indonesia Russian Oil Imports 2026: Why Jakarta Is Diversifying Crude Supply

Russia Bans Diesel Exports 2026: Global Fuel Market Impact Explained

Gulf Sovereign Wealth Funds Hit Record $53.9B in H1 2026 Despite Iran War

America’s Workers Are Vanishing From the Labor Force — And It’s Not the Usual Reasons

ASEAN+3 Enters 2026 From a Position of Strength — But Two Storms Are Building Offshore

US Tariff Investigation 2026: 60 Countries, Forced Labor Claims and the EU Trade Fight

UK Digital Identity Framework 2026: The £5bn Plan to Reshape Financial Verification

The Money Is Drying Up: How US Pressure Is Choking Off Russia-China Payment Channels

Indonesia GDP Growth 2026: 5.61% Expansion Marks Fastest Pace in Three Years

Singapore Makes Its Move to Become Asia’s Precious-Metals Capital

Malaysia Bets Its 2026 on “Execution” — And the Semiconductor Upcycle Is Doing the Heavy Lifting

Top 20 PSX Stocks for Investment in 2027: Your Complete Guide to Pakistan’s Best Investment Opportunities

Investors Pile Into Bullish Dollar Bets as ‘US Exceptionalism’ Trade Returns

Carry Trade Unwind 2026: How the Yen’s Snapback Triggered a Global Margin Call

Pakistan Textile Body Welcomes FY27 Budget, Seeks FTR

Japan’s Nikkei Scales Record Peak as AI Shares Track US Chip Rally

Why China’s Demand Stimulus Still Isn’t Working

Grinding the Already Ground: Pakistan’s Inflation Crisis

JPMorgan Cuts Anthropic AI Access in Hong Kong

Weak Demand at Treasury Auctions Is Quietly Rattling Bond Investors

China Tungsten Export Curbs: Is Japan’s AI Chip Supply at Risk?

Xponential Fitness Franchise Lawsuit: The $3.97M Judgment

SpaceX IPO opens door for retail savers via X Money

SpaceX IPO: Musk Raises $75bn in History’s Largest Listing

Bank Indonesia Rate Hike 2026: New Mandate’s First Market Test
-

 Markets & Finance6 months ago
Top 15 Stocks for Investment in 2026 in PSX: Your Complete Guide to Pakistan’s Best Investment Opportunities
-

 Analysis5 months ago
Top 10 Stocks for Investment in PSX for Quick Returns in 2026
-

 Analysis5 months ago
Brazil’s Rare Earth Race: US, EU, and China Compete for Critical Minerals as Tensions Rise
-

 Analysis5 months ago
Johor’s Investment Boom: The Hidden Costs Behind Malaysia’s Most Ambitious Economic Surge
-

 Banks6 months ago
Best Investments in Pakistan 2026: Top 10 Low-Price Shares and Long-Term Picks for the PSX
-

 Investment6 months ago
Top 10 Mutual Fund Managers in Pakistan for Investment in 2026: A Comprehensive Guide for Optimal Returns
-

 Global Economy6 months ago
15 Most Lucrative Sectors for Investment in Pakistan: A 2025 Data-Driven Analysis
-

 Global Economy6 months ago
Pakistan’s Export Goldmine: 10 Game-Changing Markets Where Pakistani Businesses Are Winning Big in 2025