
Oil Markets
China-Russia Energy Ties: Deeper Than the Pipeline That Won’t Close

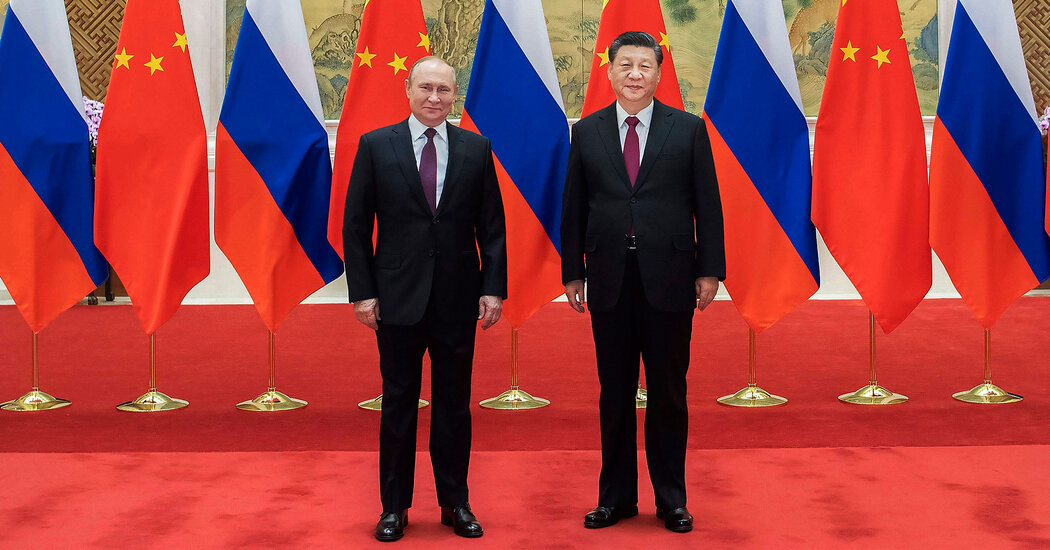
On May 20, 2026, Vladimir Putin walked into Beijing’s Great Hall of the People barely a week after Donald Trump had vacated the same ceremonial backdrop. Xi Jinping offered the full treatment — 40-plus cooperation agreements, declarations of ties at “the highest level in history,” and a joint statement that, in its careful diplomatic language, rejected Washington’s vision of global order. What the pageantry could not conceal was the one detail that told the real story: Russia’s most urgent ask — a binding final deal on the Power of Siberia 2 gas pipeline — came away unsigned. Kremlin spokesman Dmitry Peskov described the outcome as an “understanding” on basic parameters with “a few nuances” still to be resolved. In diplomatic language, that means negotiations continue.
That gap matters. It is the most precise measure available of where China-Russia energy ties actually stand.
A Partnership Built on Crisis, Not Strategy
The relationship spent four years defying Western predictions of its own limits. Russia’s full-scale invasion of Ukraine in February 2022 triggered the most sweeping sanctions package assembled since the Cold War. Moscow’s response was to pivot east with extraordinary speed, and Beijing — careful never to call it a rescue — absorbed the flows. Bilateral trade between the two countries reached around $228 billion in 2025, with Xi Jinping describing energy trade as a “stabilising pillar” of the relationship. That figure masks a telling detail: two-way trade was down 6.5% from a record in 2024, marking the first decline in five years — a drop driven overwhelmingly by falling global oil prices compressing the dollar value of largely stable physical volumes. The structural sinews held. The headline did not. ABC NewsJapan Today
China-Russia energy ties are now the load-bearing infrastructure of Moscow’s wartime economy, and the numbers confirm it on both sides of the ledger. Russia’s energy giant Gazprom supplies natural gas to China through the 3,000-kilometre Power of Siberia 1 pipeline under a 30-year, $400 billion deal launched in 2019. In 2025, exports jumped by around a quarter to 38.8 billion cubic metres, exceeding the pipeline’s planned annual capacity of 38 bcm. On oil, the picture is more striking still: China’s imports from Russia stood at 2.01 million barrels per day in 2025, representing 20% of China’s total imported oil by volume — and Russian presidential aide Yury Ushakov confirmed that exports surged a further 35% in the first quarter of 2026 to 31 million tons. MarketScreenerAsharq Al-Awsat
Those are not the numbers of a contingency arrangement. They are the architecture of dependency — carefully, if asymmetrically, constructed.
The shift in settlement currency reinforces how deep the rewiring has gone. By late 2025, more than 95% of bilateral trade settlements were conducted in rubles and yuan, a structural achievement that few Western analysts expected Russia to accomplish so rapidly after 2022. The dollar has effectively been excised from the world’s largest bilateral energy corridor. That alone constitutes a geopolitical fact that outlasts any single pipeline negotiation. Russiaspivottoasia
The Power of Siberia 2: Moscow Needs It More Than Beijing Does
How much energy does China import from Russia? In 2025, Russia supplied China with roughly 2.01 million barrels of oil per day — 20% of total Chinese crude imports — plus 38.8 billion cubic metres of pipeline gas and growing volumes of LNG. Russia is China’s largest pipeline gas supplier and its third-largest LNG source after Australia and Qatar. The relationship is large, but for China, not irreplaceable.
That asymmetry is precisely why Putin left Beijing without a breakthrough on the Power of Siberia 2 pipeline, in what analysts described as a setback for Moscow that revealed the evolving geometry of a partnership increasingly tilting in Beijing’s favour. CNBC
The proposed pipeline tells the story in steel and cubic metres. The planned 2,600-kilometre route would carry 50 billion cubic metres of gas annually from Russia’s Yamal fields to China via Mongolia — enough to roughly double the volumes now moving through Power of Siberia 1. For Moscow, it would replace the European market Gazprom has effectively lost: Russia’s gas exports to Europe have substantially shrunk following the 2022 invasion, with Gazprom seeing shipments reportedly plunge 44% to their lowest level in decades. For Beijing, the calculus is different entirely. CNBCRFE/RL
China doesn’t need Power of Siberia 2 on Russia’s schedule. It needs it on its own terms — price, take-or-pay obligations, and strategic exposure all remain open questions. Analysts note that for China, the pipeline increases the share of Russia in total gas supply, a concentration risk Beijing has so far been reluctant to formalise. Michael Feller, chief strategist at Geopolitical Strategy, put the dilemma plainly: “A deal would signal not just trust, but a decision that co-dependency is safer than the alternative. For the rest of the world, it would make the Sino-Russian relationship harder to unpick.” Al JazeeraCNBC
Gazprom and China National Petroleum Corporation signed a “legally binding memorandum” in September 2025. It was not a binding final agreement. The gap between those two things is where China’s leverage lives.
The Institutional Rewiring No One Is Talking About
Will the Power of Siberia 2 pipeline ever be built? Almost certainly — but on a timeline Beijing controls. The deeper story of China-Russia energy ties is not the pipeline negotiations. It is the quiet institutional transformation happening beneath them: shadow fleet logistics, Arctic LNG defiance, and the Yulong refinery case study.
In August 2025, China accepted a shipment from Russia’s Arctic LNG 2 liquefaction plant — a facility owned by Novatek that has been under US sanctions since November 2023, and whose exports had effectively been blocked as potential buyers stayed away to avoid secondary sanctions. China’s decision to receive that cargo was not an accident. Michal Meidan, head of China Energy Research at the Oxford Institute for Energy Studies, called it unambiguous: “The message is: China is no longer even pretending to comply with US sanctions or care about what the West thinks.” KinacentrumAl Jazeera
The Shandong Yulong refinery case makes the structural point even more sharply. This 400,000-barrel-per-day facility has become exclusively dependent on Russian crude following Western sanctions imposed in mid-2025 targeting Rosneft and Lukoil, which effectively closed the refinery off from Western and most Middle Eastern suppliers. During December 2025 and January 2026, Yulong imported an average of 240,000 barrels per day from Russia. These are not spot purchases. They are permanent structural dependencies created by the precise mechanism Western policymakers deployed to punish Russia. Discovery Alert
In February 2026, Russia formally ratified additional cooperation arrangements related to the Yamal LNG project, further strengthening long-term coordination in Arctic LNG development. The hydrogen dimension is newer still: Russia offers feedstock for blue hydrogen production; China contributes electrolyzer manufacturing and fuel-cell expertise. The energy axis is widening, sector by sector, even as the flagship pipeline project stalls. CGTN
Two-way trade rose 16.1% in the first four months of 2026 compared to the same period in 2025. Whatever the summit produced on paper, the volumes tell a different story.
The Limits That Western Analysts Often Miss — and One Beijing Cannot Ignore
The counterargument deserves honest treatment, and it is not trivial. China-Russia energy ties carry structural vulnerabilities that neither capital discusses openly.
The payment architecture, for all its yuan-and-ruble symbolism, remains operationally fragile. Chinese banks have grown reluctant to process yuan transactions with Russia, leading to significant payment delays; some major financial institutions, including Ping An Bank and Bank of Ningbo, stopped accepting Russian payments entirely, with approved transaction processing times stretching to 18 days. The reason is not ideological. It is the threat of US secondary sanctions — a tool that, even when wielded selectively, disciplines the behaviour of institutions that need access to dollar clearing far more than they need any individual Russian contract. Second Line of Defense
That tension will not disappear after Power of Siberia 2 is settled, if it ever is. China’s oil consumption is projected to peak around 2027 as electric vehicle adoption accelerates and GDP growth moderates. In the following years, Chinese demand will be sustained primarily by petrochemicals rather than transport fuel — a shift that changes what kind of Russian crude China wants, and how much of it. Kinacentrum
The critics who argue that China is “propping up” Russia miss something important: Beijing is extracting significant economic concessions for doing so. Russian crude has traded at a persistent discount to Brent — a discount that Chinese refiners, not Russian producers, capture. The relationship is less a geopolitical alliance and more a structured commercial arrangement in which one party happens to need the other considerably more than it lets on.
Energy partnerships built under duress tend to be renegotiated the moment that duress eases. That is precisely what Moscow fears most about any Ukraine ceasefire: not the military outcome, but the economic one.
What Comes Next for the World’s Most Consequential Energy Corridor
The May 2026 Beijing summit produced a paradox worth sitting with. Russia and China signed more than 40 agreements, declared ties “unyielding,” and pledged alignment on everything from artificial intelligence to nuclear cooperation. Yet the single project Moscow has staked its long-term energy future on — Power of Siberia 2 — remains, as it has for a decade, a negotiation rather than a construction project.
That is not a failure of friendship. It is a reflection of how the relationship actually functions. China doesn’t need to sign Power of Siberia 2 to maintain its leverage over Russia. In fact, not signing it is how that leverage is maintained. Each passing quarter in which Moscow’s European revenues remain suppressed and its Asian alternatives remain dependent on Chinese approval is a quarter in which Beijing extracts better terms, lower prices, and more infrastructure equity from a partner that has nowhere else to go.
The West’s deepest miscalculation, four years on, was assuming that sanctions would weaken the China-Russia energy axis. Instead, they institutionalised it — creating physical infrastructure, settled legal frameworks, and corporate dependencies that will outlast any political settlement in Ukraine.
The pipeline that won’t close is the relationship itself.
Discover more from The Economy
Subscribe to get the latest posts sent to your email.


Markets & Finance
Beyond $100 Oil: Why the Geopolitical Shock at Hormuz Marks a Structural Turning Point
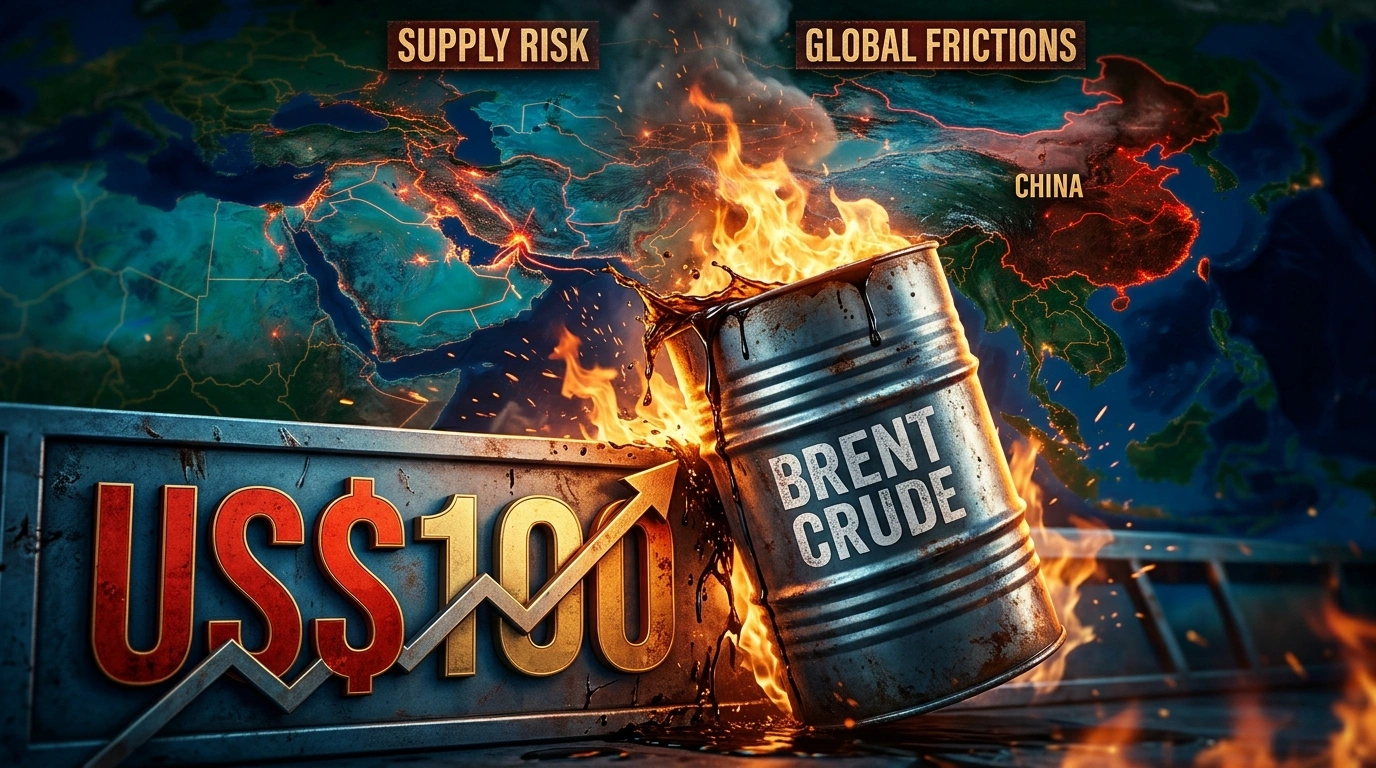
The global energy market is once again staring down a critical threshold. As reported by the South China Morning Post, Brent crude futures have surged past $98 a barrel, propelled by an attack on Saudi Aramco’s 400,000-bpd Jizan refinery and escalating maritime friction in the Strait of Hormuz.
For global supply chains and central bankers battling persistent inflation, the return of $100 crude is a nightmare scenario. But viewing this surge merely as a temporary market spike misses the broader picture: we are witnessing a structural realignment in how global energy risks are priced and absorbed.
1. The Vulnerability of Middle East Infrastructure
The attack on Saudi Aramco’s Jizan facility serves as a stark reminder of the fragile state of global energy infrastructure. When a single localized strike can instantly threaten 400,000 barrels per day of refining capacity, the market has no choice but to price in a permanent volatility premium.
Furthermore, threats around the Strait of Hormuz—a maritime bottleneck through which approximately 20% of global petroleum passes—mean that supply anxiety is no longer speculative. Even if diplomatic channels remain open, as noted by commodity analysts at Guotai Junan Futures, negotiations can only manage conflict intensity; they cannot eliminate the geographical choke point risk.
2. The Fallacy of China’s “Weakened” Demand
Conventional wisdom suggests that $100 oil will severely damage China’s economy due to its status as the world’s largest net crude importer. However, this perspective overlooks three key structural buffers Beijing has built over the past decade:
- Strategic Petroleum Reserves (SPR): China has systematically built vast crude stockpiles during low-price windows. When spot prices cross the $95–$100 threshold, Chinese state refiners step back from spot markets and draw down domestic inventory.
- Rapid Electrification: The aggressive domestic rollout of Electric Vehicles (EVs) and electrified heavy transport has permanently displaced hundreds of thousands of barrels per day of gasoline and diesel demand.
- Diversified Import Channels: Increased pipeline imports from Central Asia and discounted bilateral crude flows provide China with a partial hedge against Brent spot price spikes that Western importers do not enjoy.
Thus, while China’s spot import appetite appears to “dampen” on paper, it reflects a deliberate tactical shift rather than purely economic distress.
Macroeconomic Impact Matrix: Who Loses at $100 Oil?
| Region / Sector | Primary Risk Exposure | Strategic Resilience Mechanisms | Long-Term Market Impact |
| United States & EU | Renewed Headline Inflation, Delayed Rate Cuts | Increased Domestic Shale Production (US), Strategic Reserve Releases | Higher retail fuel prices, compressed consumer spending, persistent central bank hawkishness |
| China | Refined Product Margin Squeeze, High Import Bills | Massive SPR stockpiles, EV fleet saturation, Alternative Pipeline Imports | Reduced spot market buying; accelerated transition toward renewables and grid electrification |
| Emerging Markets | Currency Depreciation, Fiscal Deficit Expansion | Subsidies (where fiscally feasible), Fuel Rationing | Severe balance of payments pressure, potential macroeconomic instability |
3. What Happens Next? The $100 Floor vs. Demand Destruction
Can Brent crude sustain a run above $100? In the short term, yes—as long as physical supply disruptions remain unhedged by OPEC+ spare capacity.
However, sustained $100 oil inevitably triggers its own cure: demand destruction. High energy prices will act as a tax on global growth, slowing industrial output in Europe and Asia and ultimately rebalancing the market.
Key Takeaways
- Geopolitical Risk Is Back: Energy infrastructure in the Middle East and maritime transit bottlenecks remain vulnerable, making $90+ crude the new baseline during geopolitical friction.
- China’s Energy Hedge: China is better equipped to navigate $100 crude today than during previous price shocks, thanks to strategic stockpiling and aggressive EV adoption.
- Inflation Domino Effect: Central banks in Western economies may be forced to hold interest rates higher for longer to combat energy-driven headline inflation.
Discover more from The Economy
Subscribe to get the latest posts sent to your email.

Gold traded above $4,500 an ounce in mid-to-late August 2026, marking a third consecutive weekly gain, while oil continued to soften on oversupply signals — a divergence that, on the surface, looks contradictory, according to Trading Economics. It isn’t. The two moves are mechanically linked, and understanding that link is the difference between reactive trading and a genuine safe-haven strategy for Q3 and Q4 2026.
The Transmission Mechanism: Why Oil and Gold Are Moving in Opposite Directions
The connection runs through three steps, as explained by GoldSilver’s August 2026 market analysis:
- Cheaper oil reduces energy-driven inflation. When crude prices fall, headline inflation pressure eases.
- Lower inflation reduces the urgency for Federal Reserve rate hikes. Markets reprice the probability of tightening downward.
- Falling rate-hike expectations ease real yields, and gold — which pays no yield — becomes comparatively more attractive against Treasuries.
This is precisely what played out after a de-escalation in US-Iran tensions in early August 2026: Brent crude fell more than 5% to roughly $83 a barrel and West Texas Intermediate dropped over 6% to around $79, while gold moved higher in response, per GoldSilver’s reporting. OPEC+’s approval of a September production increase of 188,000 barrels per day added further downward pressure on crude.
Gold’s Round-Trip Year: The Chart Most Coverage Misses
Most single-day commodity coverage misses the full-year arc. Gold’s 2026 story is a round-trip, not a straight line, according to drawpie.com’s August 2026 price analysis:
| Date | Event | Approx. Gold Price |
|---|---|---|
| Jan 29, 2026 | Record close | $5,318/oz |
| Jan 28, 2026 (intraday) | All-time intraday record | ~$5,589/oz |
| Late Jan 2026 | Single-session correction | -11.4% (largest single-day drop of the year) |
| Jul 16, 2026 | Cycle low after 5-month grind | $3,986/oz |
| Aug 5, 2026 | Sharp single-day rally | +3.7% |
| Mid-Aug 2026 | Third consecutive weekly gain | Above $4,500/oz |
Despite the record-high headlines in January and the correction headlines that followed, gold spent most of 2026 essentially flat to slightly below where it started the year before this August rally, per drawpie.com — a fact that gets lost in both the bullish and bearish framing competitors reach for.
Who’s Actually Buying: The Central Bank Signal
Retail and ETF flows have been volatile — US-listed gold ETFs saw roughly $5.3 billion in monthly redemptions during the summer correction, according to Yahoo Finance’s gold prediction coverage — but the more telling signal for institutional allocators is central bank demand. Central banks purchased a record 289 tonnes of gold in Q2 2026 alone, a 74% year-on-year jump, according to the World Gold Council’s Gold Demand Trends report cited by GoldSilver. A World Gold Council survey found 45% of central banks plan to add further to reserves, per Yahoo Finance — a structural demand floor that retail sentiment swings don’t erase.
Key Drivers to Watch Through Q4 2026
- Federal Reserve rate decisions: Markets have oscillated between pricing a hold and a hike at recent FOMC meetings; each print reprices real yields and gold in tandem.
- US-Iran and broader Middle East developments: Any escalation reverses the oil-down/gold-up dynamic described above.
- OPEC+ supply decisions: Additional production increases extend the oversupply narrative pressuring crude.
- US Treasury debt-management moves: A Treasury announcement to expand long-term debt buybacks reportedly drove a same-day gold jump of more than 4%, per Trading Economics, by pulling yields and the dollar lower.
A Safe-Haven Allocation Framework for Q3–Q4 2026
Wealth managers structuring client portfolios around this divergence should think in tiers rather than a single “buy gold” call:
- Core hedge (all risk profiles): A strategic 5–10% allocation to physical gold or gold-backed ETFs as a permanent inflation and currency hedge, independent of short-term price swings.
- Tactical overlay (active/balanced portfolios): Incremental additions timed around Fed meeting cycles and geopolitical flashpoints, using the transmission mechanism above as the entry signal rather than headline price alone.
- Energy underweight (Q3 2026 specific): Given the OPEC+ supply increase and de-escalation dynamics, tactical underweight positioning in pure upstream energy exposure, offset by overweight in refiners or energy-adjacent infrastructure less sensitive to crude-price direction.
- Silver as a levered gold proxy: Silver has moved even more sharply than gold in both directions in 2026 and remains in a structural, multi-year supply deficit, per GoldSilver — appropriate for investors with higher volatility tolerance seeking amplified safe-haven exposure.
The Bottom Line
The oil-gold divergence of Q3 2026 is not two unrelated commodity stories — it is one macro trade expressed through two assets connected by inflation expectations and Fed policy. Investors who treat gold and oil as separate headlines will consistently misread the signal; those who track the three-step transmission mechanism will be positioned ahead of the next Fed-driven repricing.
Discover more from The Economy
Subscribe to get the latest posts sent to your email.
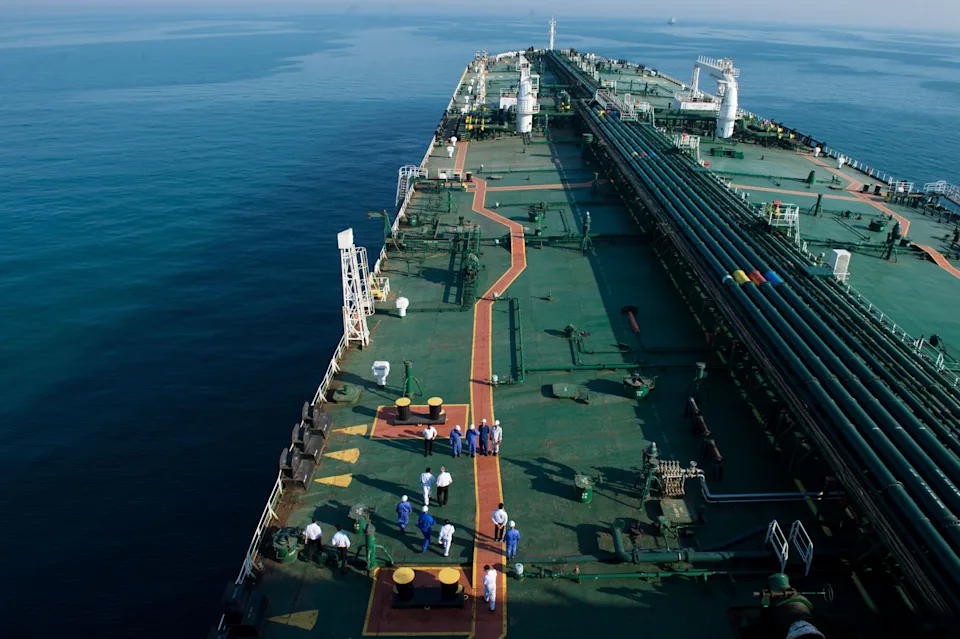
Russian crude loadings at Novorossiysk hit zero as Ukrainian drone strikes intensify. Here’s what the export collapse means for Urals pricing and global supply.
Russia’s seaborne oil export machine is sputtering under sustained Ukrainian pressure. Per Bloomberg, shipments have fallen for a fifth week, with no crude loading at all from the key Novorossiysk terminal in the seven days to August 16 — a decline larger than any comparable stretch since the war began.
Key Takeaways
- Russian oil shipments have fallen for five straight weeks, with no crude loaded at the key Novorossiysk terminal in the seven days to August 16.
- Ukraine struck Novorossiysk’s naval base and infrastructure on August 11-12, damaging four warships and hitting the tunnel leading to the Sheskharis terminal.
- The Sheskharis terminal — Russia’s main Black Sea export point, handling around 700,000 barrels a day — has suspended loadings repeatedly since.
- Russian oil refining fell in July to its lowest level since May 2002, roughly a third below seasonal norms.
- Russia earned €193 billion from energy sales over the past year, of which €14.5 billion came from the EU.
The proximate cause was a major overnight strike. Per the Kyiv Independent, Ukraine’s large-scale drone attack on Novorossiysk overnight on August 12 damaged the Sheskharis terminal — Russia’s main Black Sea crude facility, handling around 700,000 barrels a day — and follow-on drone threats on August 14 forced a full suspension of loadings, with a scheduled tanker departing without cargo. President Zelensky said the strikes hit two frigates, a landing ship, a corvette and other naval vessels, along with grain terminals and infrastructure supporting Russia’s war financing, per EA WorldView’s reporting.
The human and commercial toll has been significant on both fronts. The Moscow Times reported at least three people were killed in the attack, including a child, and that two major grain terminals were knocked offline — Russia is the world’s largest wheat exporter, and its grain lobby has separately warned that continued strikes could disrupt exports and push up global food prices.
The disruption follows a period of unusually high export volumes as Russia pushed to keep revenue flowing despite the attacks. Per Baird Maritime, Novorossiysk loadings reached nearly 1 million barrels a day in July, up from about 800,000 in June — but security risk in the Black Sea has made vessels increasingly hard to secure, with one trader involved in Russian oil sales telling Reuters they “have to change vessels daily as most shipowners refuse to visit Russia’s Black Sea ports.”
The strain extends beyond export terminals into refining capacity itself. Per The Moscow Times’ Bloomberg-sourced reporting, Russian refineries processed an estimated 3.6 million barrels of crude a day in July — the lowest since May 2002, and roughly a third below the 5.3-5.6 million barrel seasonal norm for 2020-2025. Rystad Energy’s head of geopolitical analysis noted Russia retains some capacity to redirect crude to Baltic terminals, but limited pipeline, storage and tanker capacity constrain how much it can compensate.
The financial stakes are considerable. The same Moscow Times reporting notes Russia earned €193 billion from energy sales over the past year, of which €14.5 billion came from the European Union — underscoring how much revenue is riding on export infrastructure that is now under sustained attack.
Why It Matters
A sustained reduction in Russian export volumes tightens global crude supply at the same time the Strait of Hormuz disruption (Article 5) is constraining Middle East flows — a dual supply shock with outsized implications for energy-importing economies across this operation’s nine markets.
Data and Evidence
- Novorossiysk crude loadings: 0 for the week to August 16, following a fifth consecutive weekly decline
- Sheskharis terminal capacity: ~700,000 barrels/day
- July Novorossiysk loadings before the disruption: ~1 million barrels/day
- Russian refining, July 2026: 3.6 million barrels/day, lowest since May 2002
- Russia’s energy revenue, trailing year: €193 billion (€14.5 billion from the EU)
Global Impact
Combined with Hormuz disruptions, reduced Russian seaborne exports add to a global crude-supply tightening that ripples into every energy-importing market this operation covers, and into shipping-insurance costs for tankers willing to operate in either conflict zone.
What Happens Next
Watch whether Russia can redirect meaningful volumes to Baltic terminals, and whether Ukraine sustains its Black Sea strike tempo despite reported US pressure (Vice President Vance reportedly asked Zelensky to pause strikes in late July) to avoid further destabilizing oil markets.
Frequently Asked Questions
Why did Russian oil exports drop to zero at Novorossiysk?
Repeated Ukrainian drone strikes damaged the Sheskharis terminal and forced repeated suspensions of loading operations.
How much of Russia’s oil exports does Novorossiysk handle?
Around 700,000 barrels a day at capacity, roughly 2% of global oil supply.
Is Russian refining also affected?
Yes — refining hit a 24-year low in July, about a third below seasonal norms.
Can Russia reroute exports elsewhere?
Partially, via Baltic terminals, but pipeline, storage and tanker capacity limit how much can be redirected.
How much revenue does Russia get from energy exports?
Roughly €193 billion over the trailing year, including €14.5 billion from EU buyers.
Discover more from The Economy
Subscribe to get the latest posts sent to your email.

Macroeconomic Fallout of Middle Eastern Airspace Restrictions: Why U.S. Carriers Are Abandoning Gulf Hubs Through 2027

High-CPM Finance Niches 2026: Publisher Monetization Blueprint

IMF & World Bank 2026 Global Economic Outlook: Growth, Inflation, Debt

Pork Recall 2026: USDA Guanciale Listeria Recall in 8 States Explained

Zelda: Ocarina of Time Switch 2 Remake — Release Date & Everything Confirmed

Social Security Trust Fund 2032: OASI Depletion Timeline Explained

Oracle (ORCL) Stock Analysis: AI Cloud Growth Ahead of Sept 10 Earnings

2027 Social Security COLA: 3.5% Increase Explained

Non-State Actors and AI 2026: The Push for Global Guardrails

Mandatory Lobbying Registers 2026: Corporate Risk Guide

Beyond $100 Oil: Why the Geopolitical Shock at Hormuz Marks a Structural Turning Point

Digitally Deliverable Services: 56% of Global Trade in 2026

AI Data Center Real Estate 2026: Power & Grid Battle Guide

Smart Glasses Privacy Crisis 2026: Regulation & Compliance

State Farm’s $5B Dividend 2026: Who Qualifies & Payout Dates

US-China Relations in Q3 2026: Trade Tariffs and Supply Chain Risks

Gold’s Wild 2026: From a Record $5,600 Peak to a 24% Crash and Back Toward $4,500

Oil Surges as Strait of Hormuz Traffic Collapses Again

The Rocket That Won’t Quit: Inside SpaceX’s Falcon 9 Launch Machine

Bank of England Set to Hold Rates Through Year-End, Reuters Poll Shows

The 2026 Crypto Regulatory Shift: What It Means for Institutional Investors

SpaceX Starship Flight 14: First Orbital Attempt & Starlink V3 Launch Explained

Retail Earnings Week: What Home Depot, Target & Walmart Reveal

AI-Powered Training: The Next Multi-Billion Dollar Ecosystem in Fitness

AI Chip Stocks 2026: The Best Semiconductor Investments Beyond Marvell

Russia’s Black Sea Oil Exports Fall for a Fifth Straight Week

China’s Economy Has a Structural Problem: Factories Are Winning, Households Are Losing

Global Chip Selloff Deepens: What’s Driving the Aug. 19 Semiconductor Rout
-

 Markets & Finance8 months ago
Top 15 Stocks for Investment in 2026 in PSX: Your Complete Guide to Pakistan’s Best Investment Opportunities
-

 Analysis7 months ago
Johor’s Investment Boom: The Hidden Costs Behind Malaysia’s Most Ambitious Economic Surge
-

 Analysis7 months ago
Top 10 Stocks for Investment in PSX for Quick Returns in 2026
-

 Analysis7 months ago
Brazil’s Rare Earth Race: US, EU, and China Compete for Critical Minerals as Tensions Rise
-

 Banks8 months ago
Best Investments in Pakistan 2026: Top 10 Low-Price Shares and Long-Term Picks for the PSX
-

 Investment8 months ago
Top 10 Mutual Fund Managers in Pakistan for Investment in 2026: A Comprehensive Guide for Optimal Returns
-

 Global Economy9 months ago
15 Most Lucrative Sectors for Investment in Pakistan: A 2025 Data-Driven Analysis
-

 Global Economy9 months ago
Pakistan’s Export Goldmine: 10 Game-Changing Markets Where Pakistani Businesses Are Winning Big in 2025