
Analysis
Gold Prices Soar to Record Rs529,162 Per Tola in Pakistan as Global Rally Intensifies

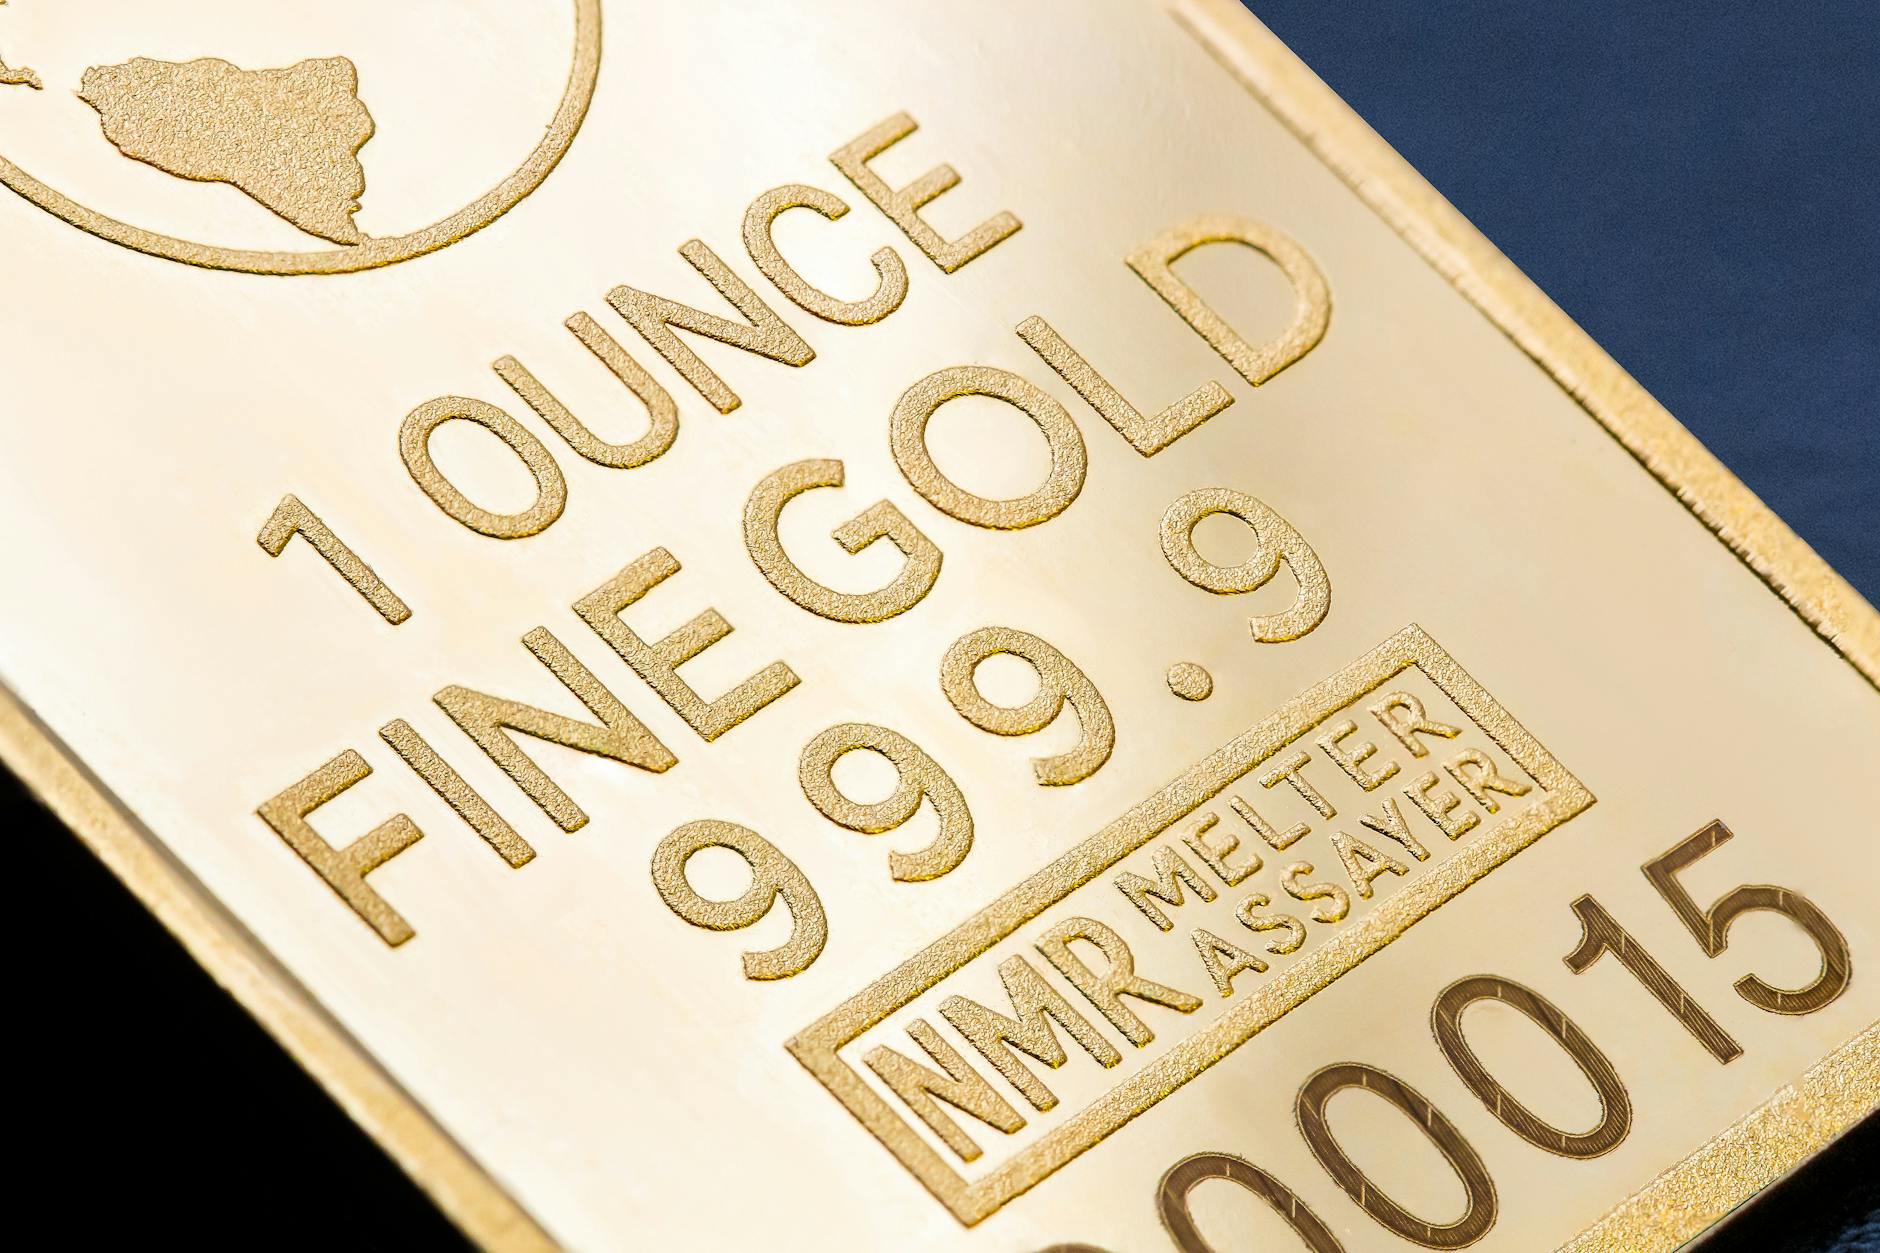
Gold prices in Pakistan hit Rs529,162 per tola on Feb 4, 2026, driven by international surge to $5,064/oz. Analysis of investment trends and market outlook.
Pakistan’s gold market witnessed extraordinary volatility on February 4, 2026, as prices surged by Rs14,800 in a single session to reach an unprecedented Rs529,162 per tola—a milestone that underscores the precious metal’s remarkable ascent amid global economic turbulence. This dramatic upswing, reported by the All-Pakistan Gems and Jewellers Sarafa Association (APGJSA), reflects a broader international rally that pushed spot gold to $5,064 per ounce, including a $20 premium, marking a $148 gain that has captivated investors worldwide.
For Pakistani consumers already grappling with economic headwinds, this gold price surge in Pakistan 2026 presents both a challenge and an opportunity—transforming wedding purchases into strategic decisions while reinforcing gold’s enduring appeal as a wealth preservation vehicle in uncertain times.
Understanding the Dramatic Price Movement
The recent trajectory defies historical norms. Just one day prior, on Tuesday, gold per tola had jumped Rs24,000 to Rs514,362, creating a two-day cumulative increase of Rs38,800—a 7.9% gain that would typically unfold over weeks rather than hours. The 10-gram gold price mirrored this momentum, climbing Rs12,689 to Rs453,671, while silver prices rose Rs109 to Rs9,255 per tola, demonstrating the silver price correlation Pakistan markets often exhibit during precious metal rallies.
Recent Gold Price Trends in Pakistan:
| Date | Price Per Tola (PKR) | Daily Change | 10-Gram Price (PKR) |
|---|---|---|---|
| Feb 4, 2026 | 529,162 | +14,800 | 453,671 |
| Feb 3, 2026 | 514,362 | +24,000 | 440,982 |
| Feb 2, 2026 | 490,362 | – | 420,453 |
This acceleration signals something more profound than routine market fluctuations—it reflects converging global forces reshaping why gold prices are rising in Pakistan and across emerging markets.
Global Catalysts Driving the Gold Investment Trends Pakistan
The international gold impact on Pakistan cannot be understated. According to the World Gold Council’s latest analysis, central bank purchases reached 1,037 tonnes in 2024, the second-highest annual total on record, sustaining robust demand that has propelled prices upward. “Central banks in emerging markets continue accumulating gold as a strategic reserve diversification tool,” notes the Council’s Q4 report, a trend that creates persistent upward pressure on global prices.
Forbes’ recent gold price dynamics coverage attributes the rally to three interconnected factors: persistent inflation concerns across developed economies, geopolitical tensions that enhance safe-haven demand, and weakening confidence in traditional fiat currencies. When the Federal Reserve signals potential policy shifts or global trade tensions escalate, gold becomes the beneficiary of capital flight from riskier assets.
The timing is particularly significant. Seeking Alpha’s gold commentary for February 2026 highlights how institutional investors have rotated approximately $47 billion into gold-backed exchange-traded funds (ETFs) over the past quarter, creating unprecedented demand that futures markets struggle to absorb. This institutional appetite, combined with retail investor participation in markets like Pakistan, India, and China, creates a powerful demand dynamic.
Pakistan’s Unique Position in the Global Gold Ecosystem
Pakistan’s gold market operates at the intersection of cultural tradition and economic necessity. Unlike Western markets where gold primarily serves as an investment vehicle, Pakistani demand is deeply intertwined with social customs—weddings, religious occasions, and intergenerational wealth transfer all center on physical gold ownership.
Mordor Intelligence’s comprehensive gold market report projects Pakistan’s gold consumption will grow at a 4.2% CAGR through 2028, driven by a growing middle class and limited investment alternatives. With bank deposit rates failing to keep pace with inflation and stock market volatility deterring conservative savers, gold offers tangible security that resonates with Pakistani investors.
However, the current gold price per tola trajectory presents challenges. At Rs529,162, a single tola (11.66 grams) now costs approximately $1,850 at current exchange rates—representing nearly two months’ salary for an average urban household. This pricing dynamic is reshaping the gold rate per tola purchasing patterns, with consumers gravitating toward smaller denominations or postponing traditional wedding gold purchases.
Economic Implications and Policy Considerations
The surge carries profound implications for Pakistan’s economy. Higher gold prices exacerbate the current account deficit, as Pakistan imports virtually all its gold—approximately 80-100 tonnes annually according to trade data. Each $100 increase in international gold prices theoretically adds $8-10 million to monthly import bills, pressuring foreign exchange reserves already constrained by debt servicing obligations.
State Street Global Advisors’ monthly gold monitor notes that emerging market central banks face a delicate balancing act: gold reserves provide financial stability and diversification benefits, yet elevated prices make accumulation expensive. Pakistan’s State Bank has maintained relatively stable gold reserves around 64 tonnes, representing just 3% of total reserves—far below the global average of 15% for central banks.
Currency dynamics add another layer. The Pakistani rupee’s gradual depreciation against the dollar amplifies international price movements, creating what economists call a “double effect”—dollar-denominated gold gains translate into even steeper rupee-denominated increases when exchange rates weaken simultaneously.
What History Teaches About Gold Price Cycles
Gold’s relationship with economic uncertainty follows predictable patterns. During the 2008 financial crisis, prices climbed from $800 to $1,900 per ounce over three years as investors sought refuge from collapsing equity markets. The COVID-19 pandemic sparked a similar flight to safety, propelling gold above $2,000 in August 2020.
Yet gold also experiences corrections. After peaking at $1,921 in September 2011, prices entered a multi-year bear market, declining to $1,050 by December 2015 as economic recovery diminished safe-haven demand. Visual Capitalist’s gold demand trends analysis illustrates how these cycles correlate with real interest rates—when inflation-adjusted returns on bonds and savings accounts turn positive, gold’s opportunity cost increases, typically capping price appreciation.
The current environment presents mixed signals. Inflation remains elevated globally, supporting gold’s purchasing power preservation narrative. However, if central banks successfully engineer economic soft landings and real interest rates normalize, gold could face headwinds that moderate the gold price in Pakistan today from these record levels.
Silver’s Supporting Role and Diversification Potential
Silver’s Rs109 increase to Rs9,255 per tola deserves attention beyond mere footnote status. The gold-to-silver ratio—currently approximately 57:1 in Pakistan—sits near historical averages, suggesting silver remains relatively affordable compared to its precious metal counterpart.
Industrial demand differentiates silver from gold. Approximately 56% of silver consumption stems from industrial applications including solar panels, electronics, and medical devices, according to the Silver Institute. As global green energy transitions accelerate, this industrial use case could support sustained demand independent of investment flows, creating interesting opportunities for portfolio diversification within precious metals.
Navigating the Gold Investment Trends Pakistan for 2026 and Beyond
For investors contemplating exposure to gold amid these elevated prices, several strategic considerations emerge:
Systematic accumulation through rupee-cost averaging can mitigate timing risk. Rather than attempting to predict short-term peaks and troughs, consistent small purchases build positions gradually while smoothing volatility impact.
Physical versus financial instruments present distinct trade-offs. Physical gold offers tangible security but incurs storage costs and liquidity constraints. Gold savings schemes from commercial banks or sovereign gold bonds (where available) provide price exposure without physical custody challenges, though counterparty risk enters the equation.
Portfolio allocation discipline remains paramount. Financial advisors typically recommend 5-10% precious metals allocation within diversified portfolios—enough to provide meaningful inflation hedge benefits without excessive concentration risk. At current valuations, investors should resist the temptation to chase performance with outsized allocations.
Currency hedging considerations matter for Pakistani investors. Since international gold prices denominate in dollars, rupee depreciation amplifies gains but also magnifies losses if gold corrects while the rupee strengthens—a scenario that, while currently unlikely, merits consideration in comprehensive risk assessment.
Looking Forward: Scenarios and Signals to Monitor
Three scenarios frame gold’s trajectory over the coming months:
The continuation scenario envisions gold reaching $5,500-6,000 per ounce if geopolitical tensions escalate, central bank buying accelerates, or inflation proves more persistent than anticipated. For Pakistan, this would translate to per-tola prices approaching Rs600,000—transforming gold from accessible savings vehicle to luxury commodity for many households.
The consolidation scenario sees prices stabilizing in the $4,800-5,200 range as markets digest recent gains and await clarity on monetary policy directions. This would allow Pakistani consumers to adjust purchasing patterns and potentially re-enter markets during stability periods.
The correction scenario materializes if economic data suggests successful inflation control, prompting central banks to maintain restrictive policies that raise opportunity costs for non-yielding gold. A pullback to $4,200-4,500 could manifest, offering entry points for patient investors while providing relief to consumer purchasers.
Key indicators worth monitoring include U.S. Federal Reserve policy signals, real interest rate trends, dollar strength indices, emerging market central bank reserve management decisions, and of course, Pakistan-specific factors including exchange rate stability and import policy adjustments.
The Broader Context: Gold’s Enduring Relevance
In an era of digital currencies, algorithmic trading, and complex financial engineering, gold’s persistence as a store of value speaks to something fundamental in human economic psychology. No other asset carries 5,000 years of monetary history while maintaining contemporary relevance. Pakistan’s surging gold prices reflect this timeless appeal colliding with 21st-century economic realities—inflation anxieties, currency instabilities, and the perpetual human quest for financial security.
Whether today’s Rs529,162 price represents a sustainable new plateau or an ephemeral peak awaiting correction remains unknowable. What matters more for thoughtful market participants is developing frameworks for navigating uncertainty rather than predicting unpredictable futures.
For investors and consumers alike, the current environment demands neither panic nor complacency—but rather informed vigilance. Monitor global economic indicators, assess your personal financial circumstances honestly, and make gold allocation decisions within comprehensive wealth management strategies rather than isolated bets on price direction. In uncertain times, discipline trumps speculation, and diversification remains the only free lunch in investing.
The gold market’s message today is clear: volatility creates both risks and opportunities. How you respond will determine whether this historic surge becomes a cautionary tale or a strategic turning point in your financial journey.
Discover more from The Economy
Subscribe to get the latest posts sent to your email.



Key Takeaways
- Rolex’s secondary market rose approximately 7.9% year-over-year as of 2026 (per WatchCharts data) — trailing Patek Philippe (+16.2%) and Tudor (+11.4%) but still outperforming Audemars Piguet (+3.4%).
- Rolex raised U.S. retail prices 4–9% in January 2026 (steel models ~5.6%, gold models ~8.7%), narrowing the historical gap between retail and pre-owned pricing.
- Not every model appreciates: steel sports references (Submariner, GMT-Master II, Daytona) have held value far better than two-tone or widely available dress references like the standard Datejust.
- The Lady-Datejust posted the sharpest 2026 gain among tracked collections — up 22.73%, from roughly $9,269 to $11,376 — driven by demand for smaller, “everyday luxury” watches.
- Gold’s rise past $2,400/oz has directly lifted the investment case for Rolex’s precious-metal references (Day-Date, Sky-Dweller, Yacht-Master).
The Model-by-Model Picture
| Category | 2026 Trend |
|---|---|
| Lady-Datejust | +22.73% (strongest performer among tracked collections) |
| Steel sports models (Submariner, GMT-Master II) | Held value well; corrected from 2022 peak but stabilized above retail |
| Daytona | Corrected from highs above $50,000 to the mid-$30,000s; still among the most sought-after references |
| Two-tone/widely available Datejust | Flat to negative — “holds value” is an overstatement for this category |
| Gold references (Day-Date, Sky-Dweller) | Lifted by gold’s rise above $2,400/oz |
Why the “Rolex Always Appreciates” Myth Is Fading
The pandemic-era boom pushed some references — the Daytona above all — to speculative highs disconnected from historical norms. Since the March 2022 peak, steel sports models have compressed meaningfully, and dealers who bought inventory near the top have in some cases faced 20–40% markdowns on liquidation. The lesson for 2026 buyers: Rolex as a category is not a monolith. Value retention depends heavily on specific reference, condition, and whether the piece comes with box and papers (“full set”).
What’s Actually Driving 2026 Strength
- Retail price increases raise the floor. When a new Submariner retails at $10,050 (up from $9,500), a pre-owned example at $11,000–$12,000 suddenly represents a smaller premium — narrowing the gap without secondary prices actually moving.
- Supply discipline remains Rolex’s core lever. The brand has never confirmed production numbers, and secondary-market premiums remain entirely a function of Rolex’s own manufacturing decisions — a risk factor as much as a support.
- Certified Pre-Owned rollout. Rolex’s now fully rolled-out CPO program has changed how buyers transact in the used market, adding a layer of brand-verified legitimacy that supports pricing.
The Case for Rolex as a Portfolio Diversifier
Financial advisors increasingly frame luxury watches not as a replacement for equities or bonds, but as a tangible, historically low-correlation diversifier — one that carries its own risks (illiquidity, condition-dependent pricing, no yield) but has demonstrated multi-decade resilience for specific references.
Is Rolex a good investment in 2026?
It depends heavily on the specific reference. Steel sports models like the Submariner and Daytona have held or grown in value; two-tone and widely available dress models generally have not. Overall, Rolex’s secondary market rose about 7.9% year-over-year in 2026, trailing Patek Philippe but ahead of Audemars Piguet.
Discover more from The Economy
Subscribe to get the latest posts sent to your email.

Navigating Mortgage and Loan Refinancing in a High-Yield Environment
Global public debt crossing critical thresholds has kept central bank policies volatile, resulting in fluctuating US Treasury yields throughout 2026. For homeowners and commercial property holders burdened by previous high-interest borrowing cycles, finding optimal refinance windows has become a high-stakes financial puzzle. Stalled disinflation and stubborn employment numbers mean rate cuts are incremental, requiring borrowers to act with precision.
Timing your mortgage or commercial loan refinance in this environment requires a deep understanding of yield curve movements and lender risk appetites.
Decoding 2026 Refinance Dynamics
The 10-Year Treasury Yield Benchmark
Mortgage rates continue to track closely with the 10-year US Treasury yield. When macroeconomic anxiety spikes debt issuance, yields rise, tightening consumer borrowing capacity. Savvy borrowers monitor weekly Treasury auctions to lock in rates during brief dip windows.
Hybrid ARMs and Alternative Structures
With fixed rates remaining elevated, 7/1 and 10/1 adjustable-rate mortgages (ARMs) have surged in popularity. These products offer lower initial monthly payments, giving borrowers breathing room until central bank easing cycles fully materialize.
| Loan Product | Current Rate Range | Best For | Key Risk Factor |
| 30-Year Fixed Mortgage | 6.2% – 6.8% | Long-term predictability | Higher initial monthly outlay |
| 7/1 Hybrid ARM | 5.5% – 5.9% | Short-term ownership / flipping | Rate reset risk after year 7 |
| Commercial Refinance | 7.0% – 8.2% | Corporate asset restructuring | Strict DSCR lender covenants |
Actionable Steps for Successful Refinancing
To maximize your chances of securing favorable refinance terms in a volatile market, follow a disciplined preparation strategy.
Boost Your Credit Score Immediately: Lenders in 2026 are applying stringent credit tiering; a 20-point increase can drop your APR by a crucial quarter-point.
Shop Regional Credit Unions: Smaller financial institutions often offer portfolio loans with more flexible underwriting than major national banks.
Calculate the Break-Even Point: Ensure your total closing costs are recouped through monthly savings within 24 months of closing.
“Market Strategist View: Refinancing in 2026 is an exercise in opportunistic timing. Borrowers must maintain immaculate financial profiles ready to strike the moment Treasury yields dip.”
Mastering the complexities of today’s debt environment ensures you can successfully lower your debt service costs and protect your long-term financial stability.
Discover more from The Economy
Subscribe to get the latest posts sent to your email.

The days of pulling generic auto insurance quotes based purely on your zip code and age are officially over. In 2026, insurance comparison engines are powered entirely by generative AI and real-time telematics. These platforms digest thousands of live data points—ranging from your driving smoothness via connected vehicle sensors to real-time traffic congestion patterns—to generate hyper-personalized premiums instantly.
For consumers, this evolution represents both a massive opportunity for savings and a hidden trap for penalty pricing. Understanding how AI algorithms evaluate risk is essential for anyone looking to lower their monthly auto insurance premiums.
How AI Comparison Engines Evaluate Your Risk Profile
Behavioral Telematics and Connected Cars
Modern cars stream performance data directly to insurance aggregators. Generative AI models analyze braking sharpness, acceleration curves, cornering G-forces, and phone distraction metrics. Drivers who maintain smooth, defensive habits are rewarded with dynamic rate cuts of up to 40% compared to traditional rating tiers.
Predictive Traffic and Weather Modeling
AI tools now cross-reference your daily commute route with predictive weather and accident probability models. If your standard parking location or driving corridor has a statistically higher incidence of uninsured motorist claims, your quotes will reflect that hyper-local risk assessment.
| Comparison Factor | Traditional Rating Model | 2026 Generative AI Model | Impact on Premium |
| Mileage & Usage | Annual estimated odometer reading | GPS tracking & live trip duration | High (up to 35% savings) |
| Driving Behavior | MVR driving record & accidents | Real-time braking, speed, & G-force | Critical (determines tier) |
| Vehicle Tech | Make, model, and safety rating | ADAS calibration & repair cost data | Moderate |
Strategies to Lower Your AI-Driven Insurance Quote
To outsmart the algorithm and secure the lowest possible premium in 2026, drivers must proactively manage their digital footprint on insurance platforms.
Opt-In for Telematics Trial Periods: Many insurers offer immediate 15% discounts just for installing their driving app; let it track safe habits for 30 days to lock in permanent savings.
Scrub Unverified Public Records: Ensure your motor vehicle report is free of clerical errors that AI risk models misinterpret as reckless behavior.
Compare AI Aggregators: Use platforms that integrate multi-carrier API feeds rather than single-brand comparison sites to find the best risk-adjusted rate.
“Industry Note: AI-driven pricing rewards transparency and precision. Drivers who actively manage their telematics data consistently out-save those relying on legacy quote calculators.”
Embracing AI comparison tools allows savvy policyholders to customize coverage limits precisely to their driving habits, eliminating wasted premium spend while ensuring robust protection.
Discover more from The Economy
Subscribe to get the latest posts sent to your email.

US 10-Year Yield Hits 5.24%: What the Historic Bond Market Sell off Means for Mortgages and Investors

Battle for the Farm Belt: How Tariff Pressures and Fuel Costs Are Reshaping Iowa’s 2026 Midterms

Southeast Asia’s Critical Minerals Power Play: Can ASEAN Avoid Choosing Between China and the US?

MAS Allocates S$1.45 Billion to Five Asset Managers in Third EQDP Batch: Total Deployment Reaches S$5.4 Billion

Beyond Singapore’s Borders: How Squeezed SMEs Can Unlock High-Yield Growth Across ASEAN

Bank Jago’s Wealth Management Push:Indonesia’s 31.1 Million Investors boom

Beyond the Four-Year Degree: The $100K+ Trade Careers Young Americans Are Overlooking

SpaceX Starship Achieves First Full Orbit on Historic 10-Hour Test Flight 14

Google’s $15B Finland AI Investment: Data Centers, Nuclear Power & Jobs

Fast Invoice Factoring: Rates, APR Math & Contract Traps

SOC 2 Type II Guide: Cost, Timeline & Compliance Companies

Hong Kong Wages Surge 3.4% in June: Sector Data & Analysis

Silver Price Today: Why the Xi-Trump AI Standoff Is Fueling a Safe-Haven Rally

Citibank & Dólar Estadounidense: Forex Playbook After the Xi-Trump Truce

Top 30 Stocks for Investment in PSX for Massive ROI in 2026

Oil Prices Break $100 in 2026: Middle East Conflict & Energy Markets

BRICS+ Cross-Border Payments 2026: Interoperability Explained

Fidelity Investments Review 2026: SPAXX Yields & Zero-Fee Funds

10-Year Treasury Yield Hits 4.80%: What It Means for Rates & Portfolios

IMF & World Bank 2026 Global Economic Outlook: Growth, Inflation, Debt

Shein Clothes Quality & Safety in 2026: What Lab Tests Show

China’s US$10.8 Billion Trade Shortcut: Why the Pinglu Canal Matters

High-CPM Finance Niches 2026: Publisher Monetization Blueprint

Middle East War Economics 2026: Oil Prices & Energy Markets

China Stocks Today: Are Big Economies in Asia Nearing a Market Bottom?

Social Security Trust Fund 2032: OASI Depletion Timeline Explained

Global Pension Systems Ranked: The World’s Best and Worst Retirement Frameworks

Enterprise AI Platforms Disrupting B2B SaaS in 2026: Full Analysis
-

 Markets & Finance9 months ago
Top 15 Stocks for Investment in 2026 in PSX: Your Complete Guide to Pakistan’s Best Investment Opportunities
-

 Analysis7 months ago
Johor’s Investment Boom: The Hidden Costs Behind Malaysia’s Most Ambitious Economic Surge
-

 Analysis7 months ago
Top 10 Stocks for Investment in PSX for Quick Returns in 2026
-

 Banks8 months ago
Best Investments in Pakistan 2026: Top 10 Low-Price Shares and Long-Term Picks for the PSX
-

 Analysis8 months ago
Brazil’s Rare Earth Race: US, EU, and China Compete for Critical Minerals as Tensions Rise
-

 Investment9 months ago
Top 10 Mutual Fund Managers in Pakistan for Investment in 2026: A Comprehensive Guide for Optimal Returns
-

 Global Economy9 months ago
15 Most Lucrative Sectors for Investment in Pakistan: A 2025 Data-Driven Analysis
-

 Global Economy9 months ago
Pakistan’s Export Goldmine: 10 Game-Changing Markets Where Pakistani Businesses Are Winning Big in 2025