
Global Finance
Fast Invoice Factoring: Rates, APR Math & Contract Traps

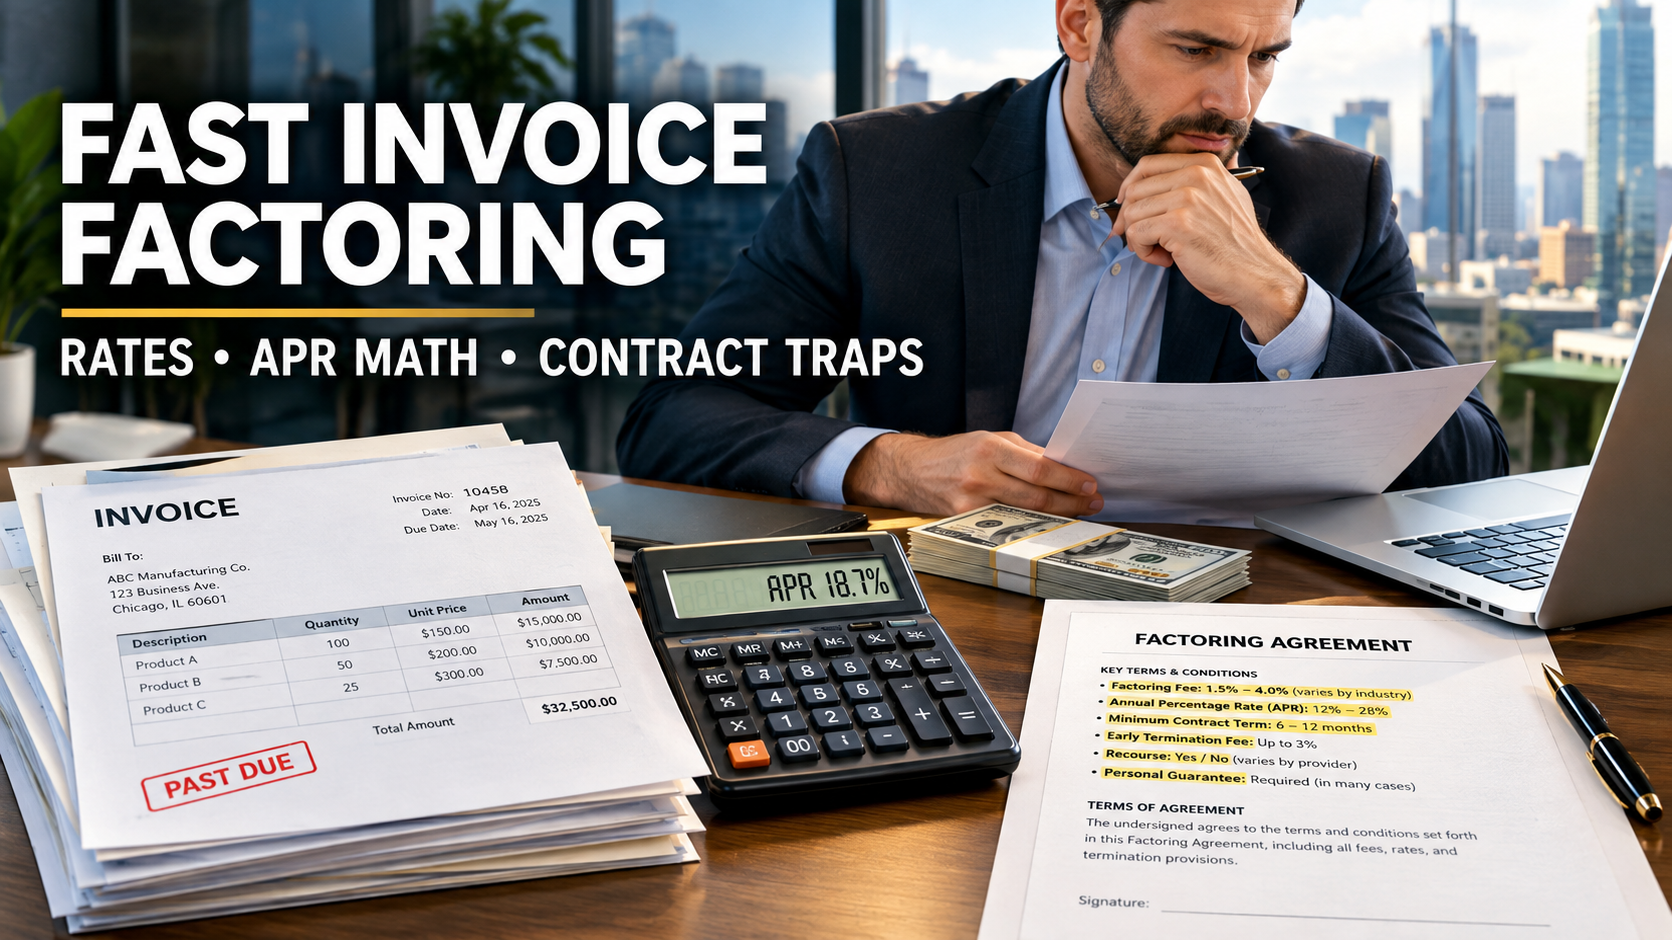
Fast invoice factoring converts unpaid B2B invoices into cash within one to two business days at a discount fee that typically runs 1% to 5% of invoice value per 30 days, with advance rates of 80% to 100% depending on the provider. On an annualized basis, that fee can equate to roughly 12% to 60% or more, which is why CFOs should compare factoring on effective APR rather than the headline rate.
Provider pricing in this guide is drawn from Forbes Advisor’s factoring rankings and NerdWallet’s factoring company guide. Legal framing references the Uniform Commercial Code as published by Cornell Law School. Ranges move with credit conditions; confirm live quotes before you sign.
Executive Summary & Core Benchmarks
Factoring is an asset sale, not a loan. You sell receivables to a factor, receive an advance, and get the reserve back after your customer pays, minus fees. Your customers’ credit quality matters more than yours.
| Metric | 2026 Benchmark | Source signal |
|---|---|---|
| Factoring fee | 1%-5% per 30 days (some tiers 2.5%-5%) | Forbes Advisor lists 2.5%-5% for one online leader |
| Advance rate | 80%-100% of invoice face value | NerdWallet lists advances up to 90% and 100% (minus fees) |
| Lowest published starting fee | ~0.8% | NerdWallet on a direct-lender factor |
| Funding speed | Next-day standard; same-day for an added fee | Forbes Advisor |
| Origination fees | $150-$500 or up to 1% of the advance | NerdWallet |
| Spot factoring | Often 3%-6% per invoice | Higher price for no commitment |
| Effective APR on a 2% / 30-day fee | Roughly 24%-27% | Calculated below |
| Target payback logic | Use only when gross margin exceeds annualized cost | See ROI section |
Key takeaway: The fee is the visible price. The reserve holdback, ancillary charges and days-to-pay determine the real price.
1: Strategic Overview & Commercial Drivers
B2B growth companies hit a structural cash gap. You pay salaries, contractors and cloud bills this month. Your customers pay on net-30, net-60 or net-90 terms. Growth widens the gap because each new contract requires working capital before revenue arrives.
Factoring closes that gap without new debt on the balance sheet. It suits companies with creditworthy commercial customers, invoices that are undisputed, and a need for speed.
Where factoring fits in the capital stack
Factoring is not a replacement for every financing product. Position it by use case.
- Bank line of credit: cheaper when you qualify, slower to arrange, and tied to your own credit and financials.
- Term loan: suits capital expenditure, not receivables timing.
- Invoice factoring: best when speed matters and your customers’ credit is stronger than yours.
- Spot factoring: best for one-off cash crunches, at a premium.
Some providers do not run a traditional credit check on the applicant. Forbes Advisor’s review notes one lender evaluating bank account and accounting software data instead, and requiring invoices to be under 90 days old.
Unit economics: when it pays
Factoring pays when the gross profit on work you can now afford to accept exceeds the factoring cost.
Factoring Net Benefit = (Incremental Gross Profit Enabled) − (Factoring Fees + Ancillary Fees)
An illustrative example: a $100,000 invoice factored at 3% total fee costs $3,000. If access to that cash lets you fulfill a second $100,000 order at 35% gross margin, you earn $35,000. The net benefit is $32,000. If the cash only prevents a late vendor payment with no growth effect, the math is much weaker.
2: Comprehensive Evaluation Matrix
Compare providers on five quantitative vectors: fee, advance rate, speed, fees beyond the discount rate, and fit. The data below is published by the outlets cited. Pricing bases differ, so read the footnotes.
Table 1: Provider comparison
| Provider (as reviewed) | Published factor fee | Advance rate | Funding speed | Additional costs and fit |
|---|---|---|---|---|
| FundThrough | 2.5%-5% (Forbes Advisor); 2.75%-8.25% on 30-day terms (NerdWallet) | Up to 100% minus fees | Next day; same-day costs extra | No credit check; invoices must be under 90 days; funding up to $10 million |
| altLINE (division of a bank) | From ~0.8% (NerdWallet) | Up to 90% | Fast; direct-lender decisions | Origination fee $150-$500 or up to 1% of advance |
| RTS Financial | Quote-based | Trucking-focused | Within 24 hours via web portal | Specialist for trucking and freight |
Why do Forbes Advisor and NerdWallet list different FundThrough ranges? They appear to reflect different pricing bases and time periods. Treat any published range as a starting point for negotiation, not a quote.
Table 2: Factoring structure comparison
| Structure | Who bears customer non-payment | Cost profile | Best for |
|---|---|---|---|
| Recourse factoring | You | Lower fees | Companies with reliable customers |
| Non-recourse factoring | Factor, within defined credit-loss limits | Higher fees; often with exclusions | Concentrated or higher-risk receivables |
| Spot factoring | Depends on contract | 3%-6% per invoice per one provider guide | One-off needs |
| Contract factoring | Depends on contract | Lower rate, volume commitments | Predictable monthly volume |
| Non-notification | Depends on contract | Customer does not see the factor | Brand-sensitive relationships |
Prime-plus pricing also exists. One provider guide describes structures tied to the prime rate plus a spread, which may suit large invoice volumes (Crestmont Capital).
3: Step-by-Step Implementation & Procurement Blueprint
Run factoring like a procurement project, not a panic button.
Implementation framework
- Audit your receivables. Age every invoice. Flag disputes, retainage, milestone billing and related-party customers. Factors reject disputed invoices.
- Rank customers by credit quality. Your best-paying enterprise customers are your most financeable.
- Calculate your cash-conversion gap. Use: Days Sales Outstanding − Days Payable Outstanding. A large positive gap is the structural need.
- Decide the structure. Recourse for low-risk books. Non-recourse when concentration risk is high. Spot for one-off events.
- Request written quotes from three factors. Ask each for the full fee schedule: discount rate, tier steps after day 30, origination, ACH or wire fees, same-day funding fees, minimums and termination fees.
- Model the effective APR for each quote at your actual average days-to-pay.
- Review the lien scope. Confirm whether the factor files a blanket lien on all assets or only on the receivables it buys.
- Negotiate the contract. Focus on term length, minimum volume, auto-renewal notice and early termination.
- Notify customers appropriately. Under UCC Section 9-406, an account debtor may pay the assignor until it receives authenticated notification of the assignment. After notification it must pay the assignee (Cornell LII: UCC 9-406).
- Pilot with one customer. Test funding speed, reporting and collections tone before you factor the whole book.
Risk checks before signing
- Customer concentration: if one customer exceeds a large share of your invoices, expect concentration caps.
- Cross-default: does factoring default trigger a default under your bank facility?
- Existing liens: a prior lender’s blanket lien may conflict with the factor’s security interest.
- Reporting burden: confirm what schedules and verification the factor requires.
Model your effective APR before you sign. Use our factoring calculator to compare three offers on the same invoice batch. Open the calculator
4: Cost Analysis, Contract Traps & ROI Mathematics
Core fee math
A factoring transaction has three moving parts: the advance, the reserve and the fee.
Advance = Invoice Face Value × Advance Rate
Reserve = Invoice Face Value − Advance
Rebate to You = Reserve − Factoring Fees
Net Proceeds = Advance + Rebate
Worked example. A $100,000 invoice, 85% advance rate, and a fee of 2% for the first 30 days plus 0.5% per additional 10-day period. The customer pays on day 50.
- Advance: $85,000
- Reserve: $15,000
- Fee: 2% + (2 × 0.5%) = 3% = $3,000
- Rebate: $15,000 − $3,000 = $12,000
- Net proceeds: $97,000
The tiered fee structure mirrors examples published by Crestmont Capital. Your contract’s tiers will differ.
Effective APR formula
Factors quote per-period fees. Lenders quote annual rates. Convert to compare.
Effective APR ≈ (Total Fee ÷ Cash Advanced) × (365 ÷ Days Outstanding)
For the example above: $3,000 ÷ $85,000 = 3.53%. Multiply by 365 ÷ 50 = 7.3. The effective APR is about 25.8%.
Notice that a simple 2% fee on a 30-day invoice with a 100% advance is about 24% annualized, and a lower advance rate raises the effective rate because the fee is charged on the full face value while you receive less cash. Always use cash advanced in the denominator.
Cost stack beyond the discount rate
| Cost line | What to ask | Typical signal |
|---|---|---|
| Discount fee | Flat or tiered? Step-up after day 30? | 1%-5% per 30 days is common |
| Origination fee | One-time or per schedule? | $150-$500, or up to 1% of the advance, on one direct lender (NerdWallet) |
| Same-day funding | Per-transaction fee? | Extra charge noted by Forbes Advisor |
| Early payment or rebate mechanics | How is the reserve released? | Varies |
| Monthly minimums | Fee if volume falls short? | Frequently negotiable |
| Termination fees | Penalty for leaving early? | Check notice periods |
| Lockbox and ACH fees | Who pays banking costs? | Small but recurring |
Contract traps
- Minimum volume clauses. You pay a fee even if you factor less than the agreed minimum.
- Auto-renewal with long notice. Negotiate notice windows down to 30 days where possible.
- Broad lien language. A lien covering all assets can block other financing.
- Notification control. Confirm the factor’s collection communications will not damage customer relationships.
- Chargeback and dilution rules. Understand how credits, discounts and disputes are treated.
- Anti-assignment clauses. Many customer contracts prohibit assignment. UCC 9-406(d) generally makes such terms ineffective against the assignment of accounts, but it has exceptions; read the text as codified in your state, for example New York’s version on FindLaw.
Ask counsel to review each of these. This guide is not legal advice.
ROI framework
Annualized Cost of Factoring = Effective APR × Average Cash Advanced Outstanding
Decision Rule: Factor when Incremental Gross Margin on Enabled Revenue exceeds Annualized Cost of Factoring plus internal administration cost.
If your gross margin is 20% and your effective factoring APR is 26%, factoring does not pay unless it prevents costlier outcomes such as missed payroll or lost contracts. If gross margin is 60%, the same APR is easily justified for growth spending.
5: Regulatory Compliance & Industry Standards
Factoring in the United States is governed mainly by state law under the Uniform Commercial Code, plus contract law and, for some structures, lending or usury statutes. Compliance points to know:
UCC Article 9
Article 9 covers sales of accounts and security interests in them. Factors typically file a UCC-1 financing statement to perfect their interest. Section 9-406 governs how an account debtor discharges its obligation and how notification of assignment works. The full text is available at Cornell LII.
Customer notification and payment redirection
After proper notification, your customer must pay the factor. If the customer pays you by mistake after notification, you hold those funds for the factor. Build a process to remit misdirected payments immediately. Failure to do so is a fast route to default.
Anti-assignment provisions
Many enterprise customer agreements contain no-assignment language. Statutory overrides exist for accounts, but customers may still resist. Check the specific state code and the customer agreement.
Lien coordination
If you already have a bank facility, seek an intercreditor or carve-out so the factor’s lien on receivables does not breach your bank covenants. Get written consent early.
Financial reporting
Whether factoring is treated as a sale or a secured borrowing on your balance sheet depends on contract terms and accounting standards. Confirm treatment with your auditor before you sign, because it affects covenant calculations.
Sanctions and KYC
Factors run know-your-customer checks on you and your customers. Expect requests for corporate documents, beneficial ownership and customer invoices.
Need a factoring contract review? Connect with commercial finance counsel who negotiate lien scope, minimums and termination terms. Find counsel
6: Enterprise Frequently Asked Questions (FAQ)
How fast can invoice factoring fund?
Many online factors fund within one business day after setup. Same-day funding is available from some providers for an added fee (Forbes Advisor). Initial onboarding, including account linking and verification, can take a few days.
What does fast invoice factoring cost?
Published ranges cluster at 1% to 5% of invoice value per 30 days, with some lenders starting near 0.8% and others quoting up to 8.25% on 30-day terms. The effective APR depends on the advance rate, tier step-ups and how long your customer takes to pay. A 2% fee over a 30-day invoice is roughly a 24%-27% annualized cost.
Is invoice factoring a loan?
Structurally, factoring is the sale of receivables, not a loan. That is why approval focuses on your customers’ creditworthiness. Accounting and legal treatment can vary by contract, so confirm with your auditor and counsel.
Recourse or non-recourse: which should a growth company choose?
Recourse factoring is typically cheaper because you keep the credit risk. Non-recourse shifts some of that risk to the factor, usually at a higher fee and with exclusions, such as disputes. Choose based on customer concentration and how reliably your customers pay.
Discover more from The Economy
Subscribe to get the latest posts sent to your email.


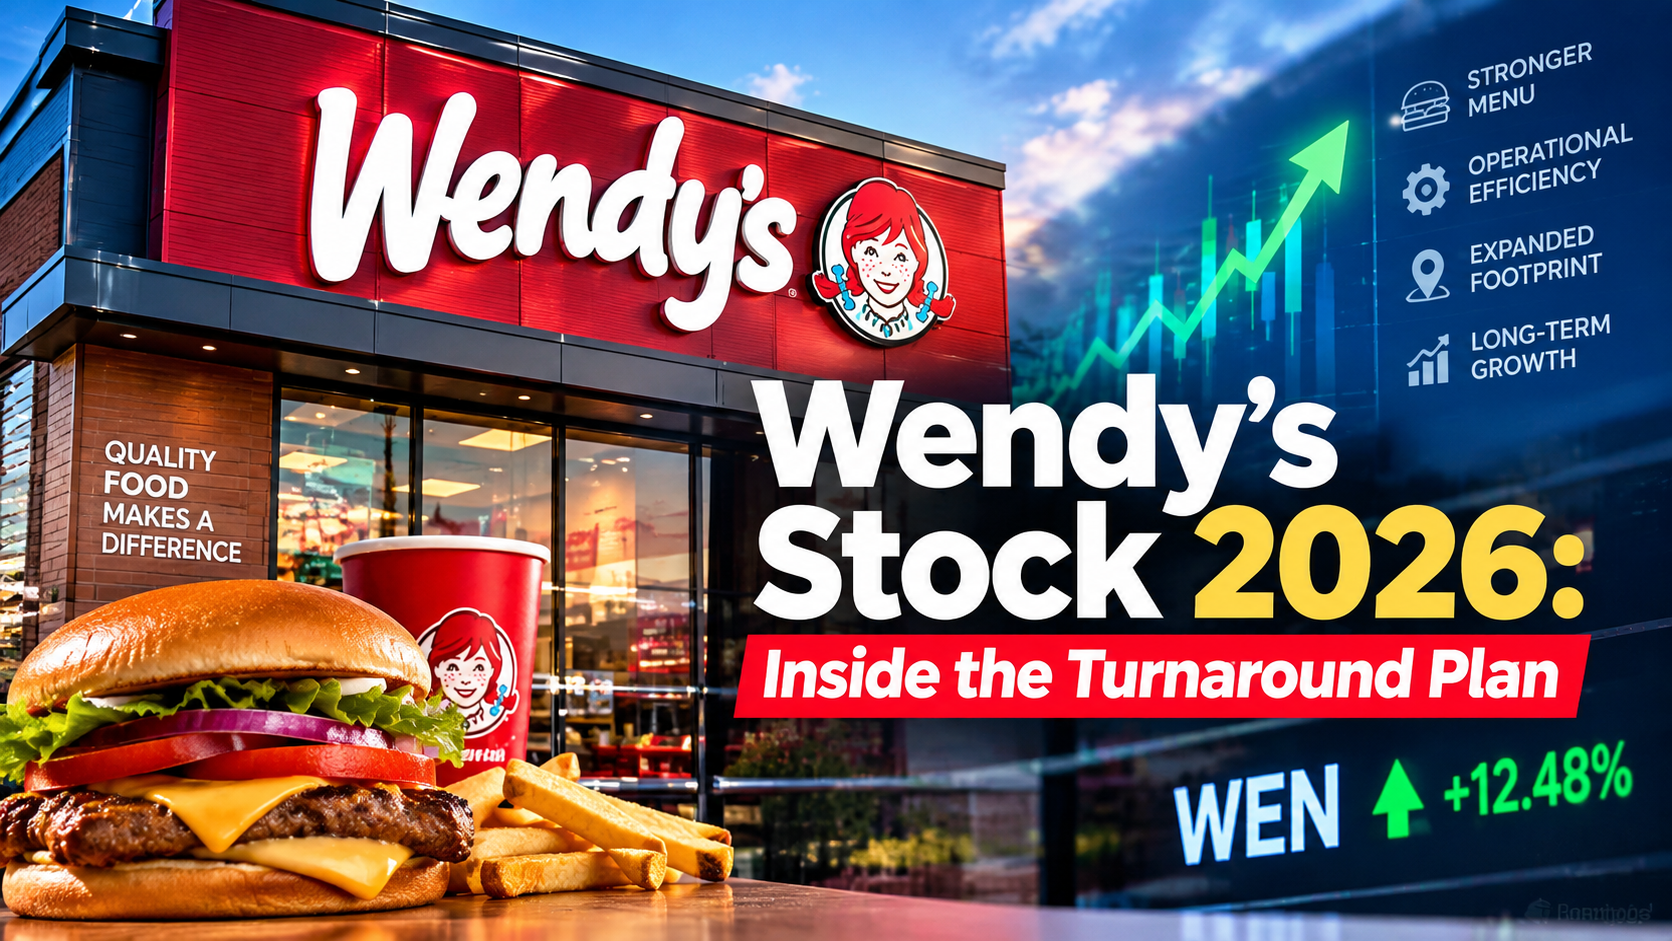
Why did Wendy’s stock fall in 2026? The Wendy’s Company withdrew its full-year 2026 financial outlook and cut its dividend to help fund a turnaround effort after reporting second-quarter results showing global systemwide sales down 6.5% year-over-year, according to the company’s official second-quarter earnings release. The decline was driven by an 8.2% drop in U.S. sales, only partially offset by 3.4% growth internationally — a split that has defined the company’s story for most of the year.
New leadership has been blunt about the scale of the problem. President and CEO Bob Wright, who returned to the company to lead the turnaround, said directly that traffic, the brand’s value proposition, and franchisee economics were not meeting expectations, while outlining five specific areas of focus: rebuilding a quality menu at compelling value, marketing that drives demand, operational excellence, a stronger digital experience, and turning restaurants themselves into a growth engine.
The Numbers Behind the Turnaround
Featured Snippet Target: Wendy’s Q2 2026 results showed revenue of $571 million, net income of $32.6 million, and adjusted EBITDA of $124.1 million, but global systemwide sales fell 6.5% year-over-year — driven primarily by an 8.2% U.S. sales decline — prompting the company to withdraw its full-year guidance and cut its dividend.
The pressure had been building for several quarters before the Q2 announcement. In the first quarter of 2026, Wendy’s reported revenue of $541 million (up 3.3% year-over-year) but adjusted earnings per share of just $0.12 — down 40% from $0.20 in the same quarter of 2025 — as global systemwide sales fell 5.5% on a constant-currency basis, driven by a 7.8% drop in U.S. same-restaurant sales, according to financial analysis from TIKR. Management attributed part of that decline to severe winter weather in January and February, alongside intentional operating-hour reductions tied to the company’s store-footprint optimization initiative, known internally as Project Fresh.
International growth has been the one consistent bright spot. Wendy’s international business delivered 6% systemwide sales growth in the first quarter, powered by new restaurant development in the Philippines and Mexico — a pattern that continued into the second quarter, when international sales grew 3.4% even as the U.S. business contracted sharply.
Is Project Fresh Actually Working?
Company-operated restaurants that have fully implemented the Project Fresh operational playbook outperformed the broader U.S. system by 310 basis points in same-restaurant sales during the first quarter, according to comments from Interim CEO and CFO Ken Cook on the Q1 earnings call — an early data point management has pointed to as evidence the turnaround approach works where it has actually been rolled out. On the subsequent Q4 earnings call, Cook told analysts that October marked the low point for the business, with sequential improvement through late 2025 and early 2026, before adverse January weather disrupted that recovery trend, according to call notes compiled by StockStory.
The restructuring has a real physical footprint: roughly 5% to 6% of U.S. Wendy’s locations are set to close, with most of those closures concentrated in the first half of 2026 — building on 240 U.S. location closures the chain had already carried out the prior year, according to reporting picked up by Fast Company. Franchisee buy-in has been a recurring analyst question on earnings calls, with Cook emphasizing frequent communication and flexibility as franchisees weigh whether the new operational playbook genuinely improves their unit economics.
What Wall Street Thinks
Analyst sentiment on Wendy’s stock has remained genuinely split rather than converging on a clear verdict. Coverage compiled by Barchart noted that the stock trades at roughly 12 times current-year earnings and under eight times 2030 forecasts — a valuation implying significant potential upside if the turnaround succeeds — but also flagged that the number of analysts covering the stock rose 30% in the first quarter of 2026 alone, with the resulting consensus landing on a “Hold” rating and a roughly even split between Buy and Sell recommendations. That’s an unusually wide disagreement for a large-cap consumer stock, reflecting genuine uncertainty about whether management’s turnaround playbook can offset structural share losses to competitors such as McDonald’s.
Rising beef costs added a separate layer of margin pressure through the first half of the year. Wendy’s Chief Accounting Officer and Global Head of FP&A Suzanne Thuerk indicated commodity inflation would run in the high single digits during the first half of 2026 due to double-digit beef inflation, before moderating to a low single-digit pace in the back half of the year as the company began cycling past the prior year’s elevated beef costs.
The Bottom Line
Wendy’s 2026 story is a genuine turnaround-in-progress rather than a settled outcome in either direction. The company has been transparent about the scale of its U.S. traffic and value-proposition problems, has a specific operational framework (Project Fresh) with early data suggesting it improves results where implemented, and has an international business that continues to grow steadily even as the U.S. core contracts. But the dividend cut, withdrawn guidance, and split analyst sentiment all signal that management itself is not yet confident enough in the pace of recovery to make firm forward commitments.
Next step: Investors and franchise-industry watchers should track same-restaurant sales trends specifically at fully-converted Project Fresh locations in upcoming quarters — that cohort, more than the blended company-wide average, is the clearest read on whether the turnaround strategy itself is working.
Discover more from The Economy
Subscribe to get the latest posts sent to your email.
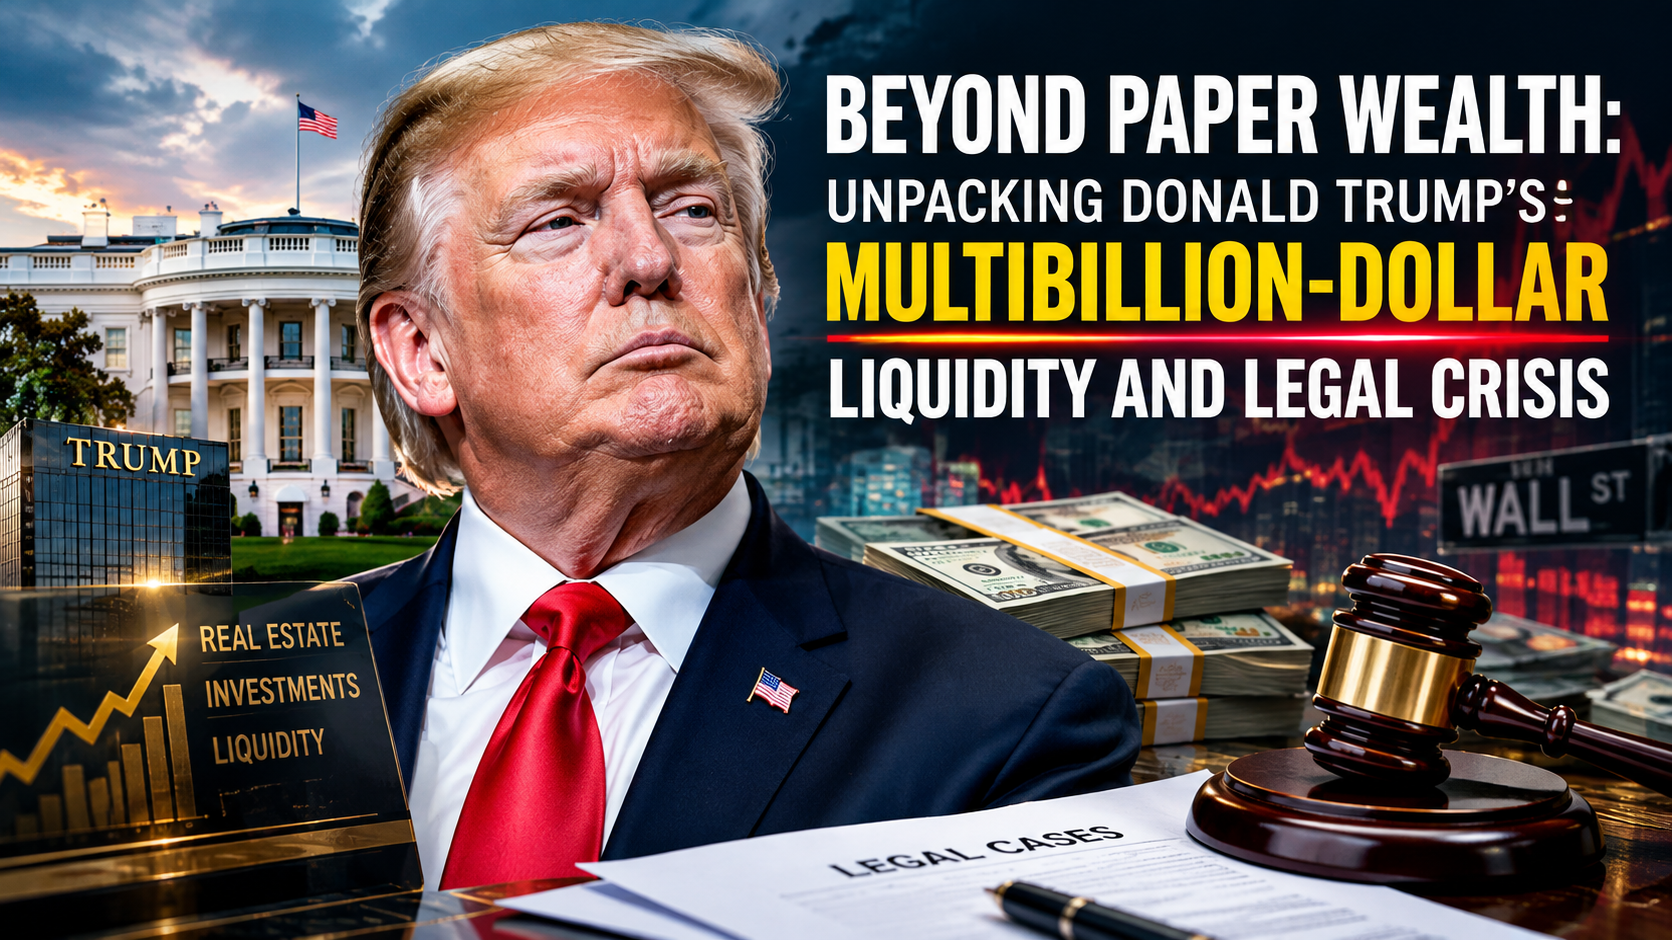
Former President Donald Trump’s financial balance sheet is undergoing unprecedented pressure. While his estimated net worth fluctuated dramatically following the public listing of Trump Media & Technology Group (TMTG), his real-world liquidity faces severe headwinds from court-ordered judgments, mounting interest, commercial real estate debt maturities, and escalating legal fees.
Understanding the magnitude of Trump’s financial landscape requires separating volatile paper equity from available cash, real estate assets, and legal liabilities.
1. The $454 Million Civil Fraud Judgment and Appeal Bond Dynamics
The largest immediate financial threat stems from New York State Supreme Court Judge Arthur Engoron’s ruling in the civil fraud lawsuit brought by New York Attorney General Letitia James.
- Initial Ruling: Trump was found liable for systematically inflating asset values to secure favorable loan terms and insurance rates.
- Financial Penalty: The court ordered disgorgement of approximately $354 million in ill-gotten gains, plus pre-judgment interest that pushed the initial obligation past $454 million.
- Accruing Interest: Statutory post-judgment interest accrues at 9% per annum (roughly $112,000 per day), steadily increasing the total debt while appeals proceed.
According to legal reporting from [Reuters], securing an appeal bond proved exceptionally difficult. Over 30 surety companies rejected Trump’s requests to guarantee the full amount without liquid collateral, as insurers overwhelmingly refuse to accept real estate as bond backing. An appellate bench subsequently allowed a reduced bond of $175 million, which Trump posted via Knight Specialty Insurance Company to stay enforcement while the appellate division reviews the merit of the ruling.
2. E. Jean Carroll Defamation Verdicts: $88.3 Million in Liability
In addition to state-level regulatory judgments, federal jury decisions in New York have created substantial financial commitments:
| Case | Jury Award | Status / Collateral Mechanism |
| Carroll I (Sexual Abuse & Defamation) | $5.0 Million | Placed in court-monitored escrow during appeal. |
| Carroll II (Defamation) | $83.3 Million | Secured via an $91.6 million appeal bond posted through Federal Insurance Co. (Chubb). |
As detailed by [CNBC], these judgments require collateralization regardless of ongoing appeals. Trump was forced to lock up cash or liquid securities to secure these bonds, directly contracting his available operational liquid reserves.
3. Trump Media (DJT): Paper Billions vs. Realizable Cash
The public debut of Trump Media & Technology Group Corp. (NASDAQ: DJT) via a SPAC merger briefly added billions to Trump’s paper net worth. However, financial analysts at [Forbes] note that transforming paper valuation into usable cash presents critical structural obstacles:
- Fundamental Disconnect: TMTG’s multi-billion-dollar valuation stands in stark contrast to its underlying balance sheet, which showed modest revenues against notable operational expenses.
- Market Impact of Cashing Out: Trump owns roughly 57% to 60% of the company. Any large-scale liquidation of his shares to cover cash liabilities risks signaling a loss of confidence, potentially triggering a sharp price decline before significant volume can be sold.
- Lock-Up Agreement Expirations: While lock-up restrictions initially prevented insider selling, the expiration of these periods subjects the stock to heightened market volatility and short-selling pressure.
4. Commercial Real Estate Exposure & Refinancing Headwinds
A substantial portion of Trump’s traditional wealth remains tied up in commercial real estate—a sector currently suffering from high interest rates, declining office occupancies, and tightened banking credit standards.
Trump Asset Portfolio Exposure
├── Commercial Properties (High debt exposure / Refinancing risk)
│   ├── 40 Wall Street (NYC)
│   └── Trump Tower Commercial Space (NYC)
├── Golf Courses & Resorts (Stable cash flow / High capital expenditure)
└── Brand Licensing & Cash Equivalents (Encumbered by legal escrow/bonds)
Key commercial debt obligations reported by [The Wall Street Journal] highlight specific vulnerabilities:
- 40 Wall Street (New York): The property’s debt was placed on lender watchlists in recent years due to rising vacancy rates, falling net operating income (NOI), and elevated ground-lease costs.
- Refinancing Risks: With commercial mortgage-backed securities (CMBS) debt maturing across several properties, refinancing in a high-rate environment significantly increases debt service payments, squeezing operational margins.
5. Political Action Committee (PAC) Legal Expense Drain
Legal fees have consumed a massive share of Trump’s available political fundraising funds. As documented by [The New York Times], Donald Trump’s leadership PAC, Save America, has spent tens of millions of dollars funding legal defense fees for the former president and co-defendants across multiple jurisdictions.
This drain on donor funds creates a dual liability:
- It diverts resources away from political field operations and advertising.
- It exposes the campaign structure to ongoing cash demands as criminal and civil proceedings drag on.
Financial Outlook & Solvency Risks
Trump’s asset portfolio is characterized by a strong imbalance between illiquid real estate equity and immediate cash demands.
Total Cash Demands (Judgments + Bonds Posted) : ~$260M+ Cash Restricted/Encumbered
Pending Liabilities (If Appeals Fail)        : ~$540M+ Total Direct Civil Cash Penalties
While Trump’s overall asset base—including golf courses, residential property, and brand licensing—remains valuable, his immediate solvency depends heavily on appellate court decisions. Should the appellate courts uphold the full civil fraud judgment without reduction, the need for immediate cash could force distressed asset sales or high-cost private equity financing, fundamentally altering the Trump Organization’s financial baseline.
Discover more from The Economy
Subscribe to get the latest posts sent to your email.

The IMF’s July 2026 update projects global growth of 3.0% for 2026 and 3.4% for 2027 — a modest slowdown from the 3.5% average of 2024–25, driven by the economic drag of the Middle East conflict being partly offset by an accelerating AI-driven technology cycle. In short: the world economy is being carried by one trade, and it is concentrated in a handful of companies.
That single sentence captures the defining tension of the 2026 economy. Two forces are pulling in opposite directions, and which one wins will determine whether this is remembered as the year markets shrugged off geopolitical risk, or the year they didn’t see the correction coming.
The IMF’s Divergent World
According to the IMF’s World Economic Outlook Update, the growth slowdown is not evenly distributed. Economies deeply integrated into the AI and technology value chain — chiefly the United States and parts of Asia — are absorbing the benefits of the technology boom, while energy-importing and conflict-adjacent economies are absorbing most of the damage. That divergence has been the throughline of every IMF release this year: the April 2026 edition, published as the Middle East conflict first erupted, had cut its forecast to 3.1% for 2026 under a “reference forecast” that assumed the war would stay limited in scope and duration, while warning that a longer or broader conflict — or a reassessment of AI-driven productivity expectations — could meaningfully weaken growth.
For content targeting “IMF reports” and “world economy” search intent, the practical takeaway is this: growth forecasts have been revised four times in twelve months, each revision hinging on two swing factors — the war’s duration and the durability of the AI capital-spending cycle. Anyone publishing on this topic needs to track both, because either one turning could flip the entire growth story.
Wall Street’s AI Concentration Problem
Featured Snippet Target: Three companies — Alphabet, Amazon, and Meta — are now expected to drive roughly 70% of the S&P 500’s 2026 earnings growth, according to Charles Schwab’s market analysis, with combined 2026 capital expenditure guidance exceeding $500 billion. That concentration means the index’s headline diversification is largely cosmetic; its performance now rides on whether a handful of hyperscalers convert AI spending into earnings.
This is the risk hiding inside every “stock market today” headline. Reuters reported the S&P 500 climbing to a record high in early January 2026, powered by gains in Nvidia and Alphabet, with one Tulsa-based fund manager summing up the prevailing mood as a repeat of the prior year’s approach — buy the AI leaders and hold. Since then, hyperscaler capital spending has only accelerated: Alphabet, Amazon, and Microsoft each posted capex increases of well over 25% year-on-year in recent quarters, and combined hyperscaler AI spending commitments for 2026 have topped $700 billion, according to reporting relayed through Yahoo Finance’s technology coverage.
That spending is no longer being funded purely out of free cash flow. A growing share is debt-financed — Macquarie’s Investment Strategy Insights noted that consensus hyperscaler capex estimates for FY26–FY28 were revised up from roughly $2.5 trillion to $2.8 trillion during the reporting season, with gross debt issuance expected to peak near $460 billion in FY28, or about a third of total capex. Analysts have started describing this shift as a change in market character altogether — a move from an era where buybacks reliably supported share prices to one where capital expenditure, not shareholder returns, is what the market rewards.
That has two implications for markets content this year. First, market concentration has hit levels not seen since the dot-com era — roughly two dozen stocks now account for over half of the S&P 500’s total value, which is a comparable concentration level to the 32-stock peak reached during the 2000 bubble. Second, volatility has already started creeping back in: CNBC flagged in mid-September that bond yields were spiking and AI-linked names were selling off even as broader investor sentiment stayed constructive on equities — a split market where the AI trade and the rest of Wall Street are no longer moving in lockstep.
Why the Divergence Matters for Every Asset Class
The IMF’s macro divergence and Wall Street’s AI concentration are, in effect, the same story told twice — a bet on a narrow slice of the global economy carrying the rest. Energy importers and low-income developing economies are absorbing the geopolitical shock the IMF describes, just as the “average” S&P 500 stock is absorbing less of the earnings growth than the concentration numbers suggest. Both dynamics raise the same underlying question for 2026 planning: what happens to growth, and to equity valuations, if either pillar — the ceasefire holding, or hyperscaler capex converting into real earnings — gives way.
For now, neither has. The IMF’s reference forecast still assumes the conflict stays contained, and hyperscaler earnings, so far, have largely met or beaten the market’s demanding bar: Alphabet’s April quarter, for instance, saw earnings per share and Google Cloud growth both come in well ahead of consensus. But both are assumptions, not certainties, and the 2026 economy is being priced as though they will hold indefinitely.
The Bottom Line
Global growth of 3.0% sounds unremarkable in isolation. What makes 2026 distinctive is how much of that growth — and how much of the corresponding equity market gains — is concentrated in AI infrastructure spending by a small number of companies and countries. Investors, policymakers, and anyone allocating capital this year need to treat the AI capex cycle not as a side story to the macro picture, but as the macro picture’s main engine.
Next step: Track the IMF’s next World Economic Outlook update alongside hyperscaler earnings season — the two releases, taken together, are now the single best gauge of where the 2026 global economy is actually heading.
Discover more from The Economy
Subscribe to get the latest posts sent to your email.

SpaceX Starship Achieves First Full Orbit on Historic 10-Hour Test Flight 14

Google’s $15B Finland AI Investment: Data Centers, Nuclear Power & Jobs

Fast Invoice Factoring: Rates, APR Math & Contract Traps

SOC 2 Type II Guide: Cost, Timeline & Compliance Companies

Hong Kong Wages Surge 3.4% in June: Sector Data & Analysis

Silver Price Today: Why the Xi-Trump AI Standoff Is Fueling a Safe-Haven Rally

Citibank & Dólar Estadounidense: Forex Playbook After the Xi-Trump Truce

How the Trump-Xi White House Summit Is Reshaping Mortgage Rates Today for Real Estate Investors

Indonesia Navigates Mega-Project Risks as China and Russia Eye the 2,772km Trans-Kalimantan Railway

Trump-Xi 2026 Summit Takeaways: The Trade Truce, Taiwan, and the AI Divide

Solar Panel Installation Cost in 2026: Why the Math Changed Overnight

Business Insurance: What Coverage You Actually Need and What It Costs in 2026

Auto Insurance Quotes: How to Get the Lowest Rate Without Losing Coverage

Huntington Online Banking: Full Features, Fees, and How It Compares in 2026

Top 30 Stocks for Investment in PSX for Massive ROI in 2026

SpaceX Starship Flight 14: First Orbital Attempt & Starlink V3 Launch Explained

Oil Prices Break $100 in 2026: Middle East Conflict & Energy Markets

BRICS+ Cross-Border Payments 2026: Interoperability Explained

Fidelity Investments Review 2026: SPAXX Yields & Zero-Fee Funds

Tween Back-to-School Trends 2026: What’s Driving the $85B Season

10-Year Treasury Yield Hits 4.80%: What It Means for Rates & Portfolios

Shein Clothes Quality & Safety in 2026: What Lab Tests Show

IMF & World Bank 2026 Global Economic Outlook: Growth, Inflation, Debt

China’s US$10.8 Billion Trade Shortcut: Why the Pinglu Canal Matters

High-CPM Finance Niches 2026: Publisher Monetization Blueprint

Middle East War Economics 2026: Oil Prices & Energy Markets

China Stocks Today: Are Big Economies in Asia Nearing a Market Bottom?

Social Security Trust Fund 2032: OASI Depletion Timeline Explained
-

 Markets & Finance9 months ago
Top 15 Stocks for Investment in 2026 in PSX: Your Complete Guide to Pakistan’s Best Investment Opportunities
-

 Analysis7 months ago
Johor’s Investment Boom: The Hidden Costs Behind Malaysia’s Most Ambitious Economic Surge
-

 Analysis7 months ago
Top 10 Stocks for Investment in PSX for Quick Returns in 2026
-

 Banks8 months ago
Best Investments in Pakistan 2026: Top 10 Low-Price Shares and Long-Term Picks for the PSX
-

 Analysis8 months ago
Brazil’s Rare Earth Race: US, EU, and China Compete for Critical Minerals as Tensions Rise
-

 Investment9 months ago
Top 10 Mutual Fund Managers in Pakistan for Investment in 2026: A Comprehensive Guide for Optimal Returns
-

 Global Economy9 months ago
15 Most Lucrative Sectors for Investment in Pakistan: A 2025 Data-Driven Analysis
-

 Global Economy9 months ago
Pakistan’s Export Goldmine: 10 Game-Changing Markets Where Pakistani Businesses Are Winning Big in 2025