
Analysis
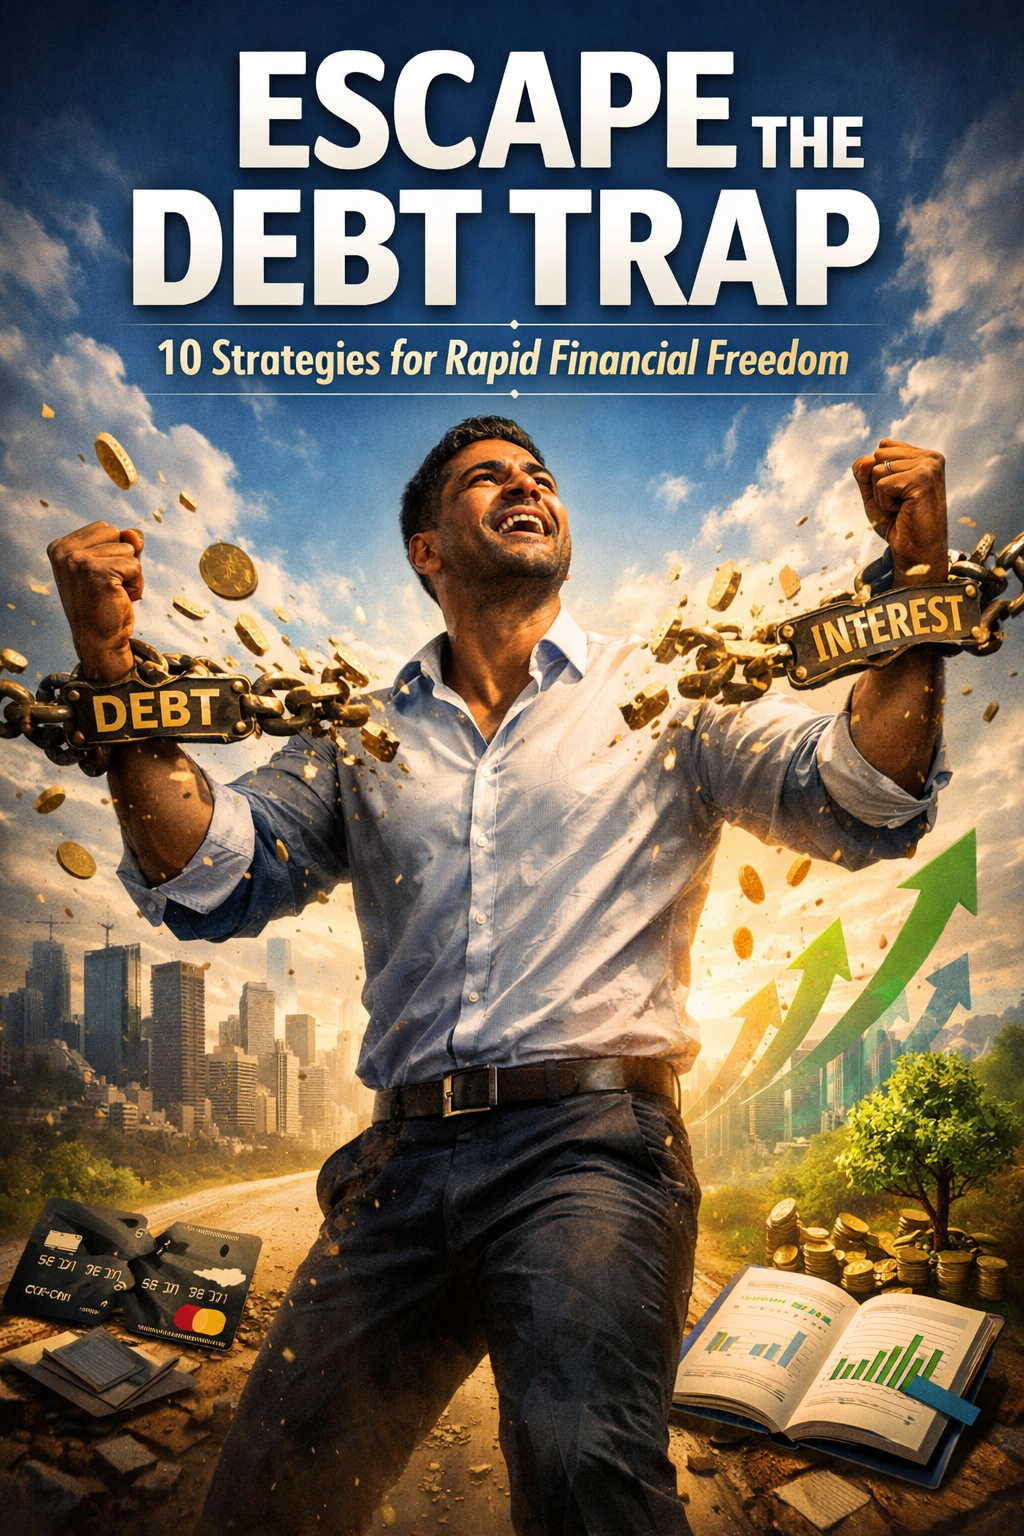
Escaping the Debt Trap: 10 Proven Strategies to Break Free and Accelerate Your Financial Progress in 2026

The Debt Trap Is Not a Personal Failure — It’s a Structural Problem
American households now owe a collective $18.8 trillion — a record high as of Q1 2026, per the Federal Reserve Bank of New York’s latest Household Debt and Credit Report. That figure rose by $18 billion in just the first quarter of this year alone. Credit card balances, the most corrosive form of consumer debt, stand at roughly $1.3 trillion nationally — a 63% increase from where they bottomed out during the pandemic in Q1 2021, according to LendingTree’s 2026 Credit Card Debt Statistics.
The average credit card APR sits at 21.52% as of Q1 2026, barely off its 2024 peak of 21.76%, per Federal Reserve data. For context: when the Fed started hiking rates in early 2022, the average APR hovered around 14.5%. That leap — seven full percentage points — has been devastating for the roughly 111 million Americans who carry a revolving balance month to month. If you owe the average credit card balance of $6,523 and make only minimum payments at 20% APR, you’ll still be paying it off in 219 months, having spent nearly $9,500 in pure interest charges. That’s not a debt. That’s a lease on poverty.
And yet. Twenty-three percent of Americans with credit card debt say they believe they’ll never get out of it, according to Bankrate’s 2025 Credit Card Debt Report. That’s not a financial statistic — it’s a psychological one. Hopelessness is the debt trap’s sharpest weapon.
This article exists to dismantle that hopelessness with something better: a precise, actionable, psychologically-informed playbook for escaping the debt trap in 2026. Not motivational slogans. Not vague advice to “spend less.” Real strategies, ranked and explained, with the data and behavioral science to back them up.
Strategy 1: Build an Airtight Budget — and Make It Ugly
Before you pay a single extra dollar toward debt, you need to know exactly where your money is going. Not approximately. Exactly. Most people who are in a debt trap think they know their spending — and are routinely off by 20 to 30 percent. That gap is the debt trap’s feeding ground.
The method that works isn’t the elegant 50/30/20 rule you see on Instagram. It’s a zero-based budget: every dollar of your take-home income is assigned a job before the month begins — including a “debt attack” category that sits right alongside rent and groceries, not below them. Apps like YNAB (You Need a Budget) or even a plain spreadsheet work for this. The point is assigning intentionality to every dollar.
Here’s the behavioral insight that most budgeting guides skip: the reason most budgets fail isn’t math — it’s friction. High friction between decision and spending keeps money in your pocket. Low friction (saved card numbers, one-click purchases, subscription auto-renews) bleeds you quietly. Audit every auto-renewal you carry. According to a 2025 CFPB consumer financial literacy study, recurring subscription costs are among the most systematically underestimated expenses in household budgets.
Make your budget ugly. Write your total debt number — every penny — on a sticky note and put it on your laptop, your fridge, your bathroom mirror. The research on debt payoff motivation consistently shows that visibility of the problem is a more powerful motivator than any reward system you can construct.
Strategy 2: The Debt Snowball vs. The Debt Avalanche — Choose Your Weapon
These two methods have been debated by personal finance writers for years, but most articles stop at the surface comparison. Let’s go deeper.
The Debt Snowball method, popularized by Dave Ramsey, asks you to list your debts smallest-to-largest by balance, pay minimums on all but the smallest, and throw every extra dollar at that smallest balance until it’s gone. Then you roll that payment into the next smallest. The psychological payoff — the “win” — comes fast and fuels momentum.
The Debt Avalanche method is mathematically superior: list your debts highest-to-lowest by interest rate, attack the highest-rate debt first regardless of balance size. You pay less total interest over time.
But which one should you use? It depends on your psychology, not your spreadsheet. A landmark 2016 study from the Kellogg School of Management, replicated in behavioral finance research since, found that people who use the snowball method are significantly more likely to stay committed because early wins create momentum. If your high-rate debt is also your largest balance — as is common with credit cards — the avalanche can feel like climbing a mountain in the dark. Starting with a $400 store card you can knock out in two months? That’s gasoline.
Verdict: If you are struggling with motivation or have been stuck for a long time, start with the snowball. Once you’ve gained confidence and built the habit, mathematically transition to the avalanche for the remaining balances. Hybrid approaches work.
📊 Debt Snowball vs. Debt Avalanche — Quick Comparison
| Feature | Debt Snowball | Debt Avalanche |
|---|---|---|
| Payoff order | Smallest balance first | Highest interest rate first |
| Total interest paid | Higher (mathematically) | Lower (mathematically optimal) |
| Psychological benefit | High — fast wins | Moderate — slower gratification |
| Best for | Motivation-driven personalities | Math-driven, disciplined planners |
| Risk of abandonment | Lower (momentum builds) | Higher if high-rate debt is large |
| Time to first payoff | Faster | Slower (unless high-rate = small balance) |
| Recommended when | Feeling stuck or overwhelmed | High-rate balances are manageable size |
Strategy 3: Debt Consolidation and Balance Transfers — Use the System Against Itself
Here’s the part of the debt trap almost no one explains clearly: the interest rate system that built your debt trap can also be used to dismantle it, if you’re strategic.
Balance transfer cards with 0% introductory APR are among the most powerful tools in the debt-freedom arsenal. As of 2026, some issuers are offering 0% APR periods of up to 21 months. If you owe $8,000 at 21% and transfer it to a 0% card, you pay a transfer fee (typically 3–5%) and then have nearly two years where every payment you make hits principal directly. The math is unambiguous: at 21% APR, that $8,000 costs you roughly $140/month in interest alone. On a 0% card, that $140 becomes principal payoff.
The catch: You need a credit score of roughly 670 or above to qualify. And you must have the discipline not to run up new balances on your old card. For many people, a balance transfer card is a lifeline they then immediately sabotage by treating the old card as “free space.” Cut the old card up. Literally.
Personal loan consolidation is the second route. Personal loan APRs average closer to 11–12% in 2026 — significantly lower than most credit card rates. Consolidating $15,000 in credit card debt at 22% into a personal loan at 12% and fixed monthly payments is straightforward interest arbitrage. The fixed-payment structure also removes the seductive “minimum payment” option that keeps credit card debtors in the trap indefinitely.
For deeper guidance, the Consumer Financial Protection Bureau provides a clear breakdown of consolidation options and their implications for your credit.
Strategy 4: Attack Your Income — Not Just Your Expenses
Every article about getting out of debt eventually tells you to “cut your lattes.” And yes, behavioral spending audits matter (see Strategy 1). But there is a ceiling on how much you can cut. There is no ceiling on how much you can earn.
In the current gig and AI-augmented economy, the income side of the ledger has never been more accessible to someone willing to invest 10–15 hours a week. The categories worth pursuing in 2026:
- AI-assisted freelancing (content, data annotation, prompt engineering, virtual assistance): Platforms like Upwork and Fiverr show strong demand. Median hourly rates for competent AI-assisted writers and editors now exceed $35/hour.
- Tutoring and skills instruction: If you have any professional expertise, platforms like Wyzant, Preply, or even direct LinkedIn outreach can generate $30–$75/hour. Math, accounting, English, and coding remain in perpetual demand.
- Reselling and arbitrage: Retail arbitrage on eBay or Mercari, combined with estate sale or thrift store sourcing, can generate $500–$1,500/month for someone systematic about it.
- Weekend services: Dog walking, cleaning, furniture assembly (TaskRabbit), food delivery. Not glamorous. Directly effective.
The goal here is not to build a second career. It’s to generate an additional $500–$1,000/month earmarked entirely for debt payoff. At $700/month of additional payments on a $12,000 debt at 20% APR, you cut the payoff timeline from 11 years (minimum payments) to roughly 22 months. That is the difference between an education and a sentence.
Strategy 5: Cut Expenses Ruthlessly — But Surgically
There’s cutting expenses the emotional way (panic, sacrifice, resentment) and the analytical way (systematic audit, priority-based elimination, structural changes). One is sustainable. The other leads to giving up in month three.
Start with the structural changes that compound: cancel or downgrade subscriptions (the average American household pays for 4–6 streaming services simultaneously), renegotiate your internet and phone contracts (a 10-minute call annually can save $200–$400/year), and examine your insurance policies. Refinancing car insurance or bundling policies with a single carrier routinely saves $500–$800/year without any lifestyle sacrifice.
Then look at the variable spending. Groceries are typically the most elastic major expense in a household budget. Meal planning, store-brand substitutions, and reducing food waste (the average American household wastes roughly 30–40% of purchased food, according to the USDA Economic Research Service) can cut grocery spend by 15–25% without eating worse.
One rule of thumb that actually works: For every non-essential purchase over $50, impose a 48-hour waiting period. This single friction intervention, drawn from behavioral economics research on impulse spending, has been shown to reduce discretionary spending by 20–30% in studies on consumer delay strategies. It’s not discipline. It’s design.
Strategy 6: Negotiate Directly with Creditors — It Works More Often Than You Think
This strategy is underused to a degree that borders on irrational. Credit card companies and lenders are not adversaries in the way people imagine. They are businesses with a strong financial preference for receiving some payment over chasing a defaulted account. And they negotiate.
What you can ask for:
- Interest rate reduction: Simply calling your card issuer and asking for a lower APR, citing your payment history and competitive offers, succeeds in a meaningful percentage of cases — especially for accounts with 12+ months of on-time payments. A 2024 LendingTree survey found that 76% of cardholders who asked for a lower APR received one.
- Hardship programs: Most major issuers have underpublicized hardship programs that temporarily reduce rates to 0–6%, waive fees, and lower minimum payments. These are not advertised. You must ask.
- Lump-sum settlement: If your account is already in collections or severely delinquent (90+ days), collectors often accept 40–60 cents on the dollar as a full settlement. This harms your credit score but stops the bleeding. For people in genuine crisis, it can be the right call.
Negotiation script: “I’ve been a customer for [X] years and always intended to pay this balance in full. I’m going through a financial hardship and would like to discuss options to reduce my interest rate temporarily. I want to avoid falling behind. What programs do you have available?”
That sentence has opened more doors than most people realize.
Strategy 7: Build an Emergency Fund in Parallel — Yes, Even Now
The counterintuitive truth about debt payoff is this: if you don’t have an emergency fund while aggressively paying down debt, a single flat tire, an unexpected medical bill, or a week of reduced income will send you right back to the credit card. The emergency fund isn’t competing with debt payoff. It’s protecting it.
You don’t need a full three-to-six-month emergency fund before attacking debt. But a $1,000–$2,500 starter emergency fund, parked in a high-yield savings account (HYSAs currently offer 4.5–5% APY from reputable institutions) provides a critical buffer against the disruptions that derail debt payoff plans.
Once that starter fund exists, pivot aggressively to debt payoff. But fund the buffer first. Think of it as buying insurance against your own future financial vulnerability — which is exactly what it is.
Strategy 8: Rewire Your Relationship with Money — The Psychology Matters More Than the Math
This is the strategy that almost no listicle takes seriously, and it’s arguably the most important one on this list.
Behavioral economics research — the kind done by Richard Thaler, the 2017 Nobel laureate who literally helped build the field — consistently shows that financial behavior is dominated not by rational calculation but by mental accounting, present bias, and identity. When you identify as “someone in debt,” you subconsciously behave in ways consistent with that identity. It’s why lottery winners go broke. It’s why people who finally pay off a credit card sometimes re-run the balance within a year.
Practical mindset interventions:
- Reframe your identity: Write down, daily if necessary, the statement: “I am becoming financially free.” Identity precedes behavior.
- Track your net worth monthly: Not just your debt total — your full net worth. Watching even small movements toward zero (from deeply negative) provides momentum. Apps like Personal Capital or a simple spreadsheet work.
- Surround yourself with people who talk about money differently: This is underappreciated. Research on social contagion in financial behavior (documented by the National Bureau of Economic Research) shows that peer financial behavior and conversation are among the strongest predictors of individual financial outcomes.
- Stop using debt to manage emotions: Retail therapy is real, documented, and destructive for anyone in a debt trap. Identify your emotional spending triggers — boredom, anxiety, reward-seeking — and build alternative responses to them. Exercise, free entertainment, social connection.
The psychological trap inside the debt trap is learned helplessness: the longer you’re in debt, the more you believe you’re the type of person who stays in debt. You’re not. You’re a person who learned some expensive habits. Habits are changeable.
Strategy 9: Seek Professional Help — Nonprofit Counseling Is Largely Free and Underused
There is no shame in calling a nonprofit credit counselor. There is, however, a meaningful difference between a nonprofit credit counseling agency and a for-profit debt settlement company — and conflating them is a costly mistake.
Nonprofit credit counseling agencies, accredited by the National Foundation for Credit Counseling (NFCC), provide free or low-cost budget counseling, creditor negotiation, and debt management plans (DMPs). A DMP typically consolidates your unsecured debts into a single monthly payment, negotiated with creditors at interest rates of 6–7% — a dramatic reduction from the 20%+ you’re likely paying now. Plans typically run four to five years and have a strong completion-rate track record.
Reputable agencies include:
- Money Management International (moneymanagement.org)
- GreenPath Financial Wellness (greenpath.com)
- InCharge Debt Solutions (incharge.org)
Avoid: For-profit debt settlement firms that charge 15–25% of enrolled debt as fees, trash your credit score for years, and sometimes fail to actually settle anything. The FTC’s guidance on debt relief companies is the clearest public resource on distinguishing legitimate help from predatory services.
Strategy 10: Advanced Tactics — Snowflaking, Asset Optimization, and the Invest-or-Pay Debate
For readers who have the basics under control and want to accelerate, here are the techniques that separate people who get out of debt in two years from those who take six.
Debt Snowflaking is the practice of directing every small windfall — a $40 birthday check, a $12 cashback reward, a $75 side hustle payment — immediately to debt payoff rather than letting it dissolve into general spending. It sounds trivial. It isn’t. A family that snowflakes consistently can add $150–$400/month to debt payoff without any change to their core budget.
The Invest-While-Paying Debate: Should you stop all investment contributions to aggressively pay down debt? The answer is nuanced and depends on interest rates.
- If your employer offers a 401(k) match, always contribute enough to capture the full match first. A 50% or 100% employer match is an immediate, guaranteed return that no debt payoff strategy can beat.
- If your debt carries rates above 7–8%, paying it down is mathematically equivalent to earning that rate tax-free. In a world where the stock market’s long-run average real return is roughly 7%, high-interest debt payoff is a better guaranteed return than any investment you can make at equivalent risk.
- Below 7% (think federal student loans or old personal loans), the calculus shifts toward split-allocation: minimum payments plus modest investing, especially in tax-advantaged accounts where the tax benefit changes the math.
Asset Optimization means honestly auditing what you own that could be liquidated, rented, or monetized. A vehicle you rarely use, equity in a home that could be refinanced to consolidate high-rate debt at mortgage rates (consult carefully, with attention to CFPB mortgage counseling resources), collectibles, musical instruments, recreational gear. None of this is sacrifice for the sake of it — it’s recognizing that liquidity can break the debt cycle faster than most behaviorally-based strategies alone.
The Challenges You’ll Face — and How to Meet Them
No strategy article is complete without honesty about the obstacles.
Setbacks will happen. You’ll have a car repair, a medical bill, a month where work slows down. Build this expectation into your plan. When a setback occurs, the goal is not to resume from where you were — it’s to resume at all. Perfection is the enemy of progress in debt payoff, as in most things.
Creditors don’t always cooperate. Some won’t reduce your rate. Some will send you through three departments before you reach someone with authority. Note the name of every representative you speak with, keep records of all communication, and follow up in writing when possible.
The social pressure to spend doesn’t pause because you’re in debt. Weddings, birthday dinners, holidays, peer group consumption patterns — all of these create continuous pressure to spend in ways that contradict your plan. Having a clear, repeatable response (“I’m on a really tight budget right now”) removes the cognitive burden of deciding in the moment.
Your Next Steps — Starting Today, Not Monday
The research on behavior change is unambiguous on one point: the optimal time to start is not the new year, not next paycheck, not next month. It’s now, with whatever partial information you have, because the momentum of beginning is itself a psychological resource.
This week:
- Write down every debt you carry — balance, APR, minimum payment.
- Calculate what you’re paying in monthly interest alone. That number is your enemy in concrete form.
- Call your highest-rate card issuer and ask for a rate reduction.
- Open a high-yield savings account if you don’t have one. Park $25 in it as a starter emergency fund.
- Download one budgeting app or open a spreadsheet and track every purchase for 14 days.
The debt trap is real. The post-pandemic hangover of high-rate borrowing, structural inflation, and stagnant wage growth has made it deeper and more treacherous than any point in the last 15 years. But the trap has exits — and every single one of them requires only that you take the first step, then the next one, then the one after that.
Compound interest is the most powerful force in finance. That is true whether it is working for you or against you. Right now, for millions of Americans, it is working against them at 21% per year. The strategies in this guide exist to flip that equation — to put time, discipline, and intelligent tactics on your side rather than your creditor’s.
You are not stuck. You are not broken. You are, at this very moment, one decision away from the beginning of something different.
Sources and Further Reading
- Federal Reserve Bank of New York — Q1 2026 Household Debt and Credit Report
- LendingTree — 2026 Credit Card Debt Statistics
- Bankrate — Credit Card Interest Rate Forecast for 2026
- The Motley Fool — Average American Household Debt 2025–2026
- Consumer Financial Protection Bureau — Debt Management Plans
- FTC — Debt Relief Services: What You Need to Know
- Federal Reserve Bank of Boston — How Interest Rate Changes Affect Credit Card Spending (2026)
- KPMG — Q4 2025 Household Debt and Credit Analysis
- USDA Economic Research Service — Food Waste Statistics
- WalletHub — Current Credit Card Interest Rates, May 2026
- National Bureau of Economic Research — Social Contagion in Financial Behavior
- FRED / St. Louis Fed — Household Debt Service Payments as % of Disposable Income
Discover more from The Economy
Subscribe to get the latest posts sent to your email.



Key Takeaways
- Rolex’s secondary market rose approximately 7.9% year-over-year as of 2026 (per WatchCharts data) — trailing Patek Philippe (+16.2%) and Tudor (+11.4%) but still outperforming Audemars Piguet (+3.4%).
- Rolex raised U.S. retail prices 4–9% in January 2026 (steel models ~5.6%, gold models ~8.7%), narrowing the historical gap between retail and pre-owned pricing.
- Not every model appreciates: steel sports references (Submariner, GMT-Master II, Daytona) have held value far better than two-tone or widely available dress references like the standard Datejust.
- The Lady-Datejust posted the sharpest 2026 gain among tracked collections — up 22.73%, from roughly $9,269 to $11,376 — driven by demand for smaller, “everyday luxury” watches.
- Gold’s rise past $2,400/oz has directly lifted the investment case for Rolex’s precious-metal references (Day-Date, Sky-Dweller, Yacht-Master).
The Model-by-Model Picture
| Category | 2026 Trend |
|---|---|
| Lady-Datejust | +22.73% (strongest performer among tracked collections) |
| Steel sports models (Submariner, GMT-Master II) | Held value well; corrected from 2022 peak but stabilized above retail |
| Daytona | Corrected from highs above $50,000 to the mid-$30,000s; still among the most sought-after references |
| Two-tone/widely available Datejust | Flat to negative — “holds value” is an overstatement for this category |
| Gold references (Day-Date, Sky-Dweller) | Lifted by gold’s rise above $2,400/oz |
Why the “Rolex Always Appreciates” Myth Is Fading
The pandemic-era boom pushed some references — the Daytona above all — to speculative highs disconnected from historical norms. Since the March 2022 peak, steel sports models have compressed meaningfully, and dealers who bought inventory near the top have in some cases faced 20–40% markdowns on liquidation. The lesson for 2026 buyers: Rolex as a category is not a monolith. Value retention depends heavily on specific reference, condition, and whether the piece comes with box and papers (“full set”).
What’s Actually Driving 2026 Strength
- Retail price increases raise the floor. When a new Submariner retails at $10,050 (up from $9,500), a pre-owned example at $11,000–$12,000 suddenly represents a smaller premium — narrowing the gap without secondary prices actually moving.
- Supply discipline remains Rolex’s core lever. The brand has never confirmed production numbers, and secondary-market premiums remain entirely a function of Rolex’s own manufacturing decisions — a risk factor as much as a support.
- Certified Pre-Owned rollout. Rolex’s now fully rolled-out CPO program has changed how buyers transact in the used market, adding a layer of brand-verified legitimacy that supports pricing.
The Case for Rolex as a Portfolio Diversifier
Financial advisors increasingly frame luxury watches not as a replacement for equities or bonds, but as a tangible, historically low-correlation diversifier — one that carries its own risks (illiquidity, condition-dependent pricing, no yield) but has demonstrated multi-decade resilience for specific references.
Is Rolex a good investment in 2026?
It depends heavily on the specific reference. Steel sports models like the Submariner and Daytona have held or grown in value; two-tone and widely available dress models generally have not. Overall, Rolex’s secondary market rose about 7.9% year-over-year in 2026, trailing Patek Philippe but ahead of Audemars Piguet.
Discover more from The Economy
Subscribe to get the latest posts sent to your email.

Navigating Mortgage and Loan Refinancing in a High-Yield Environment
Global public debt crossing critical thresholds has kept central bank policies volatile, resulting in fluctuating US Treasury yields throughout 2026. For homeowners and commercial property holders burdened by previous high-interest borrowing cycles, finding optimal refinance windows has become a high-stakes financial puzzle. Stalled disinflation and stubborn employment numbers mean rate cuts are incremental, requiring borrowers to act with precision.
Timing your mortgage or commercial loan refinance in this environment requires a deep understanding of yield curve movements and lender risk appetites.
Decoding 2026 Refinance Dynamics
The 10-Year Treasury Yield Benchmark
Mortgage rates continue to track closely with the 10-year US Treasury yield. When macroeconomic anxiety spikes debt issuance, yields rise, tightening consumer borrowing capacity. Savvy borrowers monitor weekly Treasury auctions to lock in rates during brief dip windows.
Hybrid ARMs and Alternative Structures
With fixed rates remaining elevated, 7/1 and 10/1 adjustable-rate mortgages (ARMs) have surged in popularity. These products offer lower initial monthly payments, giving borrowers breathing room until central bank easing cycles fully materialize.
| Loan Product | Current Rate Range | Best For | Key Risk Factor |
| 30-Year Fixed Mortgage | 6.2% – 6.8% | Long-term predictability | Higher initial monthly outlay |
| 7/1 Hybrid ARM | 5.5% – 5.9% | Short-term ownership / flipping | Rate reset risk after year 7 |
| Commercial Refinance | 7.0% – 8.2% | Corporate asset restructuring | Strict DSCR lender covenants |
Actionable Steps for Successful Refinancing
To maximize your chances of securing favorable refinance terms in a volatile market, follow a disciplined preparation strategy.
Boost Your Credit Score Immediately: Lenders in 2026 are applying stringent credit tiering; a 20-point increase can drop your APR by a crucial quarter-point.
Shop Regional Credit Unions: Smaller financial institutions often offer portfolio loans with more flexible underwriting than major national banks.
Calculate the Break-Even Point: Ensure your total closing costs are recouped through monthly savings within 24 months of closing.
“Market Strategist View: Refinancing in 2026 is an exercise in opportunistic timing. Borrowers must maintain immaculate financial profiles ready to strike the moment Treasury yields dip.”
Mastering the complexities of today’s debt environment ensures you can successfully lower your debt service costs and protect your long-term financial stability.
Discover more from The Economy
Subscribe to get the latest posts sent to your email.

The days of pulling generic auto insurance quotes based purely on your zip code and age are officially over. In 2026, insurance comparison engines are powered entirely by generative AI and real-time telematics. These platforms digest thousands of live data points—ranging from your driving smoothness via connected vehicle sensors to real-time traffic congestion patterns—to generate hyper-personalized premiums instantly.
For consumers, this evolution represents both a massive opportunity for savings and a hidden trap for penalty pricing. Understanding how AI algorithms evaluate risk is essential for anyone looking to lower their monthly auto insurance premiums.
How AI Comparison Engines Evaluate Your Risk Profile
Behavioral Telematics and Connected Cars
Modern cars stream performance data directly to insurance aggregators. Generative AI models analyze braking sharpness, acceleration curves, cornering G-forces, and phone distraction metrics. Drivers who maintain smooth, defensive habits are rewarded with dynamic rate cuts of up to 40% compared to traditional rating tiers.
Predictive Traffic and Weather Modeling
AI tools now cross-reference your daily commute route with predictive weather and accident probability models. If your standard parking location or driving corridor has a statistically higher incidence of uninsured motorist claims, your quotes will reflect that hyper-local risk assessment.
| Comparison Factor | Traditional Rating Model | 2026 Generative AI Model | Impact on Premium |
| Mileage & Usage | Annual estimated odometer reading | GPS tracking & live trip duration | High (up to 35% savings) |
| Driving Behavior | MVR driving record & accidents | Real-time braking, speed, & G-force | Critical (determines tier) |
| Vehicle Tech | Make, model, and safety rating | ADAS calibration & repair cost data | Moderate |
Strategies to Lower Your AI-Driven Insurance Quote
To outsmart the algorithm and secure the lowest possible premium in 2026, drivers must proactively manage their digital footprint on insurance platforms.
Opt-In for Telematics Trial Periods: Many insurers offer immediate 15% discounts just for installing their driving app; let it track safe habits for 30 days to lock in permanent savings.
Scrub Unverified Public Records: Ensure your motor vehicle report is free of clerical errors that AI risk models misinterpret as reckless behavior.
Compare AI Aggregators: Use platforms that integrate multi-carrier API feeds rather than single-brand comparison sites to find the best risk-adjusted rate.
“Industry Note: AI-driven pricing rewards transparency and precision. Drivers who actively manage their telematics data consistently out-save those relying on legacy quote calculators.”
Embracing AI comparison tools allows savvy policyholders to customize coverage limits precisely to their driving habits, eliminating wasted premium spend while ensuring robust protection.
Discover more from The Economy
Subscribe to get the latest posts sent to your email.

Bank of England Warns of AI Systemic Risk: How Autonomous Trading Threatens Financial Stability

Bank of Japan Hikes Benchmark Rate to 1.25%: Unwinding the Global Yen Carry Trade

Gold Falls 3.7% as Yields Surge: Is Gold Still a Safe Haven in 2026?

US 10-Year Yield Hits 5.24%: What the Historic Bond Market Sell off Means for Mortgages and Investors

Battle for the Farm Belt: How Tariff Pressures and Fuel Costs Are Reshaping Iowa’s 2026 Midterms

Southeast Asia’s Critical Minerals Power Play: Can ASEAN Avoid Choosing Between China and the US?

MAS Allocates S$1.45 Billion to Five Asset Managers in Third EQDP Batch: Total Deployment Reaches S$5.4 Billion

Beyond Singapore’s Borders: How Squeezed SMEs Can Unlock High-Yield Growth Across ASEAN

Bank Jago’s Wealth Management Push:Indonesia’s 31.1 Million Investors boom

Beyond the Four-Year Degree: The $100K+ Trade Careers Young Americans Are Overlooking

SpaceX Starship Achieves First Full Orbit on Historic 10-Hour Test Flight 14

Google’s $15B Finland AI Investment: Data Centers, Nuclear Power & Jobs

Fast Invoice Factoring: Rates, APR Math & Contract Traps

SOC 2 Type II Guide: Cost, Timeline & Compliance Companies

Top 30 Stocks for Investment in PSX for Massive ROI in 2026

Oil Prices Break $100 in 2026: Middle East Conflict & Energy Markets

BRICS+ Cross-Border Payments 2026: Interoperability Explained

Fidelity Investments Review 2026: SPAXX Yields & Zero-Fee Funds

10-Year Treasury Yield Hits 4.80%: What It Means for Rates & Portfolios

IMF & World Bank 2026 Global Economic Outlook: Growth, Inflation, Debt

Shein Clothes Quality & Safety in 2026: What Lab Tests Show

China’s US$10.8 Billion Trade Shortcut: Why the Pinglu Canal Matters

High-CPM Finance Niches 2026: Publisher Monetization Blueprint

Middle East War Economics 2026: Oil Prices & Energy Markets

China Stocks Today: Are Big Economies in Asia Nearing a Market Bottom?

Global Pension Systems Ranked: The World’s Best and Worst Retirement Frameworks

Social Security Trust Fund 2032: OASI Depletion Timeline Explained

Gavin Baker AI Outlook: Why the Compute Shortage Persists Through 2028
-

 Markets & Finance9 months ago
Top 15 Stocks for Investment in 2026 in PSX: Your Complete Guide to Pakistan’s Best Investment Opportunities
-

 Analysis7 months ago
Johor’s Investment Boom: The Hidden Costs Behind Malaysia’s Most Ambitious Economic Surge
-

 Analysis7 months ago
Top 10 Stocks for Investment in PSX for Quick Returns in 2026
-

 Banks9 months ago
Best Investments in Pakistan 2026: Top 10 Low-Price Shares and Long-Term Picks for the PSX
-

 Analysis8 months ago
Brazil’s Rare Earth Race: US, EU, and China Compete for Critical Minerals as Tensions Rise
-

 Investment9 months ago
Top 10 Mutual Fund Managers in Pakistan for Investment in 2026: A Comprehensive Guide for Optimal Returns
-

 Global Economy9 months ago
15 Most Lucrative Sectors for Investment in Pakistan: A 2025 Data-Driven Analysis
-

 Global Economy9 months ago
Pakistan’s Export Goldmine: 10 Game-Changing Markets Where Pakistani Businesses Are Winning Big in 2025