
Analysis
Cash is King: How Asian Airlines’ Liquidity Hoarding During the 2026 Oil Shock Will Make Them Stronger | Aviation Analysis

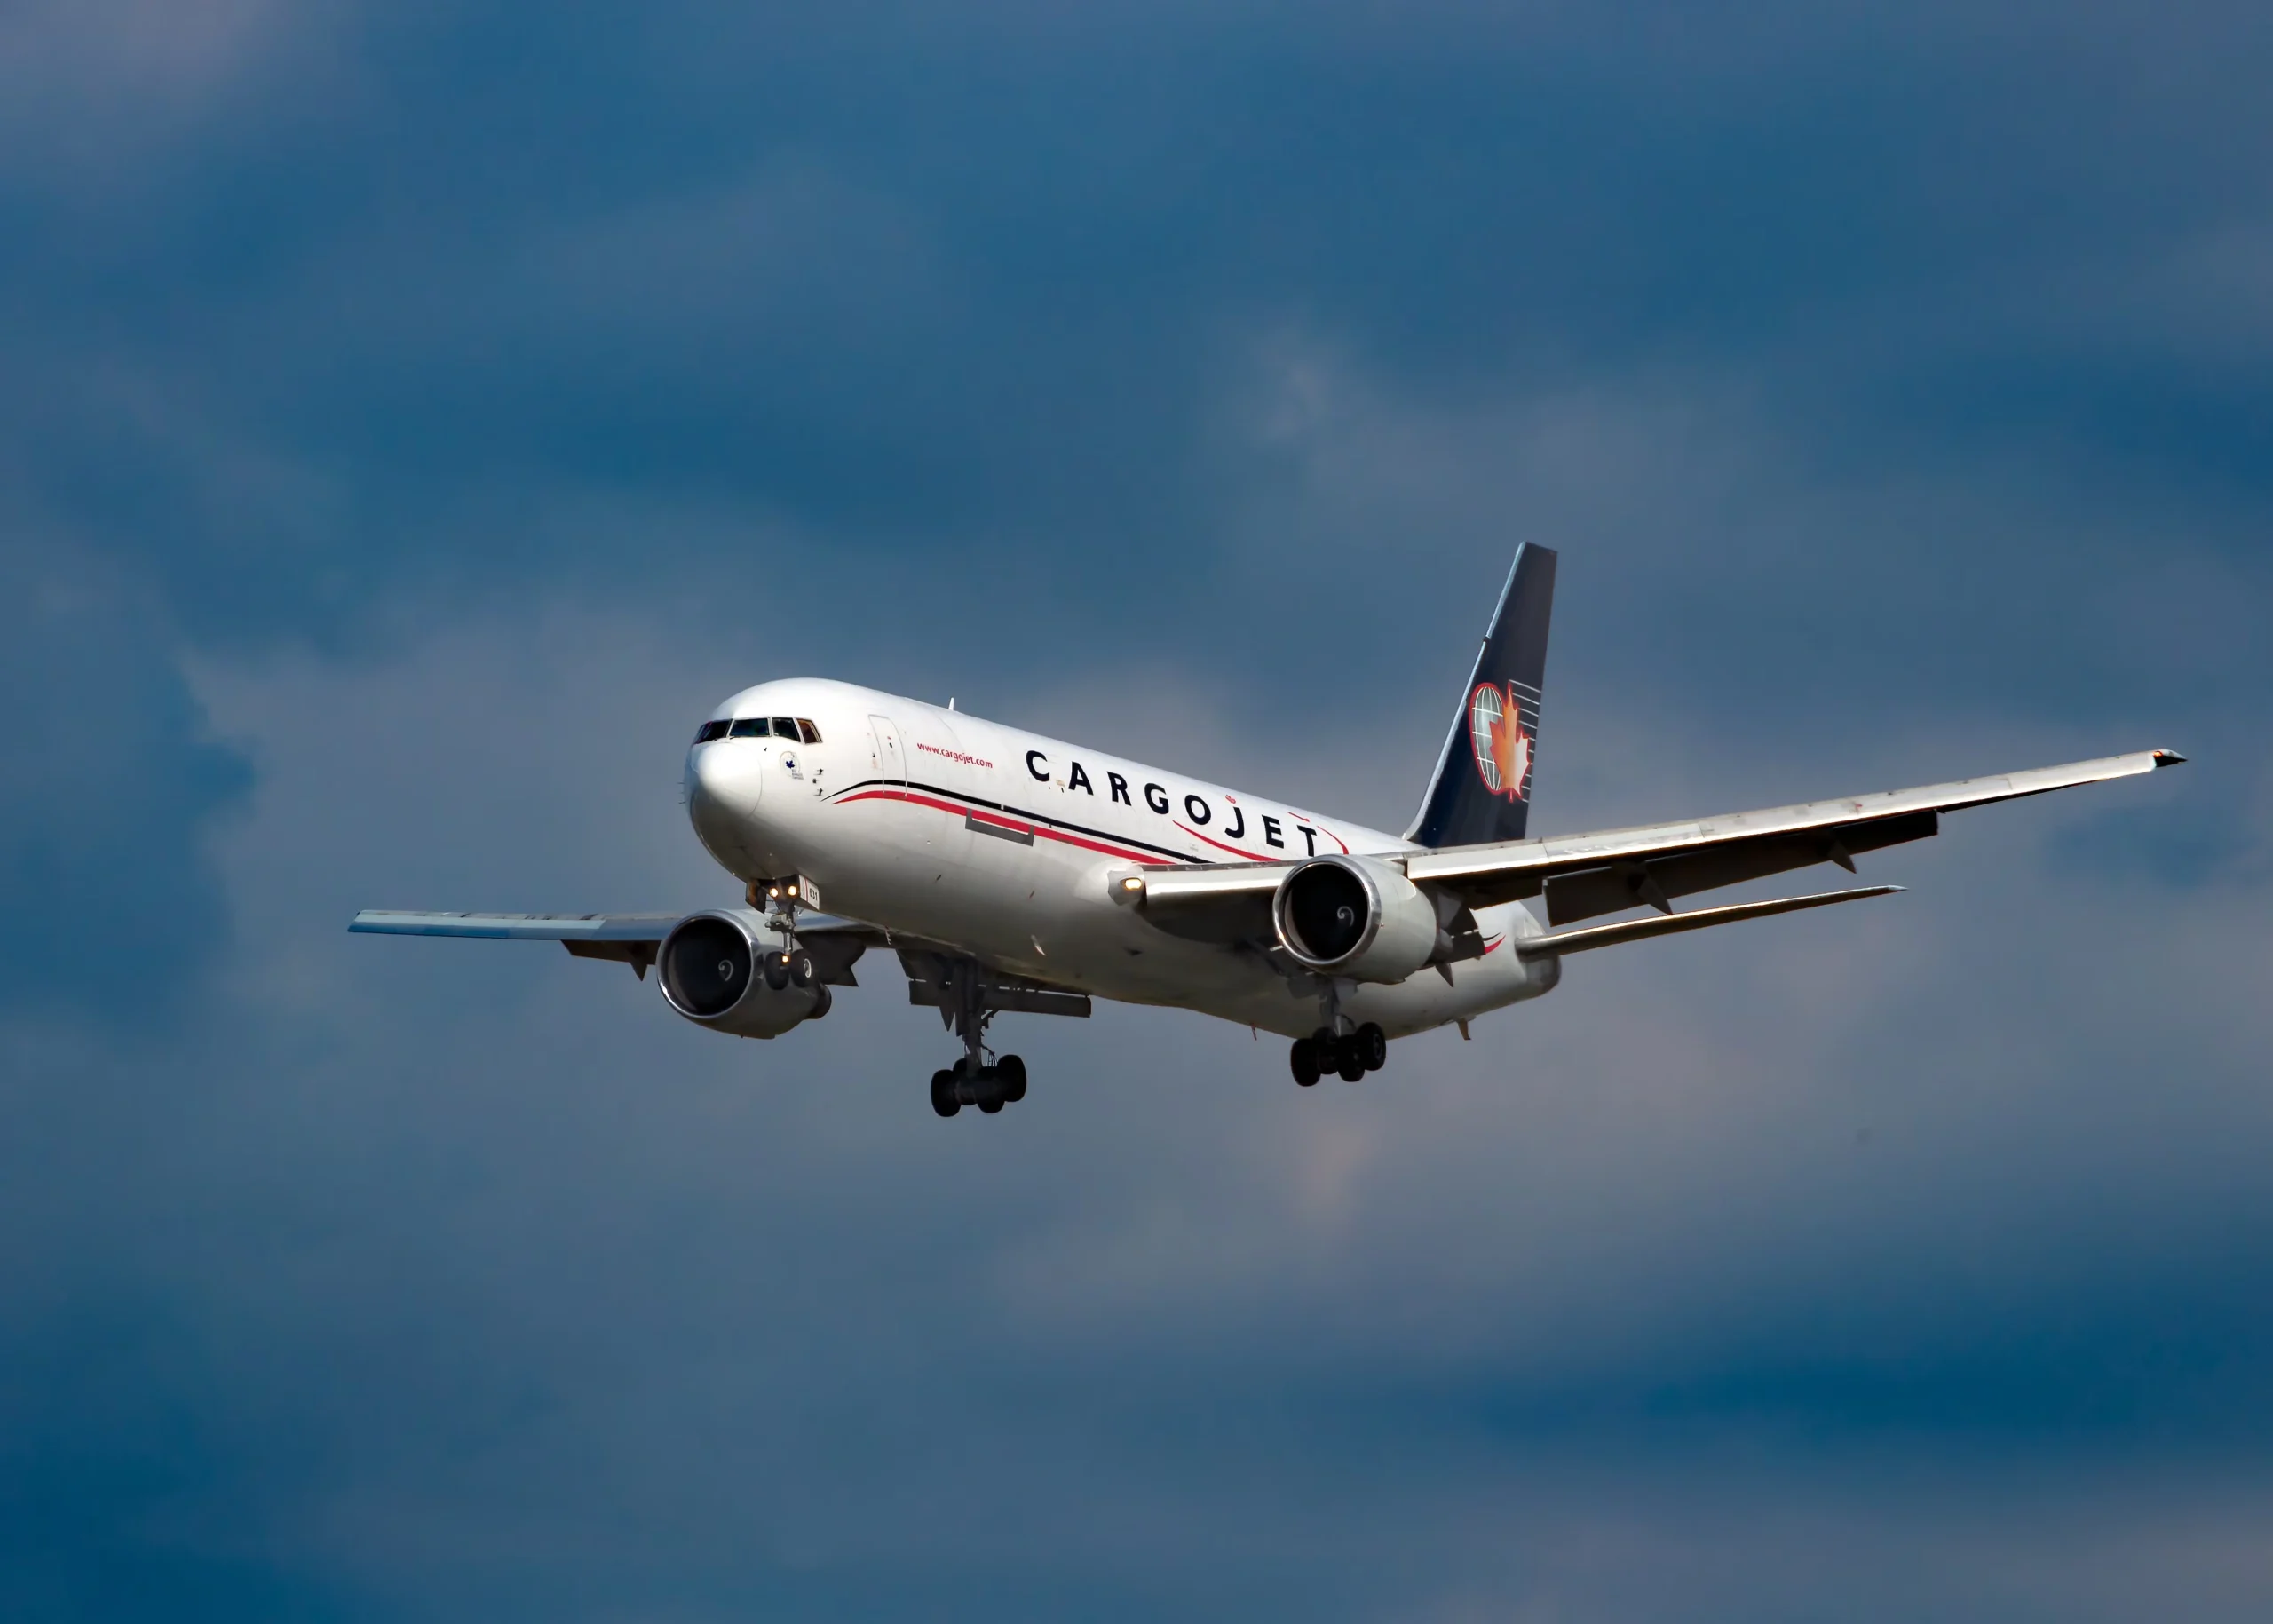
The Fuel Shock That Rewrites the Rules
There is a particular kind of clarity that arrives only in a genuine crisis. Not the manufactured urgency of quarterly earnings calls, not the performative alarm of airline investor days — but the cold, existential arithmetic of an industry staring at a cost structure that has been torn apart in a matter of weeks.
Jet fuel, the single most volatile line item on any airline’s balance sheet, has more than doubled in the month since the U.S.-Israeli war on Iran began, surpassing $195 a barrel as a global average. Foreign Policy For context: the refining spread alone — the premium of processed jet fuel over crude — surged to as high as $144 per barrel before easing to around $65, still far above anything considered normal. Modern Diplomacy Benchmark Brent crude has settled between $100 and $115. But that, as Foreign Policy noted this week, is not the number that matters. What matters is what actually goes into the wing tanks.
The closure of the Strait of Hormuz by Iran has effectively severed nearly 21% of global jet fuel supply Travel And Tour World — a chokepoint through which a significant share of Middle Eastern refined product passes on its way to Asia’s thirsty aviation hubs. The ripple effects have been immediate: Jet A-1 prices have surged from around $80 per barrel to approximately $220 per barrel Nation Thailand, compressing airline margins to the point where, for carriers flying on pre-crisis booking revenues, every departure is potentially loss-making.
And yet, if you look carefully beneath the screaming headlines, something strategically interesting is happening among Asia’s major carriers. A quiet, disciplined, and — dare I say it — admirable act of financial self-preservation is underway. Call it what it is: a masterclass in crisis liquidity management.
How the 2026 Shock Compares to the 1973 and 1980s Crises
The historical echoes are not merely rhetorical. Chai Eamsiri, the President and CEO of Thai Airways International — a man who has navigated nearly four decades of aviation cycles — did not mince words when assessing what his industry is now facing. “This is the worst one,” he told journalists. “This time is about the infrastructure that was destroyed. It will take some time to call back all the supply, the facilities, the refinery, the infrastructure.” Free Malaysia Today
He is right to reach for historical superlatives, and the comparison demands unpacking.
The 1973 OPEC embargo and the 1979–1980 second oil shock were demand-destruction events rooted in cartel politics. Airlines of that era operated with none of today’s financial sophistication — no fuel hedging programs, no dynamic pricing algorithms, no diversified revenue streams from cargo or ancillaries. Pan American World Airways, Braniff International, and Laker Airways entered those shocks with high debt, aging fleets, and zero liquidity buffers. The results were catastrophic: Braniff filed for bankruptcy in 1982; Laker collapsed the same year; Pan Am began its long death spiral.
The 2026 shock differs structurally. Most airline hedging programs are tied to crude oil benchmarks, not to the refined jet fuel that actually goes into aircraft — a critical structural weakness exposed by this crisis. Modern Diplomacy When refining margins spike as they have now, even well-hedged carriers face significant exposure. But the key difference between 2026 and 1980 is this: today’s Asian flag carriers have cash. Meaningful, fortress-grade cash — built up deliberately through post-COVID restructuring, equity raises, and restrained capital allocation. And they know exactly how to use it.
The Liquidity Fortress: Carrier-by-Carrier Case Studies
Thai Airways: The THB 120 Billion Shield
Thai Airways International has moved into cash-saving mode, with CEO Chai Eamsiri confirming the airline has begun delaying non-essential investment plans and tightening spending to preserve as much as possible of its existing THB 120 billion (approximately $3.3 billion) cash position. Nation Thailand
The discipline is surgical rather than panicked. Consider what Thai Airways is not cutting: its fleet expansion from 80 to 102 aircraft by year-end 2026, new routes including Bangkok–Amsterdam (a comeback after 28 years) and Bangkok–Auckland, and the THB 10 billion MRO centre at U-Tapao Airport — all remain on schedule. KAOHOON INTERNATIONAL What is being deferred is the discretionary: onboard equipment upgrades, non-critical vendor contracts, premature hedging at punishing spot prices. Thai Airways has already locked in approximately 50% of its fuel requirements through June 2026 but has opted not to hedge further, judging the volatility too high to add new positions at current elevated prices. KAOHOON INTERNATIONAL
This is not a sign of weakness. It is a sign of a CFO who understands that locking in $195/barrel fuel in a crisis environment is a trap, not a solution.
Singapore Airlines and Scoot: Hedging Sophistication Meets Commercial Discipline
Singapore Airlines is regarded as operating one of the more robust fuel hedging programmes in the Asia-Pacific region, providing meaningful protection against the refined jet fuel price surge. TTG Asia Scoot, its low-cost subsidiary, has deployed what its Vice President for Pricing described as a combination of fuel hedging, selective fare increases, and commercial capacity discipline Nation Thailand — a three-pronged response that reflects the parent group’s institutional risk management culture.
Critically, Singapore’s government delayed a sustainable aviation fuel levy that airlines were scheduled to start paying in May 2026, citing the surge in fuel costs from the Iran war — with the charge now deferred to October 1, 2026. Bloomberg This is sovereign-level recognition that preserving airline liquidity during the shock window is a national economic priority, not merely a commercial accommodation.
Cathay Pacific: Surcharges as a Cash Generation Engine
Cathay Pacific doubled its fuel surcharges on all tickets from March 18, 2026, with the airline stating that jet fuel has approximately doubled since the start of the Middle East crisis. LoyaltyLobby The surcharge mechanism is, in effect, a real-time cash flow transfer from demand-inelastic travellers to the carrier’s operating account — elegant, legally defensible, and brutally effective. By April 1, Cathay had raised fuel surcharges a further 34% Gulf News, a move that signals confidence in its ability to pass costs through without material load factor destruction.
AirAsia X: Managed Contraction, Not Collapse
AirAsia X has raised fares by up to 40% and imposed a 20% fuel surcharge, while cutting approximately 10% of flights — targeting non-profitable exploratory routes rather than core network services. Malay Mail Group CEO Bo Lingam has been explicit: the carrier is “optimising its fleet without resorting to staff reductions.” AirAsia X carries no fuel hedges, leaving it fully exposed to spot market prices The Edge Malaysia — a vulnerability, certainly, but one being managed through aggressive yield management rather than capacity capitulation.
The Great Hedging Divide: Asia Versus the West
Here is where the conventional narrative gets genuinely interesting. Much commentary has focused on European carriers’ superior hedging positions as evidence of Western operational sophistication. European airlines have on average hedged around 80% of their 2026 fuel requirements, with Ryanair holding the strongest position at 84% of the current quarter locked in at $77 per barrel. AeroTime
But here is the structural irony that almost every competitor publication has missed: those hedges are front-loaded and thinning. Coverage thins as the year progresses AeroTime, meaning European carriers’ apparent advantage evaporates precisely as the shock, if prolonged, bites deepest — in Q3 and Q4 2026. Lufthansa, hedged at 82% for the current quarter and 77% for the rest of 2026, has halted all new fuel hedging activities AeroTime, a tacit admission that the forward market has become too expensive and too uncertain to navigate confidently.
Meanwhile, the structural weakness that hedge programs tied to crude oil benchmarks expose means that in extreme market conditions, even well-hedged airlines remain vulnerable Modern Diplomacy to the refining spread explosion — which is precisely what has occurred. The jet fuel hedging market is thin, expensive, and insufficient for absorbing a shock of this magnitude.
The Asian carriers who are building cash buffers, cutting capacity precisely where unit economics break, and deferring discretionary capex — rather than betting on futures markets — may emerge from this crisis with balance sheets that are, paradoxically, stronger than peers who spent aggressively on hedging infrastructure.
The Macro Ripple: Asian Tourism and the Regional Economic Calculus
The aviation liquidity crisis is not occurring in a vacuum. It is unfolding against a regional tourism backdrop that was, until February 2026, one of the most compelling growth stories in global travel economics.
Thailand’s 2026 tourism season began with strong momentum, with early-year arrivals topping 7 million visitors in the first months — before geopolitical tension slowed weekly growth. Chiang Rai Times The medium-term danger is not the short-haul regional market, which tends to be resilient to fuel shocks given shorter flight times and lower absolute fuel burn per seat. It is the long-haul leisure segment — Europe to Bangkok, Australia to Bali, the transatlantic Asian diaspora flows — where reduced flight frequency and higher fares could put significant pressure on hundreds of thousands of visitor arrivals, with revenue losses estimated in the tens of billions of baht Chiang Rai Times if the crisis persists past Q2.
The carriers that preserve cash through this window are not merely surviving for their own sakes. They are the arterial infrastructure of tourism-dependent economies across Southeast Asia, South Asia, and Northeast Asia. An airline that runs out of liquidity does not merely disappear from a stock exchange — it removes a country from the global route map. The geopolitical stakes of airline liquidity management are, in this sense, considerably higher than most financial commentary acknowledges.
Five Strategic Moves That Define the 2026 Winners
The data across this crisis reveals a clear behavioral taxonomy that will separate aviation’s resilient performers from its casualties. The carriers executing all five of the following actions are, in my assessment, the ones to watch for the 2027 recovery:
1. Fortress Cash, Not Fire Sales: Preserving liquidity buffers in excess of six months of operating costs rather than deploying cash into opportunistic asset acquisitions. Thai Airways’ THB 120 billion reserve is the archetype.
2. Selective Capex Preservation: Distinguishing between strategic investments (fleet renewal, MRO infrastructure, digital systems) and discretionary spending. The carriers cutting AI investment and technology programs will pay a competitive price in 2027–28.
3. Revenue Yield Over Capacity Vanity: Accepting lower seat counts at higher yields rather than defending market share with cheap, loss-generating inventory. AirAsia X’s fare hikes of up to 40% — paired with a 10% capacity cut — reflects this discipline.
4. Hedging Agnosticism at the Peak: Refusing to layer new hedge positions at $195/barrel spot prices. As Thai Airways CFO reasoning shows, hedging during a crisis peak locks in losses rather than protecting against them.
5. Government Partnership Activation: Working with civil aviation authorities on fuel surcharge frameworks and levy deferrals — as Singapore’s CAAS demonstrated — to distribute the cost shock across the value chain rather than absorbing it entirely on the airline’s income statement.
What This Means for the 2027 Recovery
Let me be direct: the 2026 oil shock will end. Every previous shock in aviation history — 1973, 1979, 1990, 2008 — resolved, eventually, through some combination of supply restoration, demand destruction, political settlement, or technological substitution. CEO Chai Eamsiri himself noted that U.S. midterm elections in November 2026 create a political incentive structure that could influence conflict resolution timelines. Nation Thailand
CLSA’s analysis forecasts Singapore Airlines’ FY27 core net profit declining 30% year-on-year due to the jet fuel surge, but projects FY28 profits unchanged on the assumption of oil price normalization and gradual fare adjustments — with dividend yield expected to recover to 4.8% in FY28. Minichart
The carriers that will capture disproportionate market share in that normalization window are precisely those that did not panic-sell routes, did not dilute equity at distressed prices, did not gut their technology and workforce infrastructure in a short-sighted cost-cutting frenzy. The Asian airlines building liquidity fortresses today are positioning themselves to be the aggressive fleet-deployers and route-expanders of 2027 — when fuel prices ease, pent-up demand unleashes, and weakened competitors have neither the aircraft nor the operational capacity to respond.
This is the contrarian insight that most aviation commentary — fixated on the immediate pain — is missing entirely. The 1980s crisis eliminated Pan Am, Braniff, and Laker. But it also created the conditions under which a disciplined Singapore Airlines, flush with government-backed capital and operational conservatism, spent the subsequent decade cementing itself as the world’s most admired full-service carrier. History, as ever, rewards the patient.
The Verdict: Discipline as Competitive Moat
The IATA forecast of $41 billion industry profit for 2026, made at the end of 2025, now seems unattainable. The Conversation That is certain. What is less certain — and far more interesting — is which carriers emerge from this shock with durable competitive advantages rather than merely surviving it.
My assessment: Singapore Airlines and Thai Airways, both of which entered 2026 with restructured balance sheets, cash reserves, and clear strategic frameworks for navigating fuel volatility, are the strongest positioned for 2027 recovery. Cathay Pacific’s aggressive surcharge strategy preserves revenue integrity without destroying demand. AirAsia X’s managed contraction — painful but rational — keeps the network intact for the eventual bounce.
The carriers I worry about most are those without hedges, without cash buffers, and without the cost-discipline culture that turns a crisis into a competitive sorting mechanism. The airlines most likely to fail are those with weak balance sheets, low operational efficiency, no state backing, and little or no fuel hedging, leaving them fully exposed to sharp cost rises. The Conversation
Cash, as every Asian airline CFO is now demonstrating with unusual clarity, is not merely a financial metric. It is a strategic weapon. And in the worst oil shock since the 1980s, the carriers who hoarded it most ruthlessly will be the ones defining Asian aviation’s next decade.
The headlines say crisis. The balance sheets say opportunity.
Inline Citations and Sources
- Foreign Policy — “Jet Fuel Prices Spell Bad News for Iran War Energy Crisis”
- The Nation Thailand — “Thai Airways board to weigh crisis measures as oil surge hits costs”
- The Nation Thailand — “THAI enters cash-saving mode as fuel costs soar”
- Bloomberg — “Singapore Delays Flight Tax as Oil Crisis Lifts Jet Prices”
- Aerotime Hub — “Airline fuel hedging: who is protected in Iran’s fuel crisis”
- The Conversation — “Airlines are facing yet more turbulence — expert assesses what they need to get through it”
- The Edge Malaysia — “High jet fuel costs threaten airline recovery”
- Malay Mail — “AirAsia X raises fares by up to 40pc, cuts some flights”
- Minichart — “Singapore Airlines Earnings Outlook 2026–2027: Impact of Iran War”
- TTG Asia — “Asian carriers cancel flights, implement surcharges as fuel crisis intensifies”
Discover more from The Economy
Subscribe to get the latest posts sent to your email.



Key Takeaways
- Rolex’s secondary market rose approximately 7.9% year-over-year as of 2026 (per WatchCharts data) — trailing Patek Philippe (+16.2%) and Tudor (+11.4%) but still outperforming Audemars Piguet (+3.4%).
- Rolex raised U.S. retail prices 4–9% in January 2026 (steel models ~5.6%, gold models ~8.7%), narrowing the historical gap between retail and pre-owned pricing.
- Not every model appreciates: steel sports references (Submariner, GMT-Master II, Daytona) have held value far better than two-tone or widely available dress references like the standard Datejust.
- The Lady-Datejust posted the sharpest 2026 gain among tracked collections — up 22.73%, from roughly $9,269 to $11,376 — driven by demand for smaller, “everyday luxury” watches.
- Gold’s rise past $2,400/oz has directly lifted the investment case for Rolex’s precious-metal references (Day-Date, Sky-Dweller, Yacht-Master).
The Model-by-Model Picture
| Category | 2026 Trend |
|---|---|
| Lady-Datejust | +22.73% (strongest performer among tracked collections) |
| Steel sports models (Submariner, GMT-Master II) | Held value well; corrected from 2022 peak but stabilized above retail |
| Daytona | Corrected from highs above $50,000 to the mid-$30,000s; still among the most sought-after references |
| Two-tone/widely available Datejust | Flat to negative — “holds value” is an overstatement for this category |
| Gold references (Day-Date, Sky-Dweller) | Lifted by gold’s rise above $2,400/oz |
Why the “Rolex Always Appreciates” Myth Is Fading
The pandemic-era boom pushed some references — the Daytona above all — to speculative highs disconnected from historical norms. Since the March 2022 peak, steel sports models have compressed meaningfully, and dealers who bought inventory near the top have in some cases faced 20–40% markdowns on liquidation. The lesson for 2026 buyers: Rolex as a category is not a monolith. Value retention depends heavily on specific reference, condition, and whether the piece comes with box and papers (“full set”).
What’s Actually Driving 2026 Strength
- Retail price increases raise the floor. When a new Submariner retails at $10,050 (up from $9,500), a pre-owned example at $11,000–$12,000 suddenly represents a smaller premium — narrowing the gap without secondary prices actually moving.
- Supply discipline remains Rolex’s core lever. The brand has never confirmed production numbers, and secondary-market premiums remain entirely a function of Rolex’s own manufacturing decisions — a risk factor as much as a support.
- Certified Pre-Owned rollout. Rolex’s now fully rolled-out CPO program has changed how buyers transact in the used market, adding a layer of brand-verified legitimacy that supports pricing.
The Case for Rolex as a Portfolio Diversifier
Financial advisors increasingly frame luxury watches not as a replacement for equities or bonds, but as a tangible, historically low-correlation diversifier — one that carries its own risks (illiquidity, condition-dependent pricing, no yield) but has demonstrated multi-decade resilience for specific references.
Is Rolex a good investment in 2026?
It depends heavily on the specific reference. Steel sports models like the Submariner and Daytona have held or grown in value; two-tone and widely available dress models generally have not. Overall, Rolex’s secondary market rose about 7.9% year-over-year in 2026, trailing Patek Philippe but ahead of Audemars Piguet.
Discover more from The Economy
Subscribe to get the latest posts sent to your email.

Navigating Mortgage and Loan Refinancing in a High-Yield Environment
Global public debt crossing critical thresholds has kept central bank policies volatile, resulting in fluctuating US Treasury yields throughout 2026. For homeowners and commercial property holders burdened by previous high-interest borrowing cycles, finding optimal refinance windows has become a high-stakes financial puzzle. Stalled disinflation and stubborn employment numbers mean rate cuts are incremental, requiring borrowers to act with precision.
Timing your mortgage or commercial loan refinance in this environment requires a deep understanding of yield curve movements and lender risk appetites.
Decoding 2026 Refinance Dynamics
The 10-Year Treasury Yield Benchmark
Mortgage rates continue to track closely with the 10-year US Treasury yield. When macroeconomic anxiety spikes debt issuance, yields rise, tightening consumer borrowing capacity. Savvy borrowers monitor weekly Treasury auctions to lock in rates during brief dip windows.
Hybrid ARMs and Alternative Structures
With fixed rates remaining elevated, 7/1 and 10/1 adjustable-rate mortgages (ARMs) have surged in popularity. These products offer lower initial monthly payments, giving borrowers breathing room until central bank easing cycles fully materialize.
| Loan Product | Current Rate Range | Best For | Key Risk Factor |
| 30-Year Fixed Mortgage | 6.2% – 6.8% | Long-term predictability | Higher initial monthly outlay |
| 7/1 Hybrid ARM | 5.5% – 5.9% | Short-term ownership / flipping | Rate reset risk after year 7 |
| Commercial Refinance | 7.0% – 8.2% | Corporate asset restructuring | Strict DSCR lender covenants |
Actionable Steps for Successful Refinancing
To maximize your chances of securing favorable refinance terms in a volatile market, follow a disciplined preparation strategy.
Boost Your Credit Score Immediately: Lenders in 2026 are applying stringent credit tiering; a 20-point increase can drop your APR by a crucial quarter-point.
Shop Regional Credit Unions: Smaller financial institutions often offer portfolio loans with more flexible underwriting than major national banks.
Calculate the Break-Even Point: Ensure your total closing costs are recouped through monthly savings within 24 months of closing.
“Market Strategist View: Refinancing in 2026 is an exercise in opportunistic timing. Borrowers must maintain immaculate financial profiles ready to strike the moment Treasury yields dip.”
Mastering the complexities of today’s debt environment ensures you can successfully lower your debt service costs and protect your long-term financial stability.
Discover more from The Economy
Subscribe to get the latest posts sent to your email.

The days of pulling generic auto insurance quotes based purely on your zip code and age are officially over. In 2026, insurance comparison engines are powered entirely by generative AI and real-time telematics. These platforms digest thousands of live data points—ranging from your driving smoothness via connected vehicle sensors to real-time traffic congestion patterns—to generate hyper-personalized premiums instantly.
For consumers, this evolution represents both a massive opportunity for savings and a hidden trap for penalty pricing. Understanding how AI algorithms evaluate risk is essential for anyone looking to lower their monthly auto insurance premiums.
How AI Comparison Engines Evaluate Your Risk Profile
Behavioral Telematics and Connected Cars
Modern cars stream performance data directly to insurance aggregators. Generative AI models analyze braking sharpness, acceleration curves, cornering G-forces, and phone distraction metrics. Drivers who maintain smooth, defensive habits are rewarded with dynamic rate cuts of up to 40% compared to traditional rating tiers.
Predictive Traffic and Weather Modeling
AI tools now cross-reference your daily commute route with predictive weather and accident probability models. If your standard parking location or driving corridor has a statistically higher incidence of uninsured motorist claims, your quotes will reflect that hyper-local risk assessment.
| Comparison Factor | Traditional Rating Model | 2026 Generative AI Model | Impact on Premium |
| Mileage & Usage | Annual estimated odometer reading | GPS tracking & live trip duration | High (up to 35% savings) |
| Driving Behavior | MVR driving record & accidents | Real-time braking, speed, & G-force | Critical (determines tier) |
| Vehicle Tech | Make, model, and safety rating | ADAS calibration & repair cost data | Moderate |
Strategies to Lower Your AI-Driven Insurance Quote
To outsmart the algorithm and secure the lowest possible premium in 2026, drivers must proactively manage their digital footprint on insurance platforms.
Opt-In for Telematics Trial Periods: Many insurers offer immediate 15% discounts just for installing their driving app; let it track safe habits for 30 days to lock in permanent savings.
Scrub Unverified Public Records: Ensure your motor vehicle report is free of clerical errors that AI risk models misinterpret as reckless behavior.
Compare AI Aggregators: Use platforms that integrate multi-carrier API feeds rather than single-brand comparison sites to find the best risk-adjusted rate.
“Industry Note: AI-driven pricing rewards transparency and precision. Drivers who actively manage their telematics data consistently out-save those relying on legacy quote calculators.”
Embracing AI comparison tools allows savvy policyholders to customize coverage limits precisely to their driving habits, eliminating wasted premium spend while ensuring robust protection.
Discover more from The Economy
Subscribe to get the latest posts sent to your email.

Oil and Diesel Prices in October 2026: How Supply Shocks Can Reach Inflation

AI Chip Demand in 2026: What TSMC, Nvidia and Data-Center Spending Reveal

Q3 2026 Earnings Season: The Bank, AI and Consumer Signals That Really Matter

Treasury Yields in 2026: Why Higher Bond Rates Matter for Stocks, Mortgages and Savings

KOSPI 2026: Why South Korean Stocks Turned Volatile and What AI Investors Should Watch

IREN Stock in 2026: AI Cloud Growth, Bitcoin Transition and the Risks Investors Miss

Stock Market Crash in 2026? Warning Signs, Scenarios and a Calm Investor Checklist

Peso Mexicano vs Dólar Estadounidense: A Practical USD/MXN Guide for October 2026

Is the Stock Market Open on Columbus Day 2026? NYSE, Nasdaq and Bonds Explained

Concert Ticket Prices in 2026: Dynamic Pricing, Fees and How to Buy Safely

High-Yield Savings Accounts in 2026: How to Compare APY Without Chasing a Headline

EU-China Trade Deal 2026: How Beijing and Brussels Avoided a Trade War—and Who Wins

Social Security 2027 COLA Announcement: Date, Formula and What Retirees Should Check

China’s AI Microdrama Boom: How Beijing Is Reshaping Global Media

China Stocks Today: Are Big Economies in Asia Nearing a Market Bottom?

World’s Largest Economies: Ranking the Top Global Powers

Global Pension Systems Ranked: The World’s Best and Worst Retirement Frameworks

Elon Musk’s Next Moves: Disrupting the 2026 Global Economy

Pakistan Economy 2026: Inside the SBP’s Balancing Act

Crude Oil & Petroleum Market Analysis: OPEC+ Decisions and Price Forecasts

GasBuddy Market Insights: How Crude Price Shifts Impact Local Fuel Cost Averages

Global Equity Market Divergence: US Tech vs. European Dividend Stocks vs. Asian Growth

IMF & World Bank Global Economic Outlook: Growth Forecasts Across Europe and Asia

Silver Price Today: Why the Xi-Trump AI Standoff Is Fueling a Safe-Haven Rally

Bitcoin Price Forecast 2026–2027: Will the 4-Year Cycle Hold?

The Future of Silicon: Supply Chain Vulnerabilities in the 2026 Tech Sector

Asian Stock Markets 2026: Japan, China, Pakistan & More

SpaceX IPO: How Aerospace Is Reshaping Tech Startup News
-

 Markets & Finance9 months ago
Top 15 Stocks for Investment in 2026 in PSX: Your Complete Guide to Pakistan’s Best Investment Opportunities
-

 Analysis8 months ago
Johor’s Investment Boom: The Hidden Costs Behind Malaysia’s Most Ambitious Economic Surge
-

 Analysis8 months ago
Top 10 Stocks for Investment in PSX for Quick Returns in 2026
-

 Banks9 months ago
Best Investments in Pakistan 2026: Top 10 Low-Price Shares and Long-Term Picks for the PSX
-

 Analysis8 months ago
Brazil’s Rare Earth Race: US, EU, and China Compete for Critical Minerals as Tensions Rise
-

 Investment9 months ago
Top 10 Mutual Fund Managers in Pakistan for Investment in 2026: A Comprehensive Guide for Optimal Returns
-

 Global Economy10 months ago
15 Most Lucrative Sectors for Investment in Pakistan: A 2025 Data-Driven Analysis
-

 Global Economy10 months ago
Pakistan’s Export Goldmine: 10 Game-Changing Markets Where Pakistani Businesses Are Winning Big in 2025