
Economic Reforms
Canada’s Two-Track Economic Play: New Bridge, Tighter Russia Sanctions

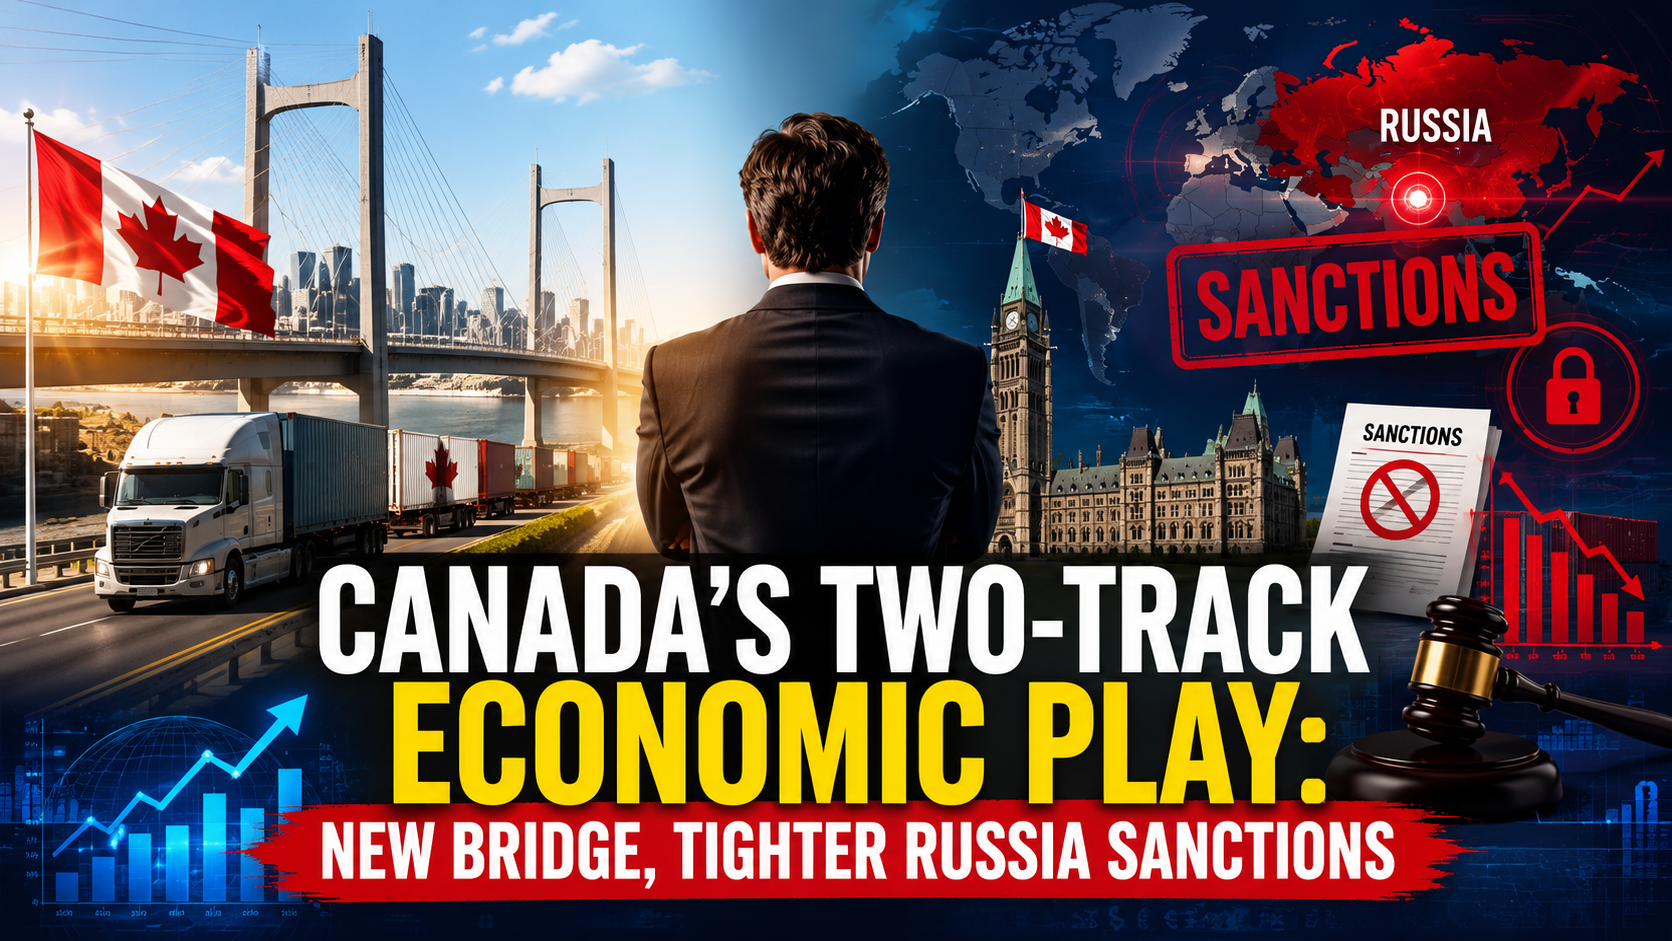
Two Canadian economic stories broke in the same week in July 2026, and neither has been connected to the other in mainstream coverage — even though together they say something coherent about how Ottawa is repositioning its trade and financial-security posture. The first: Canada confirmed the Gordie Howe International Bridge, connecting Ontario to Michigan, will open on July 27. The second: Canada has continued tightening sanctions on Russia’s shadow fleet of oil tankers, adding well over 200 vessels to its sanctions schedule across a series of amendments through the first half of 2026.
Why the Bridge Matters More Than a Ribbon-Cutting
The Detroit–Windsor corridor is the busiest commercial land border crossing between Canada and the United States, carrying a large share of the roughly $2.7 billion in daily two-way trade between the two economies. A dedicated, purpose-built crossing — rather than the aging Ambassador Bridge — is a capacity and resilience investment that reduces single-point-of-failure risk for auto-sector and manufacturing supply chains that depend on just-in-time cross-border shipments. Coming online in the same year that global trade has been repeatedly disrupted by conflict-driven shipping constraints in the Strait of Hormuz, the timing reinforces a broader theme: national governments are quietly investing in trade-corridor redundancy as geopolitical risk becomes a permanent planning input rather than a one-off shock.
The Sanctions Escalation: A Quiet But Sustained Campaign
Less visible to the public, but arguably more consequential for global energy markets, has been Canada’s steady expansion of sanctions targeting Russia’s “shadow fleet” — tankers used to move sanctioned Russian crude while evading Western oil-price caps. Through 2026, Canada has repeatedly amended its Special Economic Measures (Russia) Regulations: in March, adding 100 vessels to Schedule 1.1 and lowering the oil price cap on Russian crude from $47.60 to $44.10 per barrel; in June, adding a further 121 vessels along with new designations targeting Russia’s energy, nuclear-services, and financial sectors, including cryptocurrency enablers.
This matters for global energy pricing because the shadow fleet is the primary mechanism keeping Russian oil flowing to buyers in Asia despite the G7 price cap. Each new tranche of vessel sanctions raises the operating cost and legal risk for that fleet, which — combined with parallel EU and UK measures — has already forced roughly 125 million barrels of unsold Russian crude to accumulate on tankers at sea, pushing very large crude carrier charter rates to as high as $125,000 a day.
The Connective Thread: Trade Security as Economic Policy
What links a new bridge in Windsor to a sanctions list in Ottawa is a single strategic instinct: reducing exposure to concentrated, single-point risk in trade and energy flows. On one side, Canada is building physical redundancy into its most important trade relationship. On the other, it is participating in a coordinated effort to raise the cost of a rival state’s ability to monetise sanctioned energy exports — protecting the integrity of the price-cap regime that indirectly supports price stability for Canadian and allied energy exporters.
For businesses trading across the Canada–US border, or energy traders monitoring the knock-on effects of shadow-fleet sanctions on global crude flows, both stories point the same direction: infrastructure and financial-security policy are converging around resilience, not just growth. That has practical implications for freight routing, tanker-charter cost planning, and diversification decisions well beyond Canada’s own borders — including for oil-importing economies in Asia and South Asia watching how tightly the price-cap regime is enforced.
What to Watch
The bridge’s July 27 opening will be an early test of whether the new crossing meaningfully reduces congestion-driven delays for auto-parts and cross-border manufacturing shipments. On sanctions, the metric to track is Urals crude’s discount to Brent — which widened to roughly $25 per barrel as buyers priced in shadow-fleet risk — as an indicator of whether Canada’s latest vessel designations, combined with EU and US measures, are actually compressing Russia’s energy revenue further.
Discover more from The Economy
Subscribe to get the latest posts sent to your email.


The global economic outlook in 2026 is best understood as a contest between forces that support production and forces that squeeze purchasing power. Investment can remain strong while families struggle with essential bills. Employment can look resilient while finding a better-paid job becomes harder. A growing economy does not automatically produce a comfortable household budget.
The International Monetary Fund’s July 2026 outlook summary describes uneven growth shaped by war-related headwinds and a technology investment upswing. More recently, Reuters reported UNCTAD’s forecast of 2.6% global growth in 2026, down from 2.9% in 2025. Those are forecasts from different institutions and publication dates, not interchangeable measurements.
The useful question is therefore broader than whether the world avoids recession. It is whether growth becomes more widely shared, financing becomes more affordable, and price pressures ease without a substantial loss of jobs.
Why global growth forecasts can disagree
Economic forecasts differ because their assumptions, information cutoffs and aggregation methods differ. One institution may place more weight on purchasing-power comparisons between countries, while another uses market exchange rates. A forecast incorporating a recent energy disruption can also look materially weaker than one completed months earlier.
Readers should compare the institution, publication date, forecast period and methodology before interpreting two numbers as a disagreement about the same thing. A revision is often evidence that circumstances changed, rather than proof that forecasting has no value.
The IMF’s October 2026 World Economic Outlook page was marked as forthcoming for 13 October when this article was researched. Its final forecasts should not be presented as already released on 10 October. Until publication, earlier estimates need their original dates attached.
The first pressure point: energy
Energy affects far more than petrol stations. Fuel prices influence freight, farming, aviation and industrial production. Electricity costs influence everything from supermarkets to data centres. Businesses may absorb some increases through lower margins, but persistent cost pressure can eventually reach customers.
The US Energy Information Administration’s October Short-Term Energy Outlook forecasts an average Brent price of $105 per barrel in the fourth quarter of 2026. That is a forecast average, not a live oil quotation. The agency links its outlook to constrained Middle Eastern flows and continuing uncertainty over physical supply.
The economic effect depends on duration. A brief spike can disrupt cash flow without changing long-term investment. A sustained increase can alter household spending, government subsidy costs and the economics of entire industries. Energy-importing countries face a different balance of risks from major exporters.
Inflation is a rate, while affordability is a level
A frequent source of confusion is the difference between slower inflation and lower prices. If a shopping basket rises from 100 to 110 and then to 113, inflation has slowed sharply in the second period. The basket nevertheless costs more than before.
That arithmetic helps explain why positive inflation headlines do not always improve public sentiment. Families compare current bills with remembered prices and their own incomes. They do not experience a national average directly. Renters, commuters, pensioners and parents can face very different spending pressures.
Wage growth matters, but its timing matters too. A pay increase received after several years of rising expenses may repair only part of the damage. Households can also carry debt accumulated during the squeeze. An improvement in monthly income therefore does not immediately restore savings or financial confidence.
Interest rates transmit the pressure unevenly
Central banks face a difficult distinction between temporary price shocks and inflation that spreads through the economy. Higher borrowing costs cannot create oil or repair a shipping route. They can, however, restrain demand and influence inflation expectations.
The consequences depend on how debt is structured. A household with a long-term fixed mortgage is less immediately exposed than one refinancing this year. A business with substantial cash reserves can react differently from a company dependent on short-term borrowing.
This creates a delayed adjustment. Some borrowers feel higher rates quickly; others only encounter them when existing contracts expire. Economic activity may therefore appear resilient before refinancing pressure becomes visible. For readers assessing the outlook, debt maturity schedules can be as revealing as headline policy-rate announcements.
AI investment supports demand before its full payoff arrives
Technology spending can lift economic activity through construction, equipment purchases, software development and specialist employment. Those effects occur before businesses demonstrate sustained productivity gains from the technology itself.
This distinction is especially relevant to artificial intelligence. Building computing infrastructure is an investment cycle. Producing more useful output with the same resources is a productivity improvement. The two can reinforce each other, but they are not identical.
McKinsey’s 2026 AI survey illustrates the gap: 80% of respondents reported better individual productivity, while 37% attributed some enterprise-level earnings impact to AI. These are survey responses, not a national productivity measurement. They support a cautious interpretation: adoption can advance faster than measurable financial returns.
Public debt changes the policy room available
When borrowing costs rise, governments with substantial refinancing needs face more difficult choices. Additional interest expenditure can compete with transport, education, health and other public services. Raising taxes or reducing spending may improve fiscal arithmetic while weakening demand in the short term.
Debt sustainability cannot be judged by one ratio alone. The currency of borrowing, maturity profile, investor base, growth prospects and institutional credibility all matter. A government borrowing mainly in its own currency has different vulnerabilities from one heavily dependent on foreign-currency debt.
For emerging markets, exchange-rate depreciation can magnify external repayment costs. It can also make imported fuel and machinery more expensive. The combination of energy exposure and foreign-currency financing deserves particular attention because two external pressures can arrive together rather than independently.
Three scenarios to watch
The following scenarios are analytical illustrations, not numerical forecasts. Their purpose is to connect observable developments with possible consequences.
In an improving scenario, energy supply becomes more reliable, price pressures moderate and business investment broadens beyond a narrow technology cluster. Household purchasing power recovers gradually, allowing consumption to strengthen without a renewed inflation surge.
In a prolonged squeeze, growth continues but essential costs remain elevated. Companies protect margins through restrained hiring and selective price increases. Consumers reduce discretionary spending, producing a divided economy in which strong sectors coexist with financially stretched households.
In a downside scenario, supply disruption combines with tightening financial conditions. Investment plans are postponed, credit losses rise and weaker demand spreads across borders. The important warning would be deterioration across several indicators, rather than a single alarming market session.
What households and businesses can monitor
Households gain more from tracking their own spending basket than from reacting to every national headline. Compare essential bills with take-home income, identify debts approaching a reset, and separate recurring expenses from unusual purchases. These observations make the economic outlook relevant to actual decisions.
Businesses can track order volumes, payment delays, customer cancellations and input costs alongside revenue. Nominal sales growth may simply reflect higher prices. A company that sells fewer units at higher prices is in a different position from one gaining customers and expanding output.
For both groups, the most useful signals are persistent changes. Several months of improving real income, healthier order books or easier financing are more informative than one strong report. Revisions should also be watched: an initially positive estimate can change as better information becomes available.
How to read the next major release
When a new forecast arrives, start with what changed. Was growth revised because demand strengthened, energy assumptions shifted or historical data were updated? Then examine the distribution across countries and the balance of risks. A stable global average can conceal substantial regional deterioration.
Check whether the report describes its central scenario as conditional on events that remain unresolved. Assumptions about trade, conflict and financing are part of the forecast, not background decoration. If those assumptions fail, the headline number may lose relevance quickly.
The strongest reading of the 2026 outlook is neither automatic optimism nor permanent crisis. Growth, affordability and financial resilience are separate tests. A durable improvement requires progress on all three, and readers should judge future releases by whether they show that progress reaching beyond aggregate statistics.
Discover more from The Economy
Subscribe to get the latest posts sent to your email.
Industory
Beyond Hanoi & HCMC: How Northern Industrial Clusters Are Driving Vietnam’s 10% Growth Surge
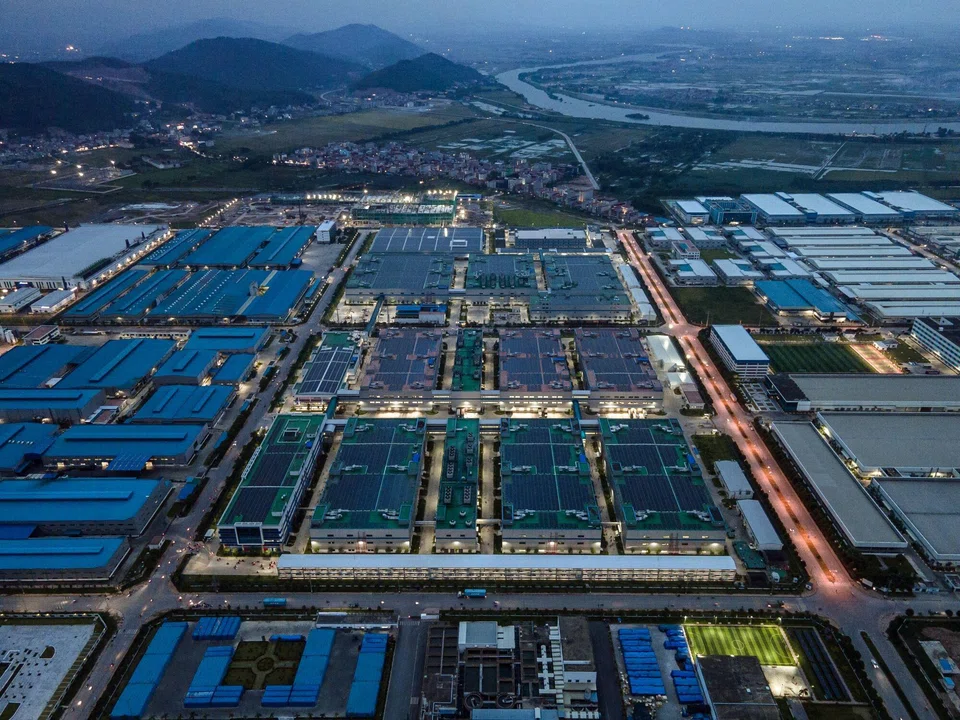
Vietnam’s economy is undergoing a structural transformation. While Tier-1 metropolitan hubs like Hanoi and Ho Chi Minh City maintain steady growth, a cluster of high-tech northern industrial provinces is driving the national economy toward a 10% annual GDP target.
According to official economic data tracked by the General Statistics Office of Vietnam, national real GDP expanded by 9.95% YoY in Q3, pushing cumulative nine-month growth to 9.01%. This momentum is fueled by a global electronics capital expenditure cycle, rising tech trade surpluses, and record-setting foreign direct investment (FDI).
1. The Northern Growth Phenomenon: Regional Divergence
Out of Vietnam’s 34 provinces and municipality-level cities, 12 recorded double-digit Gross Regional Domestic Product (GRDP) growth over the first nine months of the year—seven of which are located in Northern Vietnam.
While Hanoi (+8.85% GRDP) and Ho Chi Minh City (+9.06% GRDP) were weighed down by service-heavy transitions and real estate recalibrations, northern manufacturing hubs surged ahead:
- Quảng Ninh: 12.88% GRDP growth, driven by renewable energy manufacturing, industrial park expansion, and deep-water port logistics.
- Hải Phòng: >12.00% GRDP growth, supported by $3.1 billion in incoming FDI and industrial output expansion of 15.5% YoY.
- Bắc Ninh & Thái Nguyên: Benefited from high-capacity consumer electronics, semiconductor packaging, and mobile device manufacturing cycles.
Data compiled by the World Bank and the Asian Development Bank underscores that northern provinces are benefiting from their structural alignment with global technology capex.
| Region / Economic Hub | Q1–Q3 GRDP Growth Rate | Primary Industrial Drivers | Major Global Investors |
| Quảng Ninh | 12.88% | Port Logistics, High-Tech Manufacturing, Green Energy | Jinko Solar, Foxconn |
| Hải Phòng | >12.00% | Automotive, Electronics, Seaport & Logistics | LG Group, VinFast, Pegatron |
| Bắc Ninh | >11.50% | Consumer Electronics, Semiconductor Assembly | Samsung Electronics, Amkor Technology |
| Thái Nguyên | >10.80% | Mobile Hardware & Electronic Components | Samsung, Hansol Electronics |
| Hanoi (Tier-1 City) | 8.85% | Finance, Services, Software, Retail | Canon, Honda, Domestic Services |
| Ho Chi Minh City (Tier-1) | 9.06% | Financial Services, Commerce, Light Industry | Intel, Nidec, Logistics |
2. Structural Catalysts: Why Northern Vietnam Leads Tech Manufacturing
A. Seamless Cross-Border Logistics with Southern China
Northern industrial corridors (Hanoi–Hải Phòng–Quảng Ninh) share direct highway links to the border gates of Lạng Sơn and Móng Cái. This direct connection to China’s industrial powerhouse in Shenzhen and the Pearl River Delta enables same-day transport of critical raw components, silicon wafers, and sub-assemblies, a logistical advantage that southern or central provinces cannot replicate.
B. Multi-Modal Transport & Free Trade Zones
Hải Phòng stands out as the only northern locality offering direct access across all five primary transport modes: sea, road, rail, inland waterways, and air. The development of the Hải Phòng Free Trade Zone and the expansion of the Lạch Huyện Deep-Water Seaport allow mother vessels to bypass feeder ports and sail directly to North American and European markets, drastically lowering freight costs and transit times.
C. The Tech FDI Wave: Electronics & Semiconductors
According to global FDI metrics published by Investment Monitor, approved foreign direct investment into Vietnam surged 76.4% YoY to surpass $50.3 billion, with disbursed FDI reaching $21 billion.
The surge in trade performance is highlighted by specific high-tech export categories:
- Computers, Electronics & Components: Surged 59.6% YoY to $123.7 billion.
- Phones, Smart Devices & Components: Rose 18.8% YoY to $51.8 billion.
Together, these two categories generated approximately 40% of total national exports and nearly two-thirds of the total year-on-year increase in merchandise trade.
3. Key Operational Challenges & Strategic Outlook
Despite high growth rates, northern industrial hubs face structural bottlenecks that require ongoing management:
- Power Grid Resilience & Clean Energy Transitions: High-density semiconductor packaging and electronics assembly require uninterrupted, clean power. Ongoing investments in high-voltage transmission lines connecting central energy projects to northern industrial parks are critical to prevent seasonal grid strain.
- Skilled Engineering Talent Shortages: The rapid shift from manual assembly to advanced testing, packaging, and high-precision component production requires rapid upskilling of local engineers and technicians.
- Supply Chain Deepening: To maximize local value addition, Vietnam’s industrial policy focuses on nurturing local Tier-2 and Tier-3 suppliers to integrate into global supply chains dominated by foreign OEMs.
Market consensus data aggregated by Trading Economics and institutional research confirms that as global technology manufacturers continue diversifying under China+1 strategies, Northern Vietnam’s industrial cluster remains a primary beneficiary of foreign direct investment in Southeast Asia.
Discover more from The Economy
Subscribe to get the latest posts sent to your email.
Bitcoin’s four-year cycle has been one of the most-watched patterns in crypto. It links price peaks and crashes to the supply event known as the halving.
So far, 2026 has looked a lot like the pattern. Here is where the price stands, what the cycle predicts and what analysts expect.
Key Takeaways
- Where we are: Bitcoin traded near $77,566 on September 16, 2026. CoinDCX
- The peak: Bitcoin peaked at $126,000 in October 2025 and had fallen roughly 50% by August. Mudrex
- Cycle theory: If history repeats, a bottom would land in late 2026.
- Analysts have cut targets: Major banks have lowered their 2026 forecasts.
- Key level: The 200-day moving average is the line technical traders are watching.
What Is the Bitcoin Four-Year Cycle?
Bitcoin’s supply issuance halves about every four years. Historically, price peaks followed each halving by roughly a year, then a deep drawdown followed.
Past cycles support this. The 2017 rally and the 2021 high both followed halvings. Each peak was followed by a long decline.
Bitcoin’s decline this cycle, about 54%, is milder than the 75% to 90% peak-to-trough crashes of 2014, 2018 and 2022. Some analysts read that as evidence of a maturing asset. CoinGecko
Bitcoin Price Today and Key Levels
| Level | Meaning |
|---|---|
| $126,000 | October 2025 all-time high |
| About $64,000 | Early August 2026 trading level |
| $73,077 | 200-day EMA, a key pivot |
| $80,000–$82,000 | Resistance zone traders watch |
The 50-day average recently crossed above the 200-day, a “golden cross” for the first time this year. Technical signals are mixed, and such patterns often fail. Treat them as one input, not a prediction. CoinDCX
One analysis says a sustained break below the 200-day EMA at $73,077 would invalidate the recent breakout. CoinDCX
Bitcoin Price Forecast for 2026: What Analysts Say
Forecasts have moved lower this year. Citi cut its target twice, from $143,000 to $82,000, and Standard Chartered cut from $150,000 to $100,000. Bernstein cut once, from $200,000 to $150,000. CoinGecko
If the four-year pattern holds, a market bottom could arrive between October and December 2026, with a possible range of $50,000 to $55,000. That range lines up with the 200-week moving average. Mudrex
Prices have already moved above that level, so the cycle bottom may have come earlier and higher than the pattern suggested. Nobody knows.
Prediction markets turned bearish in July, putting under 20% odds on $90,000 by year-end. Sentiment has improved since, but expectations remain cautious. CoinGecko
Bitcoin Price Forecast 2027
Long-range forecasts are speculative. Scenarios help frame the range.
| Scenario | Rough Outcome | What Would Need to Happen |
|---|---|---|
| Cycle holds | Slow recovery in 2027 | Bottom confirmed, gradual accumulation |
| Cycle breaks bullish | New highs sooner | Strong institutional inflows |
| Deeper bear | Retest of lower support | Macro shock or weak demand |
These are frameworks, not predictions. Anyone quoting a precise 2027 price is guessing.
What Could Break the Cycle
The cycle is a pattern, not a law. Four forces could change it.
- ETFs and institutions. Large regulated funds bring different buyers than earlier cycles.
- Interest rates. Central bank policy affects appetite for risk assets.
- Regulation. Clearer rules could attract capital, and tighter ones could deter it.
- Macro shocks. Energy prices and geopolitical events can hit all risk assets.
How Investors Can Approach the Market
- Use dollar-cost averaging. Spreading purchases reduces timing risk.
- Size positions carefully. Only invest money you can afford to see drop 50% or more.
- Know your holding route. Direct coins and spot ETFs carry different costs and risks.
- Watch the 200-day level and macro news.
- Keep records for taxes.
This article is general information, not financial advice.
What This Means for the Global Market in 2027
Most forecasts fixate on a single price. Here is what matters more.
Liquidity decides the next leg. Bitcoin has tracked global liquidity and risk appetite. Watch central bank policy.
Institutional adoption is the wild card. If ETFs and brokerages keep bringing in long-term holders, volatility may narrow.
The next halving is in 2028. Some analysts already anchor forecasts to it. The cycle may shift in timing if it continues at all.
Correlation with tech stocks. Bitcoin’s moves have followed large AI-linked stocks at times, so the two markets can turn together.
Frequently Asked Questions
What is the Bitcoin price prediction for 2026?
Forecasts vary widely, and major banks have cut their targets. Prices traded near $77,000 in mid-September.
Will Bitcoin hit a new high in 2027?
Nobody can say. If the four-year cycle holds, a new high is more likely later than in 2027.
Is the Bitcoin four-year cycle still valid?
It has matched 2026 so far, with a drop from an October 2025 peak. The decline has been milder than in past cycles.
When will Bitcoin bottom?
The cycle suggests late 2026, but bottoms are only clear in hindsight. Watch the 200-day and 200-week averages.
Discover more from The Economy
Subscribe to get the latest posts sent to your email.

Stock Market Crash in 2026? Warning Signs, Scenarios and a Calm Investor Checklist

Peso Mexicano vs Dólar Estadounidense: A Practical USD/MXN Guide for October 2026

Is the Stock Market Open on Columbus Day 2026? NYSE, Nasdaq and Bonds Explained

Concert Ticket Prices in 2026: Dynamic Pricing, Fees and How to Buy Safely

High-Yield Savings Accounts in 2026: How to Compare APY Without Chasing a Headline

EU-China Trade Deal 2026: How Beijing and Brussels Avoided a Trade War—and Who Wins

Social Security 2027 COLA Announcement: Date, Formula and What Retirees Should Check

China’s AI Microdrama Boom: How Beijing Is Reshaping Global Media

Q3 2026 Earnings Preview: Can Record Profit Expectations Keep Wall Street’s Rally Alive?

Russia Diesel Deal 2026: Oil Prices and Inflation Risks

Fed Rates 2026: Treasury Yields, Bonds and SGOV Explained

S&P 500 Market Breadth 2026: Weak Rally or Rotation?

The AI Capex Boom: Data Centers Reshaping Growth

Palantir Stock in 2026: Extraordinary AI Growth

PSX Forecast 2026: KSE-100, IMF Reviews & Geopolitics

Middle East War Economics 2026: Oil Prices & Energy Markets

China Stocks Today: Are Big Economies in Asia Nearing a Market Bottom?

Crypto Daily Outlook: Bitcoin, Altcoins, and the Future of Decentralized Finance

Global Pension Systems Ranked: The World’s Best and Worst Retirement Frameworks

World’s Largest Economies: Ranking the Top Global Powers

Elon Musk’s Next Moves: Disrupting the 2026 Global Economy

Pakistan Economy 2026: Inside the SBP’s Balancing Act

GasBuddy Market Insights: How Crude Price Shifts Impact Local Fuel Cost Averages

World Bank & IMF Reports 2026: Why the “3% Growth” Consensus Is Actually a Debate

Global Equity Market Divergence: US Tech vs. European Dividend Stocks vs. Asian Growth

Crude Oil & Petroleum Market Analysis: OPEC+ Decisions and Price Forecasts

IMF & World Bank Global Economic Outlook: Growth Forecasts Across Europe and Asia

Silver Price Today: Why the Xi-Trump AI Standoff Is Fueling a Safe-Haven Rally
-

 Markets & Finance9 months ago
Top 15 Stocks for Investment in 2026 in PSX: Your Complete Guide to Pakistan’s Best Investment Opportunities
-

 Analysis8 months ago
Johor’s Investment Boom: The Hidden Costs Behind Malaysia’s Most Ambitious Economic Surge
-

 Analysis8 months ago
Top 10 Stocks for Investment in PSX for Quick Returns in 2026
-

 Banks9 months ago
Best Investments in Pakistan 2026: Top 10 Low-Price Shares and Long-Term Picks for the PSX
-

 Analysis8 months ago
Brazil’s Rare Earth Race: US, EU, and China Compete for Critical Minerals as Tensions Rise
-

 Investment9 months ago
Top 10 Mutual Fund Managers in Pakistan for Investment in 2026: A Comprehensive Guide for Optimal Returns
-

 Global Economy10 months ago
15 Most Lucrative Sectors for Investment in Pakistan: A 2025 Data-Driven Analysis
-

 Global Economy10 months ago
Pakistan’s Export Goldmine: 10 Game-Changing Markets Where Pakistani Businesses Are Winning Big in 2025