
Markets & Finance
China Stocks Today: Are Big Economies in Asia Nearing a Market Bottom?

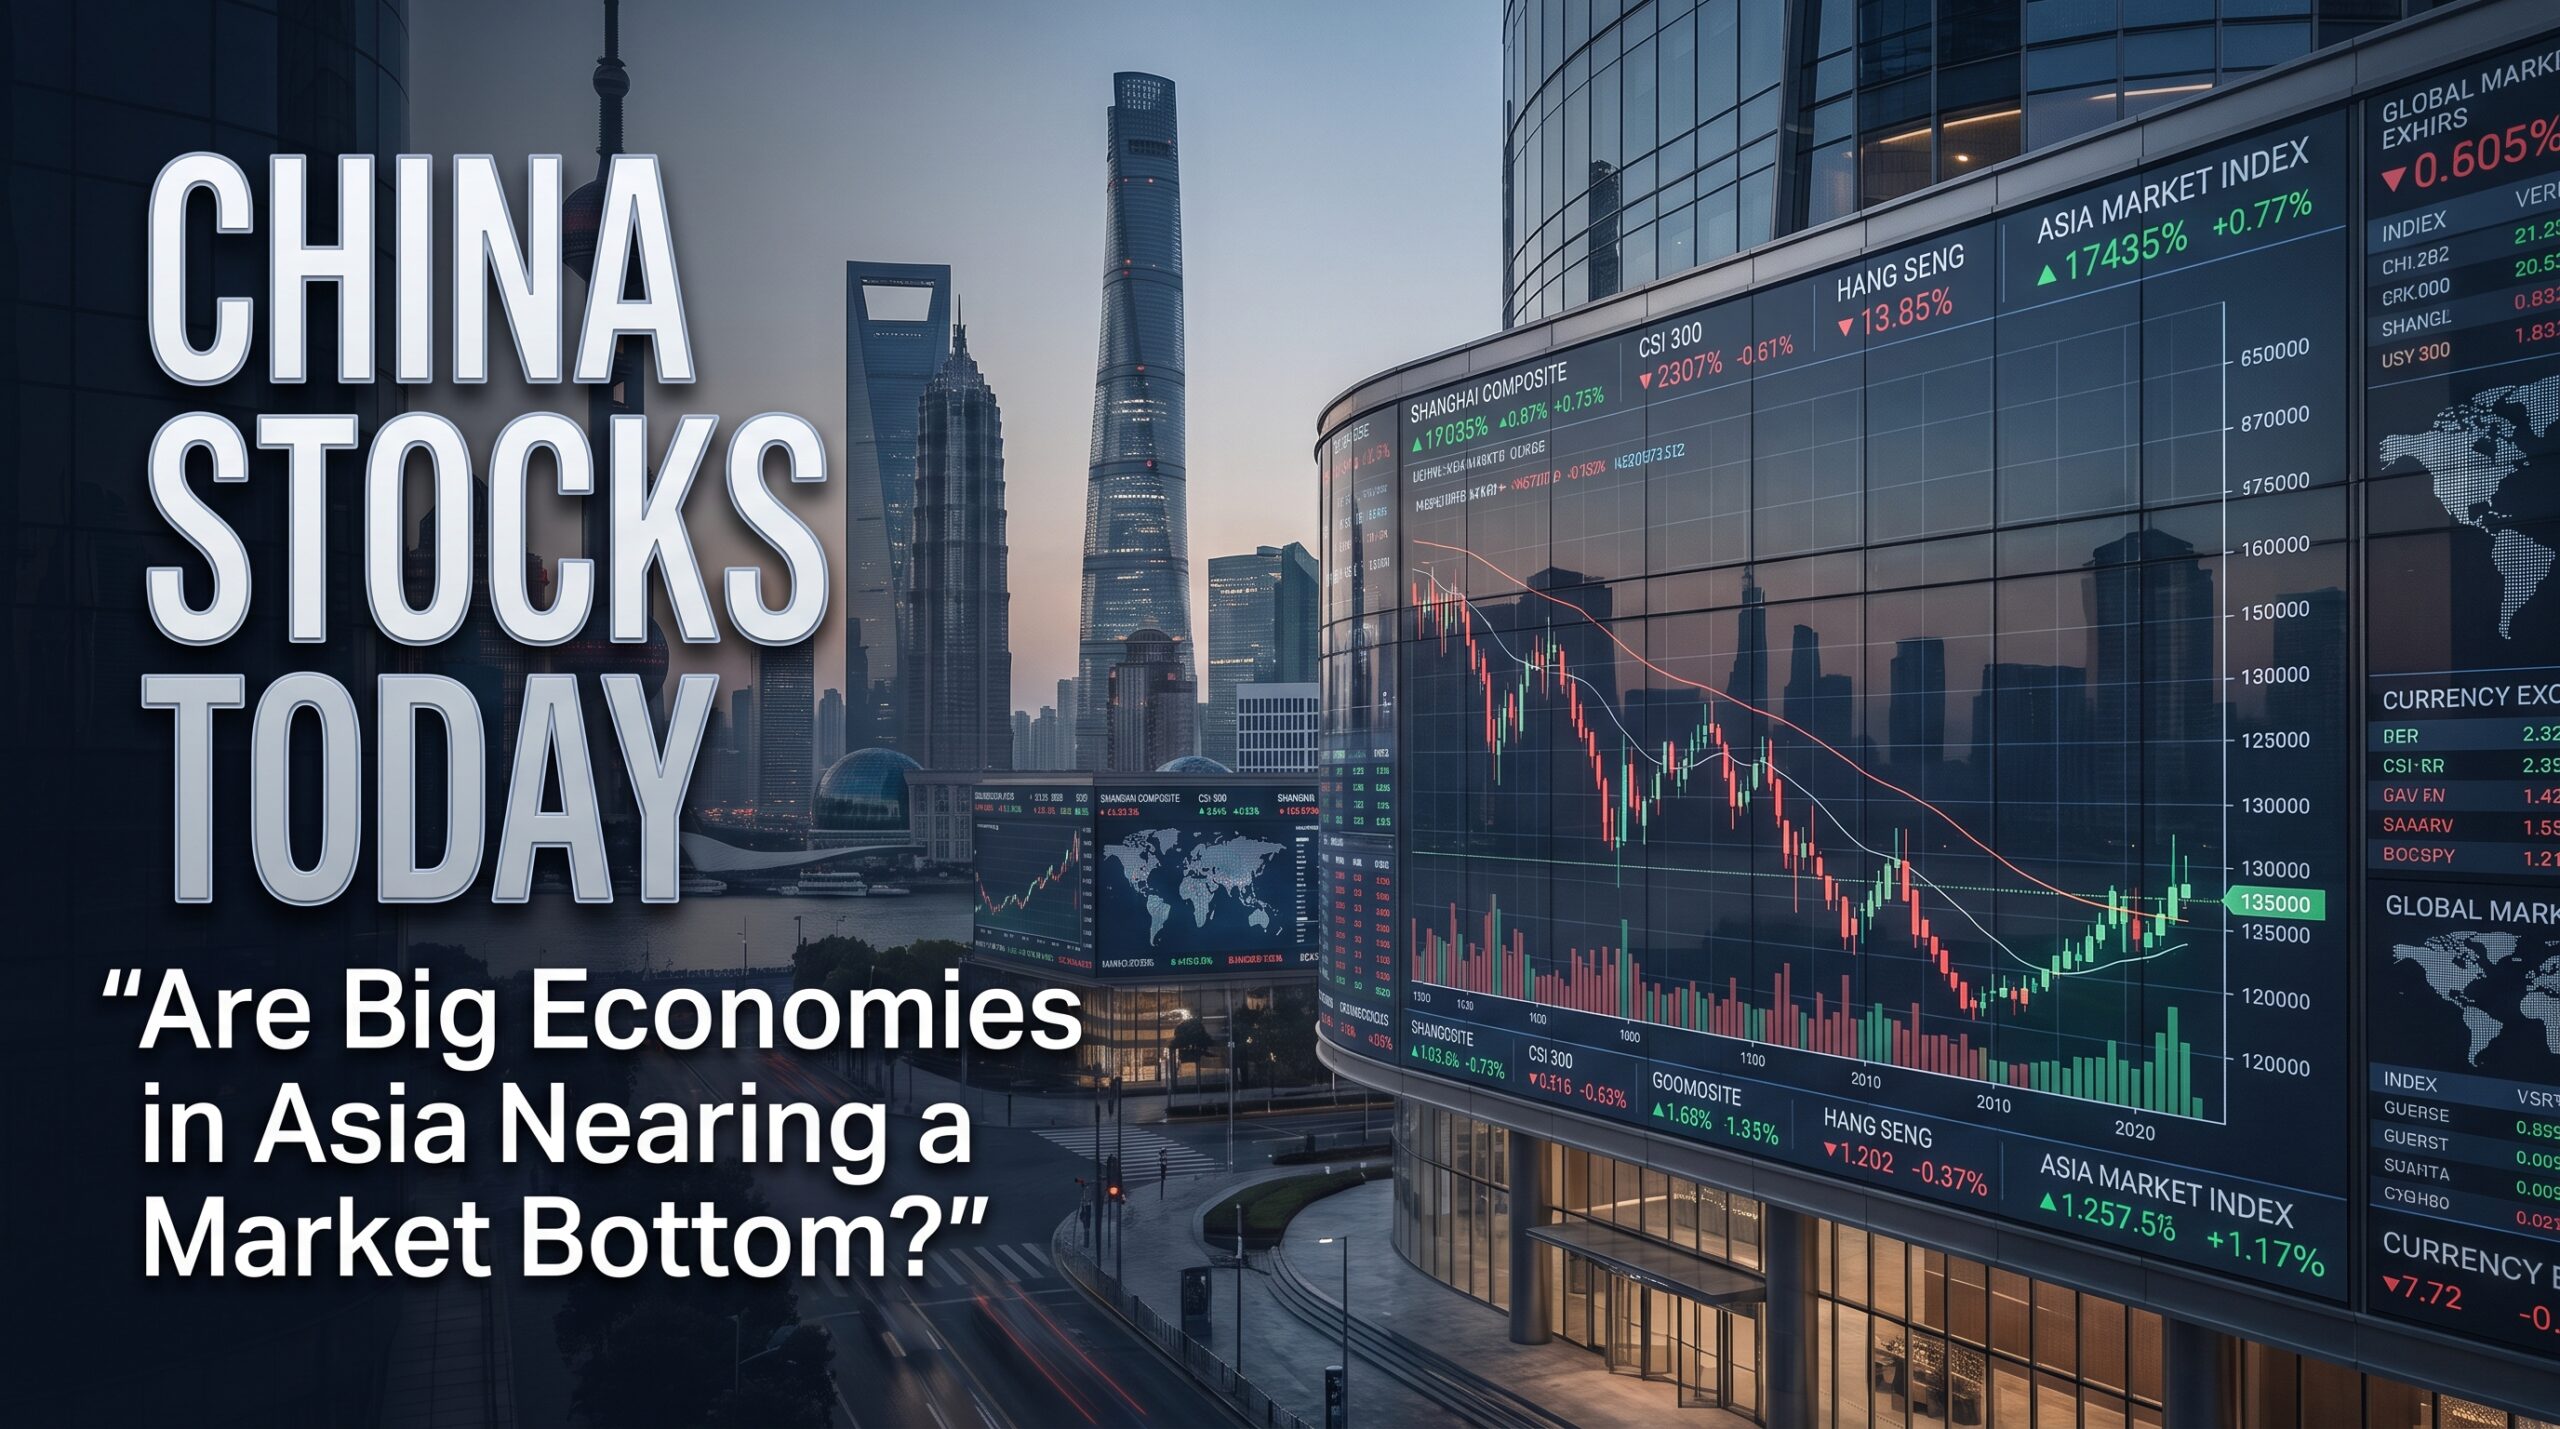
Key Takeaways
- Mainland Chinese indices slid to multi-week lows in mid-September 2026, with the Shanghai Composite at 3,888 (a two-week low) and the Shenzhen Component at 13,471 (an over one-month low), pressured by rising oil prices and higher US Treasury yields.
- Hong Kong’s Hang Seng Index has been choppier still, falling as low as 24,954 in early September amid Middle East-driven risk-off sentiment, before stabilizing near 25,300.
- Beijing has responded with roughly RMB 360 billion (~$54 billion) in fresh capital injections into major state-owned banks and insurers — a policy-driven floor that stands in contrast to more cautious international investor sentiment.
- China’s semiconductor and AI sector continues attracting capital despite the broader selloff — Shanghai chipmaker Enflame Technology recently raised roughly $908 million in a heavily oversubscribed IPO.
- The IMF’s July 2026 outlook raised China’s 2026 growth forecast to 4.6%, even as the broader stock market today narrative remains one of policy support offsetting external headwinds rather than a clean, confirmed bottom.
Chinese equities have spent much of September 2026 grinding lower, caught between two competing forces: a genuinely supportive domestic policy stance from Beijing, and an external environment darkened by surging oil prices and rising US bond yields. For investors asking whether Chinese and Hong Kong-listed stocks are approaching a durable bottom, the honest picture is mixed — supportive at the policy level, but not yet confirmed at the price level.
The Current Selloff, By the Numbers
As of the second week of September 2026, the Shanghai Composite closed at 3,888.1, a two-week low, down 1.18% on the day and roughly 1.48% over the trailing month. The Shenzhen Component fared worse, dropping 1.08% to an over one-month low of 13,471.3. The proximate causes were external rather than domestic: rising oil prices — driven by the escalating US-Iran conflict — combined with a jump in US Treasury yields after a weaker-than-expected US Treasury buyback operation, weighed on risk appetite across Asian markets broadly.
Notable laggards during the slide included Zijin Mining Group (-5.42%), CMOC Group (-4.52%), CATL (-2.23%), and East Money Information (-3.48%) — a mix of commodity and financial-services names sensitive to both global rate expectations and China’s own growth trajectory.
Hong Kong has told a similarly volatile story. The Hang Seng Index fell to as low as 24,954 in early September as Middle East tensions and surging oil prices weighed on sentiment, before partially recovering to trade around 25,300–25,650 in subsequent sessions. Tech names bore the brunt of the volatility: Chinese AI startups Z.AI Co. and MiniMax posted sharp single-day declines of over 3% and 7% respectively during the worst sessions, while over the trailing month, JD Logistics and Kuaishou each fell roughly 26%.
Beijing’s Policy Floor
What differentiates this selloff from prior Chinese market corrections is the scale and speed of policy support. Chinese authorities have unveiled roughly RMB 360 billion (approximately $54 billion) in capital injections into major state-owned banks and insurers — a move analysts say is partly intended to strengthen institutions Beijing increasingly wants positioned as long-term equity investors. Estimates suggest the measures could support around RMB 100 billion of additional insurer equity exposure to domestic markets, effectively building a policy-driven demand floor beneath the broader index.
This “national team” style intervention has a track record in China of stabilizing markets during external shocks, even if it hasn’t historically produced immediate V-shaped recoveries. The key question for investors is whether this round of support proves sufficient to offset the current combination of high oil prices, elevated global bond yields, and lingering uncertainty around US-China trade dynamics.
The Technology Counter-Narrative
Even amid the broader selloff, China’s technology and semiconductor sector has continued attracting significant capital — a sign that investor conviction in China’s AI self-reliance push remains intact regardless of the macro backdrop. Shanghai-based AI chipmaker Enflame Technology raised approximately $908 million in a heavily oversubscribed IPO, underscoring investor appetite for domestic alternatives to Nvidia as Beijing continues pushing technological self-reliance amid ongoing US export restrictions. During a brief rebound period earlier in September, communications shares rose 6.2% and electronics gained 3.9% in a single session, even as coal and non-bank financial stocks fell.
Index Snapshot: Where Things Stand
| Index | Recent Level | Recent Trend |
|---|---|---|
| Shanghai Composite | ~3,888 | Two-week low, -1.48% trailing month |
| Shenzhen Component | ~13,471 | Over one-month low, -0.34% weekly |
| CSI 300 | ~4,575–4,578 | Broadly flat to slightly down |
| Hang Seng Index | ~25,300 (range 24,954–25,650) | Volatile, Middle East-driven swings |
| Hang Seng TECH | ~4,527 | -2.0% over one week during worst sessions |
Why This Matters: Policy Support vs. External Shock
The IMF’s July 2026 World Economic Outlook update raised China’s 2026 growth forecast to 4.6%, a relatively resilient number within a global backdrop the Fund otherwise describes as uneven — energy importers under pressure, technology-value-chain economies benefiting from the AI investment cycle. China occupies an unusual middle position: an energy importer exposed to the same oil-price shock hitting other Asian markets, but also a major beneficiary of the AI capital-expenditure supercycle through its domestic chip and data-center buildout.
For investors trying to time a bottom, the more instructive signal may not be the index level itself but the divergence between policy-driven sectors (banks, insurers, state-directed capital) and sentiment-driven sectors (consumer platforms, logistics, export-exposed names). The former has stabilized meaningfully on Beijing’s RMB 360 billion intervention; the latter remains hostage to the same global risk-off dynamics pressuring markets from Tokyo to Riyadh.
Frequently Asked Questions
Have Chinese stocks bottomed out in September 2026?
Not conclusively. Beijing’s roughly $54 billion capital injection into banks and insurers has provided policy support, but the broader index remains pressured by external factors — elevated oil prices and rising US Treasury yields — that are outside domestic policymakers’ control.
Why are Chinese tech and semiconductor stocks still attracting investment despite the selloff?
Investor appetite for Chinese AI self-reliance remains strong, evidenced by chipmaker Enflame Technology’s roughly $908 million oversubscribed IPO, even as broader indices like the Shanghai Composite and Hang Seng have declined.
What is the IMF’s 2026 growth forecast for China?
The IMF’s July 2026 World Economic Outlook update raised China’s 2026 growth forecast to 4.6%, reflecting relative resilience within a global economy otherwise strained by the Middle East conflict’s impact on energy-importing nations.
Discover more from The Economy
Subscribe to get the latest posts sent to your email.


Key Takeaways
- The World Bank’s most recent Pakistan Development Update projects FY26 GDP growth of just 3.0%, held back by catastrophic 2025 flood damage that cut agricultural output by nearly 10%, before growth picks up to 3.4% in FY27.
- The World Bank’s April 2026 regional update shows the wider Middle East, North Africa, Afghanistan, and Pakistan (MENAAP) region — excluding Iran — slowing sharply from 4.0% growth in 2025 to just 1.8% in 2026, a 2.4-percentage-point downgrade from January projections, driven by the Iran war’s regional spillover.
- Pakistan’s poverty data in the same reports is sobering: the share of the population living below the international $3-per-day poverty line surged from 16.5% to 46% between 2018 and 2023, with nearly nine in ten Pakistanis now below the $4.20-per-day threshold.
- The Bank credits Pakistan’s National Tariff Policy (2025–2030), which aims to halve tariffs over five years, as a potential long-term competitiveness driver — but cautions benefits depend on complementary reforms in logistics, taxation, and energy pricing that will take years to materialize.
- Despite the sobering structural picture, the KSE-100 has still outperformed dramatically on a market basis — closing FY26 up 44% — showing a persistent disconnect between equity-market sentiment and the World Bank’s underlying growth and poverty data.
While the IMF’s disbursing Extended Fund Facility gets most of the market-moving headlines for Pakistan, the World Bank’s parallel analytical work — through its biannual Pakistan Development Update and its MENAAP regional economic updates — provides a very different, and arguably more sobering, lens on the structural forces shaping PSX stability. This piece works through what the Bank’s own data actually says, and why it sits somewhat uneasily alongside the KSE-100’s blockbuster 2026 performance.
The World Bank’s Pakistan Growth Forecast
The World Bank’s Pakistan Development Update, titled Staying the Course for Growth and Jobs, projects Pakistan’s real GDP growth to remain at 3.0% for FY26 (the fiscal year ending June 2026) — unchanged from the 3.0% Pakistan actually achieved in FY25, itself an improvement from 2.6% the year before. The Bank attributes the flat FY26 forecast primarily to the devastating impact of the 2025 floods across Punjab and Sindh, which reduced agricultural output by nearly 10% and damaged major crops including rice, sugarcane, wheat, cotton, and maize.
Agriculture is not a marginal sector in this context — it supports nearly 40% of Pakistan’s labour force and contributes roughly one-fifth of GDP, meaning flood-related disruption there ripples through the broader economy well beyond the farm sector itself. The Bank projects growth picking up to 3.4% in FY27, contingent on continued macroeconomic stability and successful implementation of ongoing reforms — but explicitly notes that tight fiscal policy aimed at rebuilding economic buffers will continue to constrain the pace of any rebound.
The Regional Picture: MENAAP Under Pressure
Pakistan doesn’t sit in isolation from the wider region the World Bank tracks, and the regional numbers paint an even more difficult picture. The Bank’s Middle East, North Africa, Afghanistan, and Pakistan (MENAAP) regional economic update — most recently refreshed in April 2026 under the title Challenges of Conflict and Industrial Policy for Development — shows that, excluding Iran itself, overall regional growth is expected to slow from 4.0% in 2025 to just 1.8% in 2026, a downgrade of 2.4 percentage points versus the Bank’s January projections.
The Bank’s July 2026 Global Economic Prospects update reinforces this framing, explicitly identifying MENAAP as “the worst affected” region globally by the Middle East conflict, while noting that South Asia — the broader grouping that includes Pakistan alongside India and Bangladesh — remains comparatively the fastest-growing region, with impacts varying based on each country’s energy exposure, strategic reserves, and available policy buffers. For Pakistan specifically, that framing matters: as a net energy importer without the Gulf region’s oil-export offsets, Pakistan sits closer to the vulnerable end of that regional spectrum.
The Uncomfortable Poverty Data Behind the Growth Numbers
Perhaps the most striking figures in the World Bank’s Pakistan analysis aren’t growth rates at all, but poverty statistics. Between 2018 and 2023, the share of Pakistan’s population living below the international poverty line of $3 per day (PPP) surged from 16.5% to 46% — a reversal of years of prior progress. At the slightly higher $4.20-per-day threshold, the Bank estimates nearly nine in ten Pakistanis now live in poverty, reflecting the combined toll of pandemic-era disruption, sustained inflation, and repeated climate disasters including the 2022 and 2025 floods.
The Bank explicitly warns that this sharp deterioration risks entrenching inequality and social instability — a structural risk that sits in tension with the more optimistic, momentum-driven narrative often associated with the KSE-100’s record-breaking equity performance over the same period.
Reform Levers the World Bank Is Watching
On the policy side, the Bank has highlighted Pakistan’s National Tariff Policy (2025–2030), which aims to cut tariffs by roughly half over five years, as a potentially meaningful driver of longer-term export competitiveness. However, the Bank is careful to caveat that the benefits of tariff liberalization will take time to materialize and depend heavily on complementary reforms across logistics, taxation, and energy pricing — areas where Pakistan’s track record on sustained implementation has historically been mixed.
World Bank Data Snapshot
| Metric | Figure |
|---|---|
| Pakistan FY26 GDP growth (World Bank forecast) | 3.0% |
| Pakistan FY27 GDP growth (World Bank forecast) | 3.4% |
| MENAAP region 2026 growth (ex-Iran) | 1.8%, down from 4.0% in 2025 |
| Population below $3/day poverty line (2023) | 46%, up from 16.5% in 2018 |
| Population below $4.20/day poverty line | ~90% |
| Agricultural output loss from 2025 floods | ~10% |
Why the Disconnect Matters for PSX Investors
The tension here is real and worth naming directly: the KSE-100 delivered a 44% gain in FY26, even as the World Bank’s own growth forecast for that same fiscal year sat at a comparatively modest 3.0%, against a backdrop of surging poverty and a sharply downgraded regional outlook. This isn’t necessarily contradictory — equity markets often price forward-looking reform momentum, IMF program credibility, and remittance-driven currency stability well ahead of broad-based GDP or poverty statistics catching up. But it does mean investors relying purely on KSE-100 price action risk missing the structural fragility the World Bank’s data continues to flag: a economy still highly exposed to climate shocks, regional conflict spillover, and deep social strain that hasn’t meaningfully eased even as headline stock returns have soared.
Frequently Asked Questions
What does the World Bank forecast for Pakistan’s economy in 2026?
The World Bank’s Pakistan Development Update projects 3.0% GDP growth for FY26, held back by 2025 flood damage to agriculture, with growth expected to pick up to 3.4% in FY27 contingent on continued reforms.
Why has poverty risen so sharply in Pakistan despite stock market gains?
World Bank data shows the population below the $3-per-day poverty line surged from 16.5% to 46% between 2018 and 2023 due to pandemic disruption, inflation, and repeated flooding — a structural trend largely disconnected from the KSE-100’s recent equity-market rally.
How is the Middle East conflict affecting Pakistan’s regional growth outlook?
The World Bank’s MENAAP regional update shows growth excluding Iran slowing from 4.0% in 2025 to 1.8% in 2026, a downgrade attributed directly to the conflict’s spillover effects on energy prices and regional stability.
Discover more from The Economy
Subscribe to get the latest posts sent to your email.
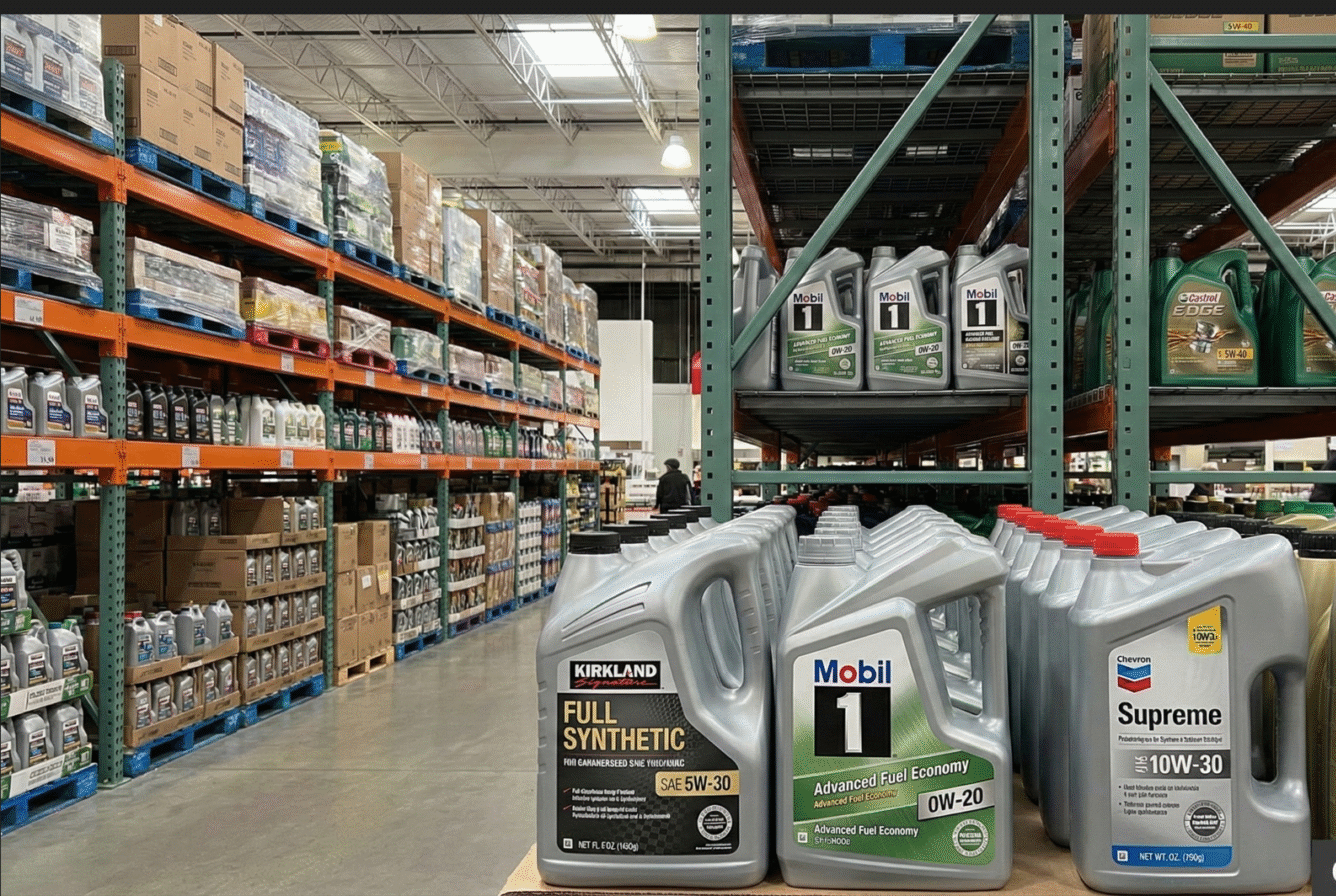
Key Takeaways
- Costco’s rationing of Kirkland Signature motor oil is a visible symptom of an industry-wide problem: the Independent Lubricant Manufacturers Association (ILMA) says roughly 44% of the US Group III base oil supply has been sidelined by Middle East conflict disruptions.
- Automakers Toyota and Nissan have already issued dealer guidance on oil-grade substitutions and allocation limits for low-viscosity synthetic formulations like 0W-8 and 0W-16, the grades most exposed to the shortage.
- Group III base oil prices have climbed to more than $10 per gallon, historically elevated levels, with some reports citing spot prices nearly tripling versus pre-conflict baselines.
- ILMA does not expect conditions to fully normalize until at least mid-2027, meaning this is a multi-quarter supply disruption rather than a temporary shelf-stocking issue.
- Retail-level “shortage” so far looks more like rising prices and shrinking selection than empty shelves nationwide — Costco’s rationing is currently one of the more extreme individual-retailer responses, not evidence that all synthetic oil is disappearing.
Costco’s decision to cap Kirkland Signature motor oil purchases made headlines, but it’s only the most visible data point in a much larger, months-long supply crunch that’s been building since the US-Iran conflict began disrupting Middle Eastern base-oil production and shipping. The real question for drivers isn’t whether one warehouse club is rationing — it’s whether all synthetic motor oil is headed toward sustained price increases and tighter supply, and the answer, based on the fullest available industry data, is a qualified yes.
The Scope of the Problem: It’s Not Just Costco
Executives at major lubricant and auto-parts companies — including Shell, Valvoline, and O’Reilly Automotive — have warned investors directly about cost pressure and supply-chain strain affecting synthetic motor-oil production. ILMA has characterized the situation as a “global base oil supply crisis,” attributing it to refinery outages and shipping disruptions through the Strait of Hormuz that have tightened the supply of Group III base oils — the refined lubricant feedstock used in most modern synthetic motor oil.
According to ILMA’s most detailed accounting, roughly 44% of US Group III base oil supply has been affected by the disruption, with the lightest viscosity grades — the 0W-20, 0W-16, and 0W-8 formulations increasingly required by modern, fuel-efficient engines — the most exposed. Group III base oil prices have climbed past $10 per gallon, a historically elevated level, with some reporting describing spot prices as having nearly tripled from pre-conflict baselines.
Automakers Are Already Rationing — Not Just Retailers
Perhaps the most telling sign that this is a supply-side, not retailer-side, problem: automakers themselves have begun rationing. Toyota has sent service departments guidance on substituting oil grades for certain hybrid models, while both Toyota and Nissan dealers reportedly received internal communications warning that allocations of genuine, factory-specified synthetic oils could become difficult to maintain consistently — particularly for lighter-viscosity grades like 0W-8 and 0W-16 used in newer, fuel-efficient engines.
A leaked memo reportedly circulated to AutoZone store managers in the Southeast described the situation bluntly, warning of “the largest supply shortage of lubricating fluids in the modern history of America” and cautioning that overall product availability could shrink by as much as 40%. Separately, industry sources indicated that Mobil and Shell informed both Costco and Walmart that they lacked sufficient packaged product to fulfill orders, raising the prospect of bare shelves in motor-oil sections at major retailers.
How Bad Is It At the Retail Level, Really?
Despite the alarming internal warnings, independent lubricant-industry analyst Tom Glenn, publisher of JobbersWorld, has cautioned against characterizing the situation as a full “broad retail shortage” — at least as of the disruption’s earlier stages. Consumer-quantity purchases (5-quart jugs at retailers like Walmart, AutoZone, and Amazon) had not been systemically constrained as of mid-2026, even as wholesale and dealer-allocation levels tightened significantly and prices rose 15–30% above 2025 baselines. Glenn’s assessment: “availability is beginning to matter as much as — and in some cases more than — price,” as suppliers increasingly operate defensively to protect access to approved synthetic formulations.
Costco’s explicit two-box, seven-day rationing policy, alongside its nearly doubled Kirkland Signature pricing, represents one of the more aggressive individual-retailer responses documented so far — suggesting either tighter supplier allocations specific to Costco’s bulk-purchase model, or a proactive anti-hoarding measure ahead of anticipated further tightening.
Price and Supply Snapshot
| Indicator | Pre-Conflict Baseline | Mid-2026 Status |
|---|---|---|
| Group III base oil price | Historically stable | $10+/gallon, up sharply |
| US Group III supply affected | 0% | ~44% |
| Retail 5-quart jug prices | Baseline | +15–30% |
| Kirkland Signature 10-qt box | ~$30 | $57.99 (rationed) |
| Expected normalization | N/A | Not before mid-2027 |
Which Vehicles Are Most Affected?
The shortage disproportionately affects owners of newer, fuel-efficient vehicles that require low-viscosity synthetic grades — particularly 0W-8, 0W-16, and 0W-20 formulations common in recent Toyota, Nissan, and other Asian-brand models. Owners of older vehicles using more conventional viscosity grades (5W-30, 10W-30) are somewhat less exposed, since those formulations rely less heavily on the specific Group III feedstock under the most severe supply pressure, though pricing pressure is being felt across nearly all synthetic categories.
Why This Matters: A Multi-Quarter Problem, Not a Blip
The most important data point for consumers planning ahead is ILMA’s own timeline: the association does not expect conditions to fully normalize until at least mid-2027, tying the recovery directly to when Middle East shipping and refining disruptions ease. That means this isn’t a short-term shelf-stocking hiccup tied to one retailer’s supply contract — it’s a structural, multi-quarter supply constraint that will likely keep upward pressure on oil-change pricing at dealerships, quick-lube chains, and DIY retail purchases well into 2027, regardless of whether any single retailer like Costco lifts its rationing policy sooner.
Frequently Asked Questions
Will all synthetic motor oil prices double, not just Costco’s?
Prices industry-wide have risen 15-30% at the consumer level as of mid-2026, with wholesale Group III base oil costs up far more sharply. Costco’s near-doubling of its Kirkland Signature product is among the more extreme individual cases rather than an industry-wide universal figure, but continued upward pressure across brands is expected through at least mid-2027.
Why are Toyota and Nissan rationing motor oil to dealerships?
Both automakers rely heavily on low-viscosity synthetic oil grades (0W-8, 0W-16) for newer, fuel-efficient engines, and these are the grades most exposed to the Group III base-oil supply disruption tied to the US-Iran conflict’s impact on Middle East shipping and refining.
When will the motor oil shortage end?
The Independent Lubricant Manufacturers Association does not expect conditions to fully normalize until at least mid-2027, meaning drivers should expect elevated prices and periodic availability issues for the coming several quarters.
Discover more from The Economy
Subscribe to get the latest posts sent to your email.
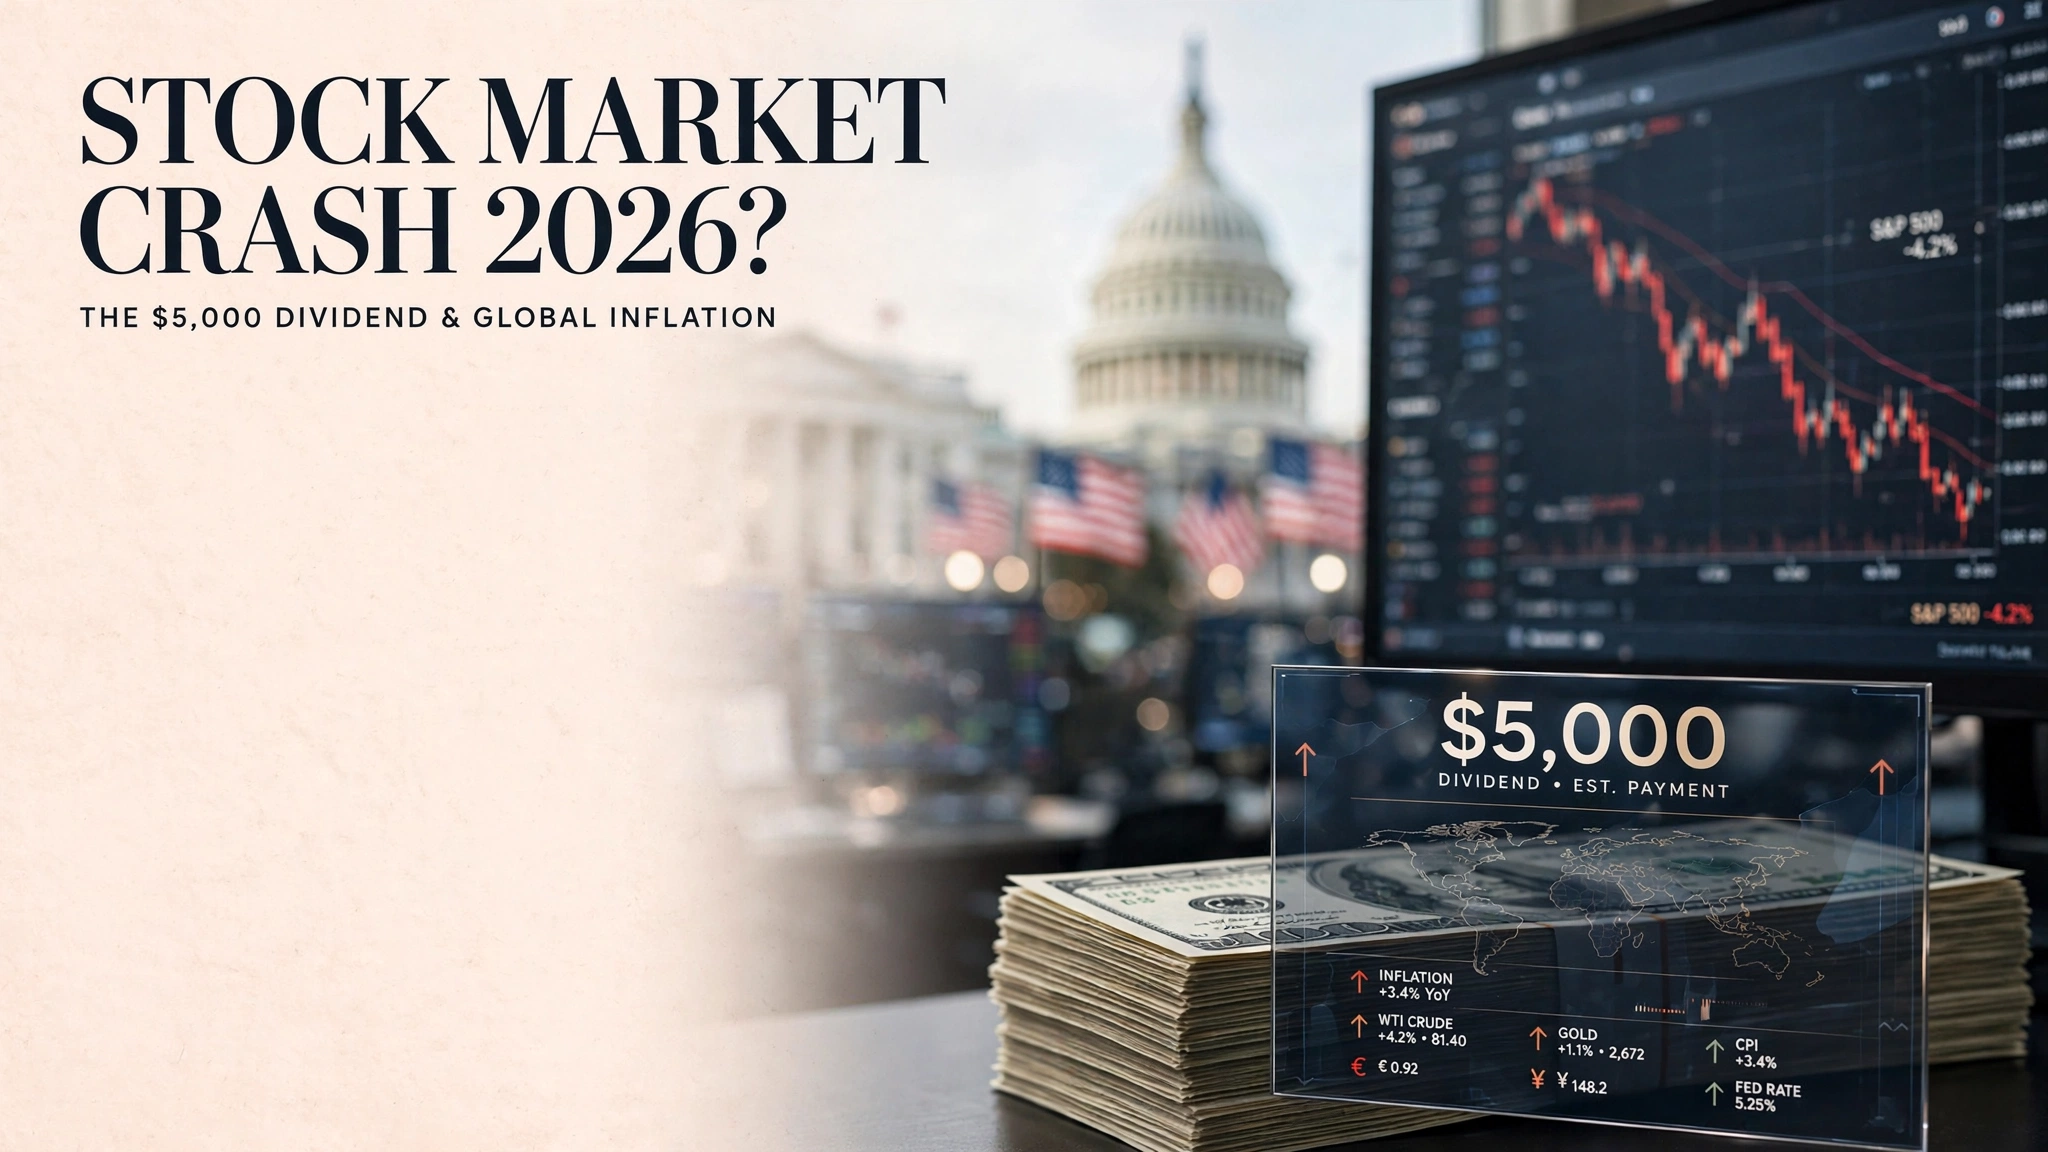
Key Takeaways
- President Trump pledged a $5,000 “dividend” to every adult US citizen if Republicans hold Congress in the November 2026 midterms — a promise that could cost $1.2–1.3 trillion.
- The pledge, made at the RNC’s midterm convention in Dallas, requires congressional approval; Trump cannot issue the payment unilaterally.
- Economists warn the plan could reignite the kind of demand-side inflation last seen after COVID-era stimulus, at a moment when the IMF’s July 2026 World Economic Outlook already flags stalled global disinflation.
- US national debt recently crossed $40 trillion, raising bond-market anxiety about how — or whether — the payout would be financed.
- Markets are watching closely: any serious step toward funding the dividend could trigger volatility reminiscent of a stock market crash scare, even though equities have so far treated it as a political promise rather than fiscal fact.
Wall Street has weathered plenty of noise in 2026 — an Iran war, a Strait of Hormuz oil shock, and a Federal Reserve under new leadership. But few headlines have generated as much dinner-table debate as President Donald Trump’s pledge, delivered at the Republican Party’s midterm convention in Dallas, to send every adult American a $5,000 “dividend” if the GOP holds the House and Senate in November. It is the kind of promise that reads like a campaign slogan and spends like a macroeconomic event, and it lands at a moment when the global economy is already wrestling with sticky inflation, a fragile bond market, and a stock market today that has priced in a lot of good news.
This piece unpacks what the pledge actually says, why it differs from prior stimulus rounds, what independent economists and the bond market are signaling, and how retail investors should think about positioning if Washington actually tries to make it real.
What Trump Actually Promised
Speaking to a energized crowd chanting “USA, USA,” Trump laid out the offer in explicit terms: “If the Republicans win the House of Representatives and the United States Senate, I will issue a dividend to every adult citizen in the United States of America for $5,000.” He compared it to a company distributing a cash dividend to shareholders, framing federal fiscal surplus rhetoric — despite the government running a deficit — as the justification.
Crucially, the pledge is conditional twice over: first on the election outcome, and second on Congress actually appropriating the money, since the president has no unilateral authority to cut $5,000 checks to roughly 245–270 million adult citizens. That total population figure is also where the eye-popping price tag comes from: independent estimates converge on a range of $1.2 to $1.3 trillion, according to reporting from CNBC and Al Jazeera, depending on which adult-population baseline is used.
This isn’t Trump’s first flirtation with direct payments in his second term. Earlier proposals included a $2,000 “tariff dividend” funded by import-duty revenue and a “DOGE dividend” tied to Elon Musk’s since-wound-down federal-spending-cuts initiative. Neither has been paid out. The pattern matters for credibility: markets and voters alike are now weighing this pledge against a track record of unrealized promises.
Why the Timing Raises Inflation Flags
The proposal arrives seven months into an unpopular war with Iran, with Trump’s approval rating down to roughly 33% in some polling, and with affordability concerns fueling a string of progressive primary wins. Politically, a cash injection ahead of a referendum-style midterm is a classic play. Economically, it’s landing on top of an already-strained system.
The IMF’s July 2026 World Economic Outlook Update — one of the most closely watched IMF Reports of the year — projects global growth of 3.0% for 2026 and 3.4% for 2027, broadly flat versus April on a cumulative basis. But the more alarming figure is inflation: the Fund lifted its global headline inflation forecast to 4.7% for 2026, up from 4.1% in 2025, marking the third consecutive upward revision since January. The IMF explicitly attributes the stall in disinflation to the Middle East war’s effect on energy prices, not to fiscal largesse — but a trillion-dollar-plus payout, unfunded and untargeted, is precisely the kind of demand shock that could push that number higher still.
Stock Market Crash Risk: Separating Political Theater from Fiscal Reality
So far, US equities have not priced this as an imminent shock. That’s partly because the payment is contingent on an election outcome five to six weeks away, and partly because markets have learned to discount Trump-era spending promises that haven’t survived the legislative process. But three transmission channels are worth watching:
- Bond yields. With the debt already above $40 trillion, any credible signal that Congress might actually appropriate $1.2 trillion in new spending would likely push Treasury yields higher, tightening financial conditions and pressuring equity valuations — particularly rate-sensitive sectors like housing and small-cap growth stocks.
- Dollar and inflation expectations. A stimulus check of this scale, deployed at a moment of already-elevated inflation, risks re-anchoring consumer inflation expectations upward — the same dynamic that made the 2021–2022 inflation surge so persistent.
- Fed policy path. The Federal Reserve, already navigating a leadership transition, would face a harder choice between supporting growth and containing prices if a stimulus package of this size moved toward passage.
None of this guarantees a stock market crash in the technical sense of a rapid 20%+ drawdown. But it does raise the probability of a volatility spike if the proposal gains legislative traction, especially given that valuations are already stretched by the AI-driven rally that has powered indices to records in 2026.
Historical Context: How Direct Payments Have Moved Markets Before
| Stimulus Episode | Approx. Size | Market/Inflation Outcome |
|---|---|---|
| 2020 CARES Act checks | ~$270B (direct payments) | Supported markets during COVID crash recovery; limited inflation impact given demand collapse |
| 2021 American Rescue Plan | ~$1.9T total | Widely cited as a contributor to 2021–2022 inflation surge (peak ~9% CPI) |
| Proposed 2026 “Trump Dividend” | ~$1.2–1.3T | Contingent on midterms; would land amid already elevated 4.7% IMF inflation forecast, not a demand collapse |
The comparison to 2021 is instructive precisely because the starting conditions are worse: in 2021, the economy was recovering from a demand collapse, giving stimulus room to work without immediately overheating prices. In 2026, the proposal would land on an economy already running above-target inflation due to a live geopolitical energy shock — a materially higher-risk setup.
Why This Matters for Retail Investors
Beyond the politics, there’s a practical takeaway: stock market today headlines will likely stay noisy through November as the midterm race tightens and the dividend pledge dominates coverage. Investors should treat the promise as a low-probability, high-impact scenario rather than a base case — legislative gridlock, fiscal hawks within the GOP (Freedom Caucus members have already publicly questioned funding), and the sheer logistics of the payout make near-term passage unlikely. But hedging playbooks — TIPS, gold, and diversified international exposure — remain sensible given the asymmetric inflation risk already flagged by the IMF, independent of whether the dividend ever passes.
Frequently Asked Questions
Is the $5,000 Trump dividend guaranteed to happen?
No. It is contingent on Republicans winning both the House and Senate in the November 2026 midterms, and would still require congressional legislation to authorize and fund the payment — something Trump cannot do unilaterally.
Could the $5,000 dividend cause a stock market crash?
Not on its own and not immediately. The bigger risk is a gradual rise in bond yields and inflation expectations if the proposal gains real legislative momentum, which could pressure equity valuations rather than trigger an instant crash.
How does this compare to the IMF’s 2026 global economy outlook?
The IMF’s July 2026 World Economic Outlook already projects inflation rising to 4.7% this year due to the Middle East war’s impact on energy prices. An unfunded $1.2 trillion-plus payout would add further upside risk to that forecast if it moved toward passage.
Discover more from The Economy
Subscribe to get the latest posts sent to your email.

Emerging Markets Update: The Impact of World Bank Policies on PSX Stability

Costco Oil Shortage 2026: Will Prices Double for All Synthetic Motor Oils?

Trump’s $5,000 Promise: The Hidden Tax Implications for Retail Investors

Global Economy Outlook 2026: What Ceasefire Talks Mean for the Tech Sector

China Stocks Today: Are Big Economies in Asia Nearing a Market Bottom?

Stock Market Crash 2026? How the Trump $5,000 Dividend Impacts Global Inflation

Tax-to-GDP Ratio Explained: Global Benchmarks, Fiscal Sovereignty & 2026 Insights

Trade Deficit & Terms of Trade Explained: Global Impact, Real-World Examples, and 2026 Insights

Supply vs Demand Shocks Explained: Market Equilibrium, Inflation Risks & Policy Responses in 2026

Microeconomics vs. Macroeconomics Explained: Key Differences, Interdependence & Global Impact

Devaluation vs Depreciation: Clear Differences, Causes, and Economic Impact

Purchasing Power Parity (PPP) Explained: Global Rankings, Living Standards & Why Nominal Exchange Rates Mislead in 2026

Remittances 2026: Global Trends, Household Resilience & Economic Lifeline for Developing Nations

Stagflation Explained: Causes, Global Impact & 2026 Economic Outlook

State Farm’s $5B Dividend 2026: Who Qualifies & Payout Dates

US-China Relations in Q3 2026: Trade Tariffs and Supply Chain Risks

Gold’s Wild 2026: From a Record $5,600 Peak to a 24% Crash and Back Toward $4,500

Oil Surges as Strait of Hormuz Traffic Collapses Again

Bank of England Set to Hold Rates Through Year-End, Reuters Poll Shows

SpaceX Starship Flight 14: First Orbital Attempt & Starlink V3 Launch Explained

The 2026 Crypto Regulatory Shift: What It Means for Institutional Investors

Top 30 Stocks for Investment in PSX for Massive ROI in 2026

AI Chip Stocks 2026: The Best Semiconductor Investments Beyond Marvell

AI-Powered Training: The Next Multi-Billion Dollar Ecosystem in Fitness

Russia’s Black Sea Oil Exports Fall for a Fifth Straight Week

Tween Back-to-School Trends 2026: What’s Driving the $85B Season

Global Chip Selloff Deepens: What’s Driving the Aug. 19 Semiconductor Rout

Shein Clothes Quality & Safety in 2026: What Lab Tests Show
-

 Markets & Finance8 months ago
Top 15 Stocks for Investment in 2026 in PSX: Your Complete Guide to Pakistan’s Best Investment Opportunities
-

 Analysis7 months ago
Johor’s Investment Boom: The Hidden Costs Behind Malaysia’s Most Ambitious Economic Surge
-

 Analysis7 months ago
Top 10 Stocks for Investment in PSX for Quick Returns in 2026
-

 Analysis7 months ago
Brazil’s Rare Earth Race: US, EU, and China Compete for Critical Minerals as Tensions Rise
-

 Banks8 months ago
Best Investments in Pakistan 2026: Top 10 Low-Price Shares and Long-Term Picks for the PSX
-

 Investment8 months ago
Top 10 Mutual Fund Managers in Pakistan for Investment in 2026: A Comprehensive Guide for Optimal Returns
-

 Global Economy9 months ago
15 Most Lucrative Sectors for Investment in Pakistan: A 2025 Data-Driven Analysis
-

 Global Economy9 months ago
Pakistan’s Export Goldmine: 10 Game-Changing Markets Where Pakistani Businesses Are Winning Big in 2025