
Banks
Fed Ends Forward Guidance: What Kevin Warsh’s Shift Means


For fifteen years, traders built entire careers around parsing Federal Reserve speeches for hints about where interest rates were headed next. That game is now effectively over, and almost nobody outside a narrow circle of economists has noticed how big a deal this is.
At his most recent press conference, new Fed Chair Kevin Warsh told reporters he no longer intends to offer forward guidance on monetary policy. His reasoning: when the Fed signals its future intentions, investors start reacting to the Fed’s expectations rather than to actual economic conditions. That creates a feedback loop where markets are trading on the central bank’s mood rather than on data, which in turn denies the Fed clean information about what the economy is really doing. In Warsh’s own words, financial markets perform best when they react to incoming data, not to hints dropped in a press conference (Deloitte Insights).
It sounds like a technical shift. It isn’t. It’s arguably the most consequential change in Fed communications strategy since Ben Bernanke introduced explicit forward guidance in the aftermath of the 2008 financial crisis.
Why This Move Is Bigger Than the Headline Rate Decision
Most coverage of the Fed’s latest meeting focused on the fact that the benchmark rate was left unchanged. That’s the easy story. The harder, more important story is that the entire operating model investors have used to trade Fed policy for a decade and a half is being dismantled.
Forward guidance became the Fed’s primary tool during the zero-rate years because cutting rates further wasn’t an option — so instead, the central bank tried to shape expectations directly. Markets got used to it. Entire trading desks, hedge fund strategies, and bond-pricing models were built around anticipating what the Fed would say about what it planned to do next.
Warsh’s decision to abandon that approach means investors can no longer lean on the Fed’s own roadmap. They have to go back to reading raw data — jobs reports, inflation prints, retail sales — and forming independent judgments. That is a fundamentally different, and harder, way to trade.
The Inflation Backdrop Making This Riskier
This shift isn’t happening in a vacuum. It’s landing at a moment when the inflation picture is genuinely messy. Persistent geopolitical tension tied to the Middle East has kept energy markets on edge for months, and even as oil prices have pulled back from their peaks, the effects are still working their way through the broader price level. Strategists have flagged that markets may not be fully pricing in the possibility of at least one additional rate hike from the Fed in the second half of the year, even as economic growth stays resilient and consumers keep spending (CNBC).
That combination — strong growth, sticky inflation, heavy AI-driven capital investment — is unusual. Historically the Fed hikes to cool an overheating economy or cuts to support a weakening one. Right now it’s dealing with an economy that’s simultaneously strong and inflationary, without the clean signal-response mechanism forward guidance used to provide.
Adding another layer of complexity, Warsh has brought in former Bank of England Governor Mervyn King to co-chair a new communications task force reviewing exactly how the Fed talks to markets and the public, including its balance sheet approach and inflation framework, with conclusions expected by year-end (CPA Business News). That’s an unusual move — bringing in a foreign central banking veteran to help redesign how the world’s most important central bank talks to markets — and it signals this isn’t a one-off comment but a deliberate institutional shift.
What This Means for Different Types of Investors
Bond traders and rate-sensitive portfolios. Without forward guidance, the yield curve is likely to see more volatility around each data release rather than smoother repricing based on anticipated Fed rhetoric. Expect sharper moves on jobs reports and CPI prints going forward.
Equity investors. Growth stocks, and particularly the AI infrastructure trade that has powered much of this year’s rally, are especially sensitive to rate expectations. A Fed that reacts purely to data rather than pre-signaling creates more binary, headline-driven trading days.
Currency markets. The dollar has already been under pressure from a combination of fiscal deficit concerns and the broader de-dollarization trend playing out through central bank gold buying. Less predictable Fed communication adds another layer of uncertainty for currency desks trying to model rate differentials.
Housing and mortgage markets. Existing home sales data has already shown how sensitive buyers are to mortgage rate swings, with sales falling 2.4% in a recent month against expectations for a modest increase, even as median prices held near $440,600 (CNBC). A less predictable rate path makes it harder for buyers and lenders alike to plan.
The Global Ripple Effect
This isn’t purely a domestic US story. Central banks around the world calibrate their own policy partly in reaction to what the Fed signals. The Bank of England, the Bank of Canada, and monetary authorities across Asia have all built policy frameworks that assume a reasonably predictable Fed reaction function. If the Fed becomes harder to read, every other central bank’s forecasting job gets harder too — and that uncertainty tends to show up first in currency and bond markets before it reaches headlines.
The Bottom Line
Warsh’s decision to drop forward guidance is a bet that markets have become too dependent on Fed hand-holding, and that reverting to a data-driven reaction function will produce cleaner, more honest price discovery. It might be right. But the transition period — where investors relearn how to trade without a roadmap — is likely to be choppier than most portfolios are currently positioned for. The rate decision itself was a non-event. The communications overhaul underneath it is the real story, and it’s one that deserves far more attention than it’s currently getting.
Discover more from The Economy
Subscribe to get the latest posts sent to your email.


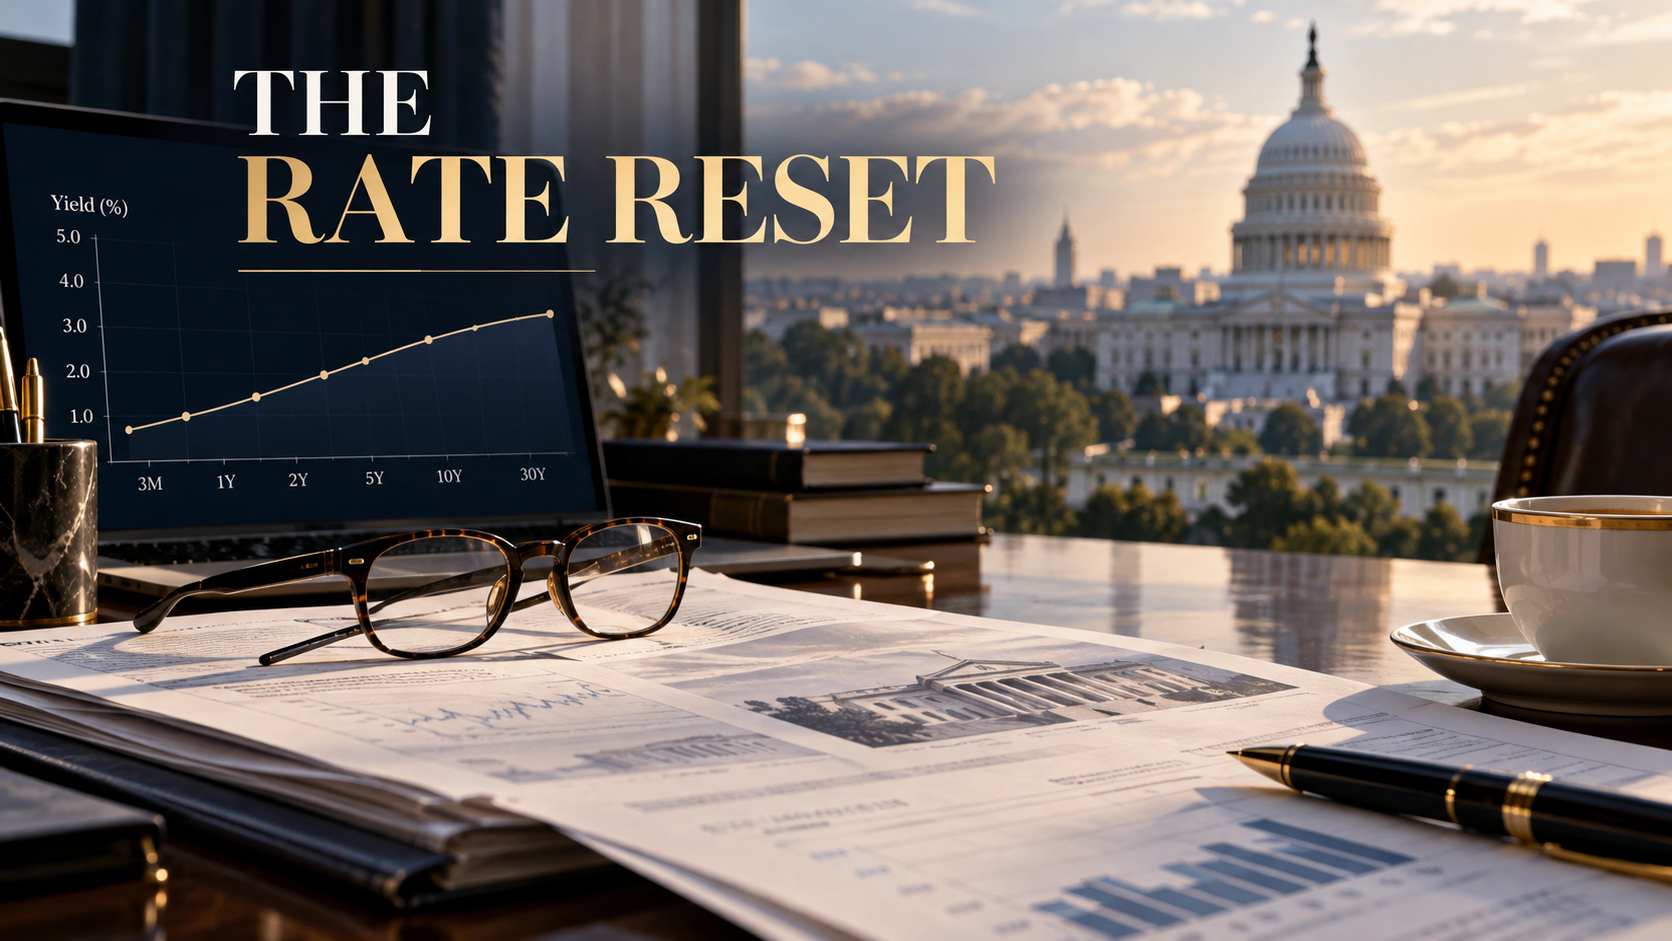
It is tempting to talk about “interest rates” as though there is one number moving the entire U.S. economy. In reality, the short-term policy rate set by the Federal Reserve and the market yield on a 10-year Treasury note can tell different stories. The first is a direct monetary-policy instrument. The second embeds investor expectations for future short-term rates, inflation, bond supply, economic uncertainty and compensation for holding long-duration debt.
In September, the Fed raised its target for the federal funds rate by a quarter percentage point to 3.75%–4.00%. That is a significant factual anchor for the October debate: the central bank was not simply holding policy unchanged. The official statement described resilient domestic activity and inflation that remained elevated. Federal Reserve September 16 statement.
On October 9, reporting placed the 10-year Treasury yield near 5.24% after a volatile week. For readers, the gap between these rates is more informative than either number alone. Associated Press market close.
Why a 10-year yield can exceed the policy rate
A bond yield reflects the price investors demand for a stream of future cash flows. When the price of an existing bond falls, its yield generally rises. Long-term yields may remain high even if investors think the Fed could eventually reduce short-term rates, because long-term inflation uncertainty, federal debt supply or term premiums may still justify additional compensation.
The opposite also happens. A central bank can raise its short-term rate while long-dated yields decline if bond investors believe tighter policy will bring inflation under control or weaken future growth. Therefore “the Fed hiked so all Treasury yields must rise” is an inaccurate shortcut. Market analysts need a time series and an explanation of which component changed.
What the Fed’s official data can—and cannot—say
The Federal Reserve publishes daily selected interest-rate data through its H.15 release. During the October 8 session, the listed 10-year constant-maturity Treasury rate was 5.22%; the later Friday market closing figures cited in news coverage were slightly different, reflecting observation timing and methodology. Federal Reserve H.15.
These values should not be presented as interchangeable real-time quotes. A daily Treasury constant-maturity series, an intraday cash-bond trade and a news-service closing yield can differ. High-quality financial reporting labels the instrument, source and timestamp. A difference of a few basis points can be normal even when all figures are independently correct.
The Fed also publishes economic projections and participant expectations. The September summary included elevated inflation projections, but these are not commitments by the committee or a binding timetable. Federal Reserve September economic projections.
Where SGOV fits into the story
The iShares 0–3 Month Treasury Bond ETF (SGOV) holds a portfolio of very short-dated U.S. Treasury securities. It is often discussed as an alternative to leaving uninvested money in a brokerage account because it seeks to earn short-term Treasury income with limited interest-rate sensitivity. The fund does not behave like a long-duration Treasury ETF, whose price can swing substantially when longer yields move.
As of the October 5 information visible on the issuer’s product page, SGOV displayed a 3.71% 30-day SEC yield and 0.09% expense ratio. These are dated metrics, not a promise of the rate a future investor will receive. Its income distribution changes with short-term market conditions, and the ETF can trade at a small premium or discount to net asset value. iShares SGOV facts.
Low duration is not the same as zero risk
Short-dated Treasury securities generally expose investors to far less interest-rate sensitivity than 10- or 30-year bonds, but several risks remain. ETF shares change price, market spreads exist, distributions fluctuate and inflation can erode the purchasing power of returns. A fund also differs legally from a bank deposit. Investors should not describe an ETF as FDIC-insured cash or assume the absence of a meaningful mark-to-market loss under every conceivable market condition.
Currency matters for international readers as well. A Pakistan-based investor considering a U.S. dollar Treasury product faces exchange-rate movements in addition to the securities’ dollar returns. Taxes, account access, fund structure and local regulation can also alter the practical outcome. A quoted U.S. dollar yield is not equivalent to a guaranteed local-currency gain.
Why different Treasury ETFs can move in opposite directions
Compare short Treasury bills with bonds maturing in 10 or more years. When yields rise, the longer bond’s existing fixed payments become less attractive, and its market price generally declines more because its cash flows are further in the future. This sensitivity is measured by duration, a useful—but approximate—way to compare rate risk.
A fund holding nearly maturing bills repeatedly reinvests at new yields, so changes in short rates can affect future income relatively quickly. A long Treasury fund can experience substantial price moves before the income change becomes visible. This is why an investor discussing “bond yields” should specify maturity and exposure rather than treating all fixed-income products as interchangeable.
The 2026 inflation question behind higher yields
Inflation changes the value of fixed payments in the future. Investors demand compensation when they think price growth will remain elevated or volatile. Energy shocks can reinforce this concern because higher diesel, shipping and manufacturing costs may work through supply chains. Yet not every energy-price move becomes a lasting increase in core inflation; monetary policy depends on broader evidence and expectations.
A September Fed projection showed its participants anticipating inflation remaining above target in the near term. Federal Reserve projections. Readers should not interpret that as an assurance of more rate increases. The future policy path depends on economic developments and FOMC decisions. Market-implied odds, if used, require a verified source and a timestamp.
Why stock investors care about the yield curve
When safer government securities offer competitive yields, investors may require greater potential returns to justify risky assets. Higher discount rates also reduce the present value of distant projected corporate profits. Those effects can be especially relevant for high-growth businesses whose market valuations depend on results many years away. Companies that refinance debt frequently can also feel direct interest expense pressure.
The relationship is not perfectly mechanical. Stocks may rise alongside Treasury yields when both are reacting to stronger expected growth. A central bank may tighten because corporate activity is resilient rather than because the economy is on the verge of recession. To interpret the market, ask whether the yield move reflects optimism about growth, inflation anxiety, government borrowing or a genuine change in policy expectations.
What to monitor in the coming weeks
Watch the next inflation reports, FOMC communications, Treasury auctions, 2-year and 10-year yields, investment-grade credit spreads and market pricing of future policy moves. Pair those signals with earnings releases, business investment and labor-market data. One factor can offset another: stronger earnings may cushion stocks against higher yields, while slowing sales and rising borrowing costs together can create more serious stress.
Readers should also check short-term fund yields directly with issuers because SGOV’s distribution profile can change without the fund’s ticker changing. Avoid stale “best cash yield” headlines. A product’s risk, liquidity, expenses and tax characteristics matter as much as a single yield snapshot.
The central takeaway
The Fed’s September hike and the elevated 10-year yield show that the cost of money remains a defining market issue in October 2026. SGOV illustrates why short-term Treasury products attract attention when yields are meaningful, but the fund cannot reveal a guaranteed future Fed decision. The sound approach is to distinguish policy rates, market yields and investment-product mechanics—then update each using its own official data source.
Frequently asked questions
What is the Fed’s target range in October 2026?
Following the September 16 decision, the target range was 3.75%–4.00% as of this article’s reporting cutoff.
Is the 10-year Treasury yield the Fed rate?
No. The 10-year yield is determined in bond markets and reflects several expectations beyond current policy.
Does SGOV have a fixed guaranteed yield?
No. Its published 30-day SEC yield is a dated standardized measure, not a guarantee of future distributions.
Why do long-term Treasury bonds fall when yields rise?
Existing fixed coupons become less attractive relative to newer higher-yielding securities, so market prices typically decline.
Discover more from The Economy
Subscribe to get the latest posts sent to your email.

For US homebuyers, the mortgage question in 2026 is about more than the direction of the next interest-rate announcement. The practical issue is whether the full cost of a home fits a household’s finances without depending on an uncertain future refinance.
Freddie Mac’s Primary Mortgage Market Survey reported a 7.40% average for a 30-year fixed mortgage on 8 October 2026, compared with 7.28% a week earlier. The 15-year average was 6.73%. These are weekly market benchmarks, not offers available to every applicant. Actual pricing depends on the borrower, property, loan structure and lender.
Earlier forecasts can now look optimistic because they were produced under different conditions. The right response is to compare current evidence with current costs, rather than assume that a predicted decline must eventually arrive on schedule.
Why the Federal Reserve does not set your mortgage rate
The Federal Reserve influences short-term financial conditions, but a long-term fixed mortgage is priced through a broader market. Investors consider expected inflation, future interest rates and the return available from other securities. Lenders also account for operating costs and the characteristics of the loan.
Mortgage rates can therefore move before a central bank announcement. If investors expect a decision, its likely effect may already be reflected in prices. Rates can even rise after an announcement that appears supportive if the accompanying outlook is less reassuring than expected.
Long-term bond yields are useful context, but they are not a complete mortgage calculator. The spread between those yields and mortgage pricing also changes. A borrower should avoid treating one Treasury-market headline as a precise prediction of the next lender quotation.
A forecast is different from an affordable offer
A national rate forecast can help explain the direction of market expectations. It cannot determine an individual applicant’s approved rate. Credit history, down payment, loan size, occupancy and other factors influence the quote.
Comparisons also become misleading when products differ. A low advertised rate may require upfront points. A shorter term may carry a lower rate but a much higher monthly payment. A variable-rate product may begin attractively while exposing the borrower to later changes.
The Consumer Financial Protection Bureau’s homebuying resources provide a useful starting point for understanding the borrowing process and comparing mortgage documents. For a real decision, written terms from lenders matter more than a promotional headline or a general market prediction.
What a one-percentage-point difference means
Consider an illustrative $300,000 loan repaid over 30 years at a fixed rate. At 6%, monthly principal and interest would be approximately $1,799. At 7%, the payment would be about $1,996. At 8%, it would be around $2,201.
These figures are calculated examples, not lender quotes. They exclude property taxes, insurance, mortgage insurance, homeowners’ association charges and maintenance. They nevertheless show why apparently small changes in rates matter to household cash flow.
The comparison also demonstrates the danger of shopping only by house price. Two buyers purchasing the same property at different rates can face substantially different monthly obligations. Conversely, a price reduction may offset part of a rate increase. The useful unit of comparison is the complete payment and cash requirement, not either variable in isolation.
The monthly payment is only the beginning
Ownership creates expenses that a principal-and-interest calculator does not capture. Taxes and insurance can change over time. Repairs arrive irregularly. A roof replacement or plumbing problem may not respect the timing of a household’s savings plan.
Closing costs also affect affordability. A borrower who uses nearly all available cash for the purchase may have a manageable scheduled payment but little room for disruption. That distinction matters when employment or other income is uncertain.
A practical budget should separate predictable monthly expenses from reserves for less frequent costs. It should also include the costs of moving and setting up the home. Furniture, utilities and immediate repairs are easy to overlook because they occur outside the mortgage contract, yet they can materially change the first year’s financial experience.
How to compare points and fees
Mortgage points involve paying an upfront amount in exchange for a particular rate arrangement. Whether that trade makes sense depends on the exact offer and how long the borrower expects to keep the loan.
Suppose two otherwise comparable offers differ by $3,000 in upfront cost and $75 in monthly principal and interest. A simple cash-flow comparison produces a 40-month break-even period. That is only an illustration: a full comparison would consider other fees, balances, tax treatment where relevant and the time value of money.
The main lesson is to connect upfront charges with the intended holding period. Someone expecting to sell or refinance soon faces a different calculation from someone planning to keep the same mortgage for many years. A lower rate is not automatically the least expensive overall offer.
Rate locks reduce one uncertainty
A rate lock can protect specified pricing for a defined period, subject to the agreement’s conditions. The details matter: expiry dates, extension charges and changes to the application can affect the result.
The Wall Street Journal’s recent reporting on rate locks describes borrowers seeking more protection as rates rise. That does not establish that the longest available lock is best for every buyer. Its value depends on the expected closing timeline and cost.
Before choosing, ask what happens if the purchase is delayed, whether any float-down feature exists, and which changes could alter the quoted terms. A clear written explanation is more useful than a verbal assurance that the rate is protected. Locking a rate also does not remove the need to complete underwriting and satisfy other conditions.
Refinancing later is an option, not a guarantee
The idea of buying now and refinancing after rates fall can be appealing. It remains conditional on several things: market rates must become attractive, the borrower must qualify, the property must meet relevant requirements, and the savings must justify the costs.
Income, credit history and home value can change. A lower national rate does not ensure an individual borrower will receive an economical offer. Refinancing can also extend the repayment period, reducing the monthly payment while changing the total interest paid over time.
A stronger affordability test asks whether the initial loan works if refinancing never becomes attractive. Potential future savings can then be treated as an additional benefit rather than the assumption holding the purchase together. This is particularly important for households already stretching their monthly budget.
Buying versus waiting requires more than a rate prediction
Waiting has possible benefits and costs. It may allow more savings, improved credit or a clearer employment outlook. It also means continuing to pay rent and accepting uncertainty about future home prices, supply and borrowing costs.
Buying has its own trade-offs. It can provide stability for someone planning a long stay, but it reduces flexibility and creates transaction costs if plans change. A purchase motivated primarily by fear of missing out may not fit the household’s actual needs.
Compare realistic scenarios rather than one ideal outcome. What if rates remain near current levels? What if the desired home becomes cheaper but financing becomes more expensive? What if a job change requires relocation? A decision that remains workable across several plausible outcomes is less dependent on successful market timing.
What to watch next
The most relevant indicators include inflation data, long-term bond yields, credit conditions and lender competition. Housing supply also matters: lower mortgage rates would not automatically make homes affordable if prices rose enough to offset the financing improvement.
Update comparisons using the same loan amount, term, lock period and fee assumptions. Record the date of each quote because market conditions can change quickly. If one offer appears dramatically cheaper, identify the reason before treating it as an equivalent product.
Mortgage rates in 2026 remain a major affordability constraint, but forecasting them is only part of the decision. The more dependable approach is to compare complete offers, protect a realistic cash reserve and purchase only within a budget that works under the loan’s actual terms. The calculations here are educational examples rather than personalised mortgage advice.
Discover more from The Economy
Subscribe to get the latest posts sent to your email.
Mortgage rates near 7% change the refinance math. Learn how to calculate your break-even point, weigh closing costs, and decide if refinancing still pays.
Key Takeaways
- Freddie Mac’s weekly average for a 30-year fixed mortgage reached 7.28% for the week ending October 1, 2026, up from 6.00% in early March.
- Refinancing pays off only when monthly savings recover closing costs within the years you plan to stay in the home.
- Use this formula: total closing costs ÷ monthly savings = months to break even.
- Closing costs commonly run 2% to 6% of the loan amount, so a $300,000 refinance could cost $6,000 to $18,000.
- A lower rate is not automatically a better deal. Term length, cash-out amounts, and how long you stay all change the answer.
Search Intent Summary
Most people searching for refinancing want to answer one question: “Will refinancing save me money, and when?” This guide gives you the calculation, the current rate context, and the questions to ask before you sign.
Where Mortgage Rates Stand Right Now
The rate environment has shifted sharply in 2026. Freddie Mac’s Primary Mortgage Market Survey, which averages rates for well-qualified borrowers on conventional loans, showed the 30-year fixed at 6.00% in early March. By September, rates had moved above 6.7%, and the survey put the 30-year at 7.28% for the week ending October 1.
That matters because many homeowners who refinanced in 2020 or 2021 locked in rates well below 4%. Those borrowers have little reason to refinance today. Others who bought in 2024 or 2025 may have hoped for a drop that has not arrived.
Rates set weekly averages, but your offer depends on your credit score, loan-to-value ratio, and loan type. Freddie Mac’s survey describes a strong borrower profile, so your actual quote may differ. The Federal Reserve Economic Data (FRED) series for the 30-year rate is useful if you want to track the long-run trend yourself.
Calculating Whether Refinancing Makes Sense
The core calculation is simple, and most lenders will give you the inputs.
Step 1: Add up your closing costs. These include lender origination fees, appraisal, title insurance, recording fees, and sometimes prepaid interest and escrow deposits. The Consumer Financial Protection Bureau’s Loan Estimate form lists each charge, and you should compare these forms from at least three lenders.
Step 2: Find your monthly savings. Subtract your new principal-and-interest payment from your current one. Don’t count changes to taxes or insurance, since those would apply either way.
Step 3: Divide. Closing costs divided by monthly savings gives your break-even point in months.
Here is a hypothetical example. Suppose your closing costs are $6,000 and your new payment is $250 lower each month. Dividing gives 24 months. If you plan to stay for ten years, you keep roughly $24,000 in savings beyond the break-even point, minus any interest you pay on a new loan term.
Now consider the reverse. If you expect to sell in two years, that same refinance produces almost no net benefit.
The Hidden Variables Most Guides Skip
Many refinance decisions go wrong because the monthly payment is the only number people compare. Several other factors matter.
Restarting the clock. If you were 8 years into a 30-year loan and refinance into another 30-year loan, you lower the payment but add years of interest. Shortening the term to 15 or 20 years can raise the payment while cutting total interest sharply. Choose the term based on your total cost, not just the monthly figure.
Rolling costs into the loan. No-closing-cost refinances are not free. The lender either charges a higher rate or adds fees to your balance. Adding fees to principal raises the amount you owe and pushes your break-even point later. Compare the two options side by side.
Cash-out refinancing. Taking equity out in cash raises your balance and usually your rate. The money may be useful for home improvements, but it turns a rate decision into a debt decision. Be honest about what the cash will fund.
Your time horizon. A refinance that takes four or five years to break even can still be a good move if you expect to stay for a decade. The Georgia state housing team’s refinancing guidance puts it plainly: you need to recover costs while you still own the home.
Comparing Your Options
| Scenario | Closing Costs | Monthly Savings | Break-Even | Works If You Plan To Stay |
|---|---|---|---|---|
| Rate-and-term, same term | $6,000 | $250 | 24 months | 2+ years |
| Shorter term (30 to 15 years) | $6,000 | $0 to -$100 | Not a savings play | Stays cheaper overall |
| No-closing-cost refi | $0 upfront | $250 | Depends on rate increase | Under 3 years |
| Cash-out | $6,000 | Varies | Often not a savings play | Only if cash has clear value |
The table shows why one number never settles the question. A shorter-term refinance can raise the monthly payment while still saving thousands in interest.
Practical Strategy Before You Apply
Start by pulling your current loan statement and checking the interest rate, remaining balance, and remaining term. Then request Loan Estimates from at least three lenders on the same day. Quotes that arrive on different days can differ because rates move daily.
Ask each lender for the exact closing cost total and the rate for each term option. Run the break-even math on each one. If the difference between offers is small, the lender’s service and speed matter more.
Check your credit before you apply. A higher score can lower your rate enough to change the break-even point. Pay down revolving balances if you can do so cheaply, and avoid opening new credit lines during the process.
Watch the Thursday Freddie Mac release, but treat it as a trend signal rather than a quote. Your lender’s daily rate is what you can lock.
Future Outlook
Nobody can reliably predict where rates go next. The Federal Reserve’s decisions, Treasury yields, and inflation data all feed into mortgage pricing. Waiting for a drop has a cost too, because a delayed refinance means fewer months of savings. The better question is whether the numbers work at today’s rate for the years you plan to stay.
Frequently Asked Questions
Is it worth refinancing when rates are above 7%?
It depends on your current rate. If your existing loan is at 6% or above, a refinance at today’s rates usually won’t save money. If your current rate is well above the market, run the break-even calculation before deciding. Staying in your home for a long time can still make a higher-rate refinance worthwhile, but only if the savings justify it.
How much do refinancing closing costs usually run?
Expect roughly 2% to 6% of your loan amount, according to Bankrate’s refinancing guide. On a $300,000 loan, that works out to about $6,000 to $18,000. Lenders vary, and some fees can be negotiated.
How do I calculate my refinance break-even point?
Divide your total closing costs by your monthly payment savings. For example, $6,000 in costs and $250 in monthly savings gives a 24-month break-even point. If you plan to move before that date, refinancing may cost you money.
Should I choose a shorter loan term when refinancing?
A shorter term usually reduces total interest but raises the monthly payment. It fits best if you can afford the higher payment without strain. A longer term lowers the monthly payment but increases the lifetime interest you pay, so compare total costs, not just the monthly figure.
Discover more from The Economy
Subscribe to get the latest posts sent to your email.

Q3 2026 Earnings Preview: Can Record Profit Expectations Keep Wall Street’s Rally Alive?

Russia Diesel Deal 2026: Oil Prices and Inflation Risks

Fed Rates 2026: Treasury Yields, Bonds and SGOV Explained

S&P 500 Market Breadth 2026: Weak Rally or Rotation?

The AI Capex Boom: Data Centers Reshaping Growth

Palantir Stock in 2026: Extraordinary AI Growth

Tesla Physical AI 2026: Robotaxis, Optimus and TSLA Risks

NVIDIA’s AI Grip in 2026: Record Revenue Is Only Half the Investment Story

Hormuz Diesel Shortage: Why Crude Oil Recovery Isn’t Enough

Social Security Extra $90 Deposit: Who Qualifies for the October 2026 Medicare Rebate?

Anthropic Bans Sustained Abuse of Claude AI Under New Usage Policy Effective November 12, 2026

Jeff Bezos Three-Day Workweek View: What He Really Said

Celeste Frozen Pizza Discontinued: What Conagra Confirmed

US–China Critical Minerals Competition: Why a Trade Deal Cannot Fix Every Supply Risk

Oil Prices Break $100 in 2026: Middle East Conflict & Energy Markets

Middle East War Economics 2026: Oil Prices & Energy Markets

China Stocks Today: Are Big Economies in Asia Nearing a Market Bottom?

PSX Forecast 2026: KSE-100, IMF Reviews & Geopolitics

Crypto Daily Outlook: Bitcoin, Altcoins, and the Future of Decentralized Finance

Global Pension Systems Ranked: The World’s Best and Worst Retirement Frameworks

World’s Largest Economies: Ranking the Top Global Powers

Elon Musk’s Next Moves: Disrupting the 2026 Global Economy

Pakistan Economy 2026: Inside the SBP’s Balancing Act

GasBuddy Market Insights: How Crude Price Shifts Impact Local Fuel Cost Averages

World Bank & IMF Reports 2026: Why the “3% Growth” Consensus Is Actually a Debate

Global Equity Market Divergence: US Tech vs. European Dividend Stocks vs. Asian Growth

IMF & World Bank Global Economic Outlook: Growth Forecasts Across Europe and Asia

Stock Market Today: Dow Climbs 500 Points as Markets Shake Off Inflation Jitters
-

 Markets & Finance9 months ago
Top 15 Stocks for Investment in 2026 in PSX: Your Complete Guide to Pakistan’s Best Investment Opportunities
-

 Analysis8 months ago
Johor’s Investment Boom: The Hidden Costs Behind Malaysia’s Most Ambitious Economic Surge
-

 Analysis8 months ago
Top 10 Stocks for Investment in PSX for Quick Returns in 2026
-

 Banks9 months ago
Best Investments in Pakistan 2026: Top 10 Low-Price Shares and Long-Term Picks for the PSX
-

 Analysis8 months ago
Brazil’s Rare Earth Race: US, EU, and China Compete for Critical Minerals as Tensions Rise
-

 Investment9 months ago
Top 10 Mutual Fund Managers in Pakistan for Investment in 2026: A Comprehensive Guide for Optimal Returns
-

 Global Economy10 months ago
15 Most Lucrative Sectors for Investment in Pakistan: A 2025 Data-Driven Analysis
-

 Global Economy10 months ago
Pakistan’s Export Goldmine: 10 Game-Changing Markets Where Pakistani Businesses Are Winning Big in 2025