
Analysis
Oil Prices Sink on Signs of U.S.-Iran Deal

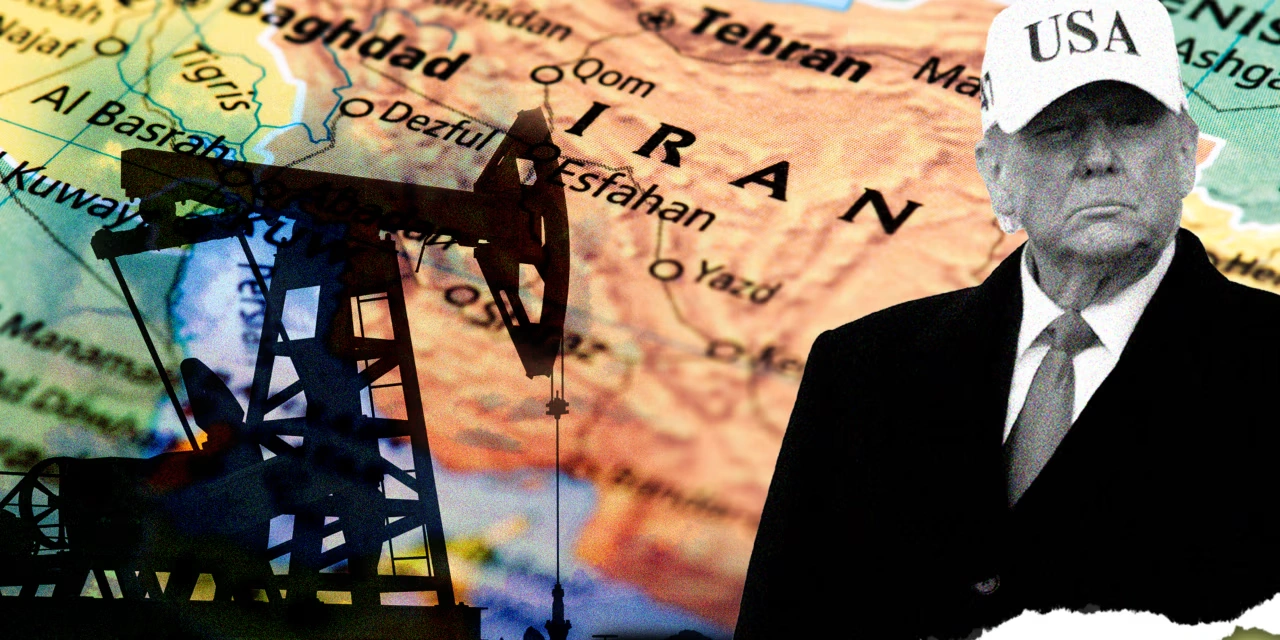
Brent crude fell more than five percent on Sunday to below $99 a barrel — its steepest single-session drop in weeks — as U.S. officials confirmed that a framework agreement with Iran is, in their words, “95% there.” The move came after three months of brutal market turbulence triggered by the February 28 conflict between the U.S., Israel, and Iran that effectively shuttered the Strait of Hormuz, the world’s most consequential oil chokepoint. Markets are pricing in what was, until recently, unthinkable: a diplomatic endgame. Yet the final five percent may prove the hardest stretch of all.
The world’s oil supply chain has not faced a shock of this magnitude since the 1973 Arab embargo. Cumulative supply losses from Gulf producers have already exceeded one billion barrels since the conflict began, with more than 14 million barrels per day effectively shut in — an unprecedented disruption — though the supply-demand gap has remained smaller than feared because the market was already in surplus heading into the crisis, and producers including Saudi Arabia and the UAE have successfully redirected some exports to terminals loading outside the Strait. IEA
About 20% of all global oil supplies transit the Strait of Hormuz, which has remained effectively closed to normal oil flows since the war began on February 28. The diplomatic window now opening is therefore not merely a headline event. It is a structural turning point for energy markets, inflation trajectories, and the fiscal arithmetic of governments from Tokyo to Nairobi. CNN
1 — The Core Development: A Deal Takes Shape, Tentatively
Oil prices drop sharply as U.S.-Iran peace framework nears completion
The proximate cause of Sunday’s selloff was a series of disclosures by senior Trump administration officials confirming that a memorandum of understanding with Iran was within striking distance. A senior official confirmed a “No Dust, No Dollars” policy was guiding the negotiations, adding that Iran had “agreed in principle to the framework, and we are 95% there.” The same official said the U.S. had reached agreement on the nuclear stockpile and the Strait of Hormuz, but that negotiators were still haggling over specific language — a process that could take another five to seven days. Fox News
Global crude benchmark Brent fell as much as 5.2% to $98.12 a barrel, while West Texas Intermediate was near $92. Trump said in social-media posts he wouldn’t “rush” into a deal, which “isn’t even fully negotiated yet,” and that any final approval may take several days according to senior U.S. officials. Fortune
The figure that should stop energy traders cold is this: North Sea Dated has swung from a high of $144 per barrel to below $100 before rebounding, with prices around $110 at the time of the IEA’s May report — a range of volatility that has no modern peacetime precedent. Sunday’s move pushed Brent back toward the lower end of that corridor. IEA
Iran’s posture has been characteristically contradictory. Iranian President Masoud Pezeshkian insisted publicly that Tehran is “not seeking nuclear weapons,” while Secretary of State Marco Rubio reiterated that preventing Tehran from ever obtaining a nuclear weapon remains Washington’s primary objective. Meanwhile, Iran’s Tasnim news agency said the draft agreement could still collapse because the U.S. was obstructing key clauses — including a demand that Tehran’s frozen assets be unfrozen. Fox NewsFortune
The market, it seems, is choosing to hear the hopeful signal and discount the noise. That is a bet.
2 — Analytical Layer: Why the “5%” Gap Is the Whole Story
What happens to crude oil if the Strait of Hormuz reopens?
Diplomatic frameworks are not oil supply. The distinction matters enormously. Even assuming a ceasefire is signed this week, the physical reopening of the Strait — the de-mining, the insurance re-underwriting, the resumption of tanker scheduling — will take weeks, not days. Yet energy markets trade on expectation, and Sunday’s move reflects a forward-pricing of relief that may arrive unevenly and incompletely.
What would a U.S.-Iran deal mean for global oil prices?
A full reopening of the Strait of Hormuz would likely push Brent below $90 a barrel within weeks, given the surplus conditions that preceded the conflict. The IEA noted that the current supply-demand gap is significantly smaller than the raw disruption numbers suggest, because producers and consumers have adapted — but the war-risk premium embedded in prices remains substantial, and it would deflate rapidly once tanker traffic normalizes.
The five percent of the deal still unresolved is not bureaucratic fine print. It covers two of the most loaded issues in modern geopolitics: Iran’s enriched uranium stockpile, and who controls transit through Hormuz. The U.S. side said it may be willing to make “significant accommodations” on sanctions relief if Iran makes equivalent concessions on enriched uranium, but also confirmed that Tehran’s system “does not move fast enough” to finalise anything within 24 hours. Fox News
Trump’s public messaging has been characteristically bifurcated. He has signalled openness while simultaneously leaving military options visible on the table — a pressure tactic that has compressed the negotiating timeline but also injected the kind of uncertainty that keeps traders nervous. Prices tumbled earlier this week after Trump called off imminent strikes on Iran to allow more negotiations, with Brent losing more than 5% on the week and WTI shedding more than 8%. CNBC
Still, the direction of travel is unmistakable. What remains unclear is the speed.
3 — Implications & Second-Order Effects
Energy markets, inflation, and the downstream consequences of a Hormuz reopening
The most immediate beneficiaries of lower crude would be consumers in oil-importing economies who have spent three months absorbing a supply shock transmitted through petrol prices, airline tickets, freight costs, and heating bills. Since the war started, wholesale gas prices have surged more than 50% for consumers, with the nationwide U.S. average approaching $4.54 per gallon — within 50 cents of its all-time high. A deal that restores Hormuz flows would not reverse those increases overnight, but it would halt the upward spiral and give central banks room to reassess. NBC News
For OPEC+ members, the calculus is more complex. Saudi Arabia and the UAE have both lost revenue from Hormuz restrictions and gained it from higher prices. A return to $80-per-barrel oil would benefit consumers globally but squeeze the fiscal arithmetic of Gulf states that built their 2026 budgets around triple-digit crude. Riyadh’s break-even price — the oil level required to balance its national budget — sits above $80 per barrel by most estimates, meaning any sharp reversion in prices would force difficult spending choices.
The second-order effects extend well beyond energy. Myanmar, for example, imports 90% of its fuel and fertilizer through Hormuz-dependent supply chains, and the disruption has sent input costs for farmers soaring. In sub-Saharan Africa, nations that were already running primary deficits before the conflict have seen their import bills balloon. If the deal holds, the relief for frontier-market economies could be disproportionately large relative to the price move itself. CNN
Bond markets have also responded. Government bond yields dropped toward their lowest levels of recent weeks as the ceasefire signals intensified — a signal that investors are betting that lower energy costs will ease inflation expectations and, in turn, reduce pressure on central banks to maintain restrictive monetary policy.
4 — Competing Perspectives: Why Sceptics Aren’t Convinced
The market’s relief trade is understandable. It may also be premature.
Iran’s state media has repeatedly signalled that the gap between a framework and a finalised agreement is wider than U.S. officials acknowledge. Iran’s Tasnim news agency specifically warned that the draft agreement could collapse because the U.S. was obstructing key clauses, including demands around unfreezing Iranian assets. This is not merely negotiating bluster. Tehran’s internal politics are fractured: hardliners who view nuclear enrichment as a sovereignty issue are not simply going to defer to a president who says the country isn’t seeking a bomb. Fortune
The precedent from the 2015 Joint Comprehensive Plan of Action (JCPOA) is instructive and sobering. That agreement took years to negotiate and was unilaterally abandoned by the Trump administration in 2018 — a historical fact that Iranian negotiators have not forgotten and are almost certainly factoring into their demands for more durable legal guarantees. The administration’s “No Dust, No Dollars” framing gives Washington rhetorical clarity but leaves little room for the face-saving ambiguity that successful diplomatic settlements typically require.
There is also a military dimension that markets are currently discounting. Iran’s Al-Fiqar military group threatened that if the enemy attacks the Strait of Hormuz, Tehran would “break the naval blockade and may withdraw from the Non-Proliferation of Nuclear Weapons treaty” — a threat that, if executed, would represent a categorical escalation with no obvious off-ramp. Fox News
John Evans, analyst at PVM Oil, captured the fragility of the current price move when he observed earlier this month that “the crude build in the EIA Inventory Report has chased down the prices, and the move is accelerated by what appears to be a cooling of animosity in the US/Iran nuclear negotiations.” Cooling, not resolution. The markets are trading the cooling. The resolution is still being written.
CLOSING
Three months of war, a billion barrels of lost supply, and an oil price that at one point touched $144 a barrel — the scale of the disruption the Hormuz closure has inflicted on the global economy is only now being tallied. A diplomatic framework that is “95% complete” is not a ceasefire. It is an aspiration with a deadline and a hundred unresolved clauses. The remaining five percent contains all the intractable questions: how much enriched uranium Iran gets to keep, who governs the Strait it spent three months closing, and whether any agreement reached under duress can survive the political pressures on both sides.
Energy markets will continue to front-run each diplomatic signal — that is their nature. But investors, policymakers, and the consumers quietly paying $4.50 for a gallon of petrol deserve a reminder that in Middle East diplomacy, the hardest percentage is always the last.
Discover more from The Economy
Subscribe to get the latest posts sent to your email.



Key Takeaways
- Rolex’s secondary market rose approximately 7.9% year-over-year as of 2026 (per WatchCharts data) — trailing Patek Philippe (+16.2%) and Tudor (+11.4%) but still outperforming Audemars Piguet (+3.4%).
- Rolex raised U.S. retail prices 4–9% in January 2026 (steel models ~5.6%, gold models ~8.7%), narrowing the historical gap between retail and pre-owned pricing.
- Not every model appreciates: steel sports references (Submariner, GMT-Master II, Daytona) have held value far better than two-tone or widely available dress references like the standard Datejust.
- The Lady-Datejust posted the sharpest 2026 gain among tracked collections — up 22.73%, from roughly $9,269 to $11,376 — driven by demand for smaller, “everyday luxury” watches.
- Gold’s rise past $2,400/oz has directly lifted the investment case for Rolex’s precious-metal references (Day-Date, Sky-Dweller, Yacht-Master).
The Model-by-Model Picture
| Category | 2026 Trend |
|---|---|
| Lady-Datejust | +22.73% (strongest performer among tracked collections) |
| Steel sports models (Submariner, GMT-Master II) | Held value well; corrected from 2022 peak but stabilized above retail |
| Daytona | Corrected from highs above $50,000 to the mid-$30,000s; still among the most sought-after references |
| Two-tone/widely available Datejust | Flat to negative — “holds value” is an overstatement for this category |
| Gold references (Day-Date, Sky-Dweller) | Lifted by gold’s rise above $2,400/oz |
Why the “Rolex Always Appreciates” Myth Is Fading
The pandemic-era boom pushed some references — the Daytona above all — to speculative highs disconnected from historical norms. Since the March 2022 peak, steel sports models have compressed meaningfully, and dealers who bought inventory near the top have in some cases faced 20–40% markdowns on liquidation. The lesson for 2026 buyers: Rolex as a category is not a monolith. Value retention depends heavily on specific reference, condition, and whether the piece comes with box and papers (“full set”).
What’s Actually Driving 2026 Strength
- Retail price increases raise the floor. When a new Submariner retails at $10,050 (up from $9,500), a pre-owned example at $11,000–$12,000 suddenly represents a smaller premium — narrowing the gap without secondary prices actually moving.
- Supply discipline remains Rolex’s core lever. The brand has never confirmed production numbers, and secondary-market premiums remain entirely a function of Rolex’s own manufacturing decisions — a risk factor as much as a support.
- Certified Pre-Owned rollout. Rolex’s now fully rolled-out CPO program has changed how buyers transact in the used market, adding a layer of brand-verified legitimacy that supports pricing.
The Case for Rolex as a Portfolio Diversifier
Financial advisors increasingly frame luxury watches not as a replacement for equities or bonds, but as a tangible, historically low-correlation diversifier — one that carries its own risks (illiquidity, condition-dependent pricing, no yield) but has demonstrated multi-decade resilience for specific references.
Is Rolex a good investment in 2026?
It depends heavily on the specific reference. Steel sports models like the Submariner and Daytona have held or grown in value; two-tone and widely available dress models generally have not. Overall, Rolex’s secondary market rose about 7.9% year-over-year in 2026, trailing Patek Philippe but ahead of Audemars Piguet.
Discover more from The Economy
Subscribe to get the latest posts sent to your email.

Navigating Mortgage and Loan Refinancing in a High-Yield Environment
Global public debt crossing critical thresholds has kept central bank policies volatile, resulting in fluctuating US Treasury yields throughout 2026. For homeowners and commercial property holders burdened by previous high-interest borrowing cycles, finding optimal refinance windows has become a high-stakes financial puzzle. Stalled disinflation and stubborn employment numbers mean rate cuts are incremental, requiring borrowers to act with precision.
Timing your mortgage or commercial loan refinance in this environment requires a deep understanding of yield curve movements and lender risk appetites.
Decoding 2026 Refinance Dynamics
The 10-Year Treasury Yield Benchmark
Mortgage rates continue to track closely with the 10-year US Treasury yield. When macroeconomic anxiety spikes debt issuance, yields rise, tightening consumer borrowing capacity. Savvy borrowers monitor weekly Treasury auctions to lock in rates during brief dip windows.
Hybrid ARMs and Alternative Structures
With fixed rates remaining elevated, 7/1 and 10/1 adjustable-rate mortgages (ARMs) have surged in popularity. These products offer lower initial monthly payments, giving borrowers breathing room until central bank easing cycles fully materialize.
| Loan Product | Current Rate Range | Best For | Key Risk Factor |
| 30-Year Fixed Mortgage | 6.2% – 6.8% | Long-term predictability | Higher initial monthly outlay |
| 7/1 Hybrid ARM | 5.5% – 5.9% | Short-term ownership / flipping | Rate reset risk after year 7 |
| Commercial Refinance | 7.0% – 8.2% | Corporate asset restructuring | Strict DSCR lender covenants |
Actionable Steps for Successful Refinancing
To maximize your chances of securing favorable refinance terms in a volatile market, follow a disciplined preparation strategy.
Boost Your Credit Score Immediately: Lenders in 2026 are applying stringent credit tiering; a 20-point increase can drop your APR by a crucial quarter-point.
Shop Regional Credit Unions: Smaller financial institutions often offer portfolio loans with more flexible underwriting than major national banks.
Calculate the Break-Even Point: Ensure your total closing costs are recouped through monthly savings within 24 months of closing.
“Market Strategist View: Refinancing in 2026 is an exercise in opportunistic timing. Borrowers must maintain immaculate financial profiles ready to strike the moment Treasury yields dip.”
Mastering the complexities of today’s debt environment ensures you can successfully lower your debt service costs and protect your long-term financial stability.
Discover more from The Economy
Subscribe to get the latest posts sent to your email.

The days of pulling generic auto insurance quotes based purely on your zip code and age are officially over. In 2026, insurance comparison engines are powered entirely by generative AI and real-time telematics. These platforms digest thousands of live data points—ranging from your driving smoothness via connected vehicle sensors to real-time traffic congestion patterns—to generate hyper-personalized premiums instantly.
For consumers, this evolution represents both a massive opportunity for savings and a hidden trap for penalty pricing. Understanding how AI algorithms evaluate risk is essential for anyone looking to lower their monthly auto insurance premiums.
How AI Comparison Engines Evaluate Your Risk Profile
Behavioral Telematics and Connected Cars
Modern cars stream performance data directly to insurance aggregators. Generative AI models analyze braking sharpness, acceleration curves, cornering G-forces, and phone distraction metrics. Drivers who maintain smooth, defensive habits are rewarded with dynamic rate cuts of up to 40% compared to traditional rating tiers.
Predictive Traffic and Weather Modeling
AI tools now cross-reference your daily commute route with predictive weather and accident probability models. If your standard parking location or driving corridor has a statistically higher incidence of uninsured motorist claims, your quotes will reflect that hyper-local risk assessment.
| Comparison Factor | Traditional Rating Model | 2026 Generative AI Model | Impact on Premium |
| Mileage & Usage | Annual estimated odometer reading | GPS tracking & live trip duration | High (up to 35% savings) |
| Driving Behavior | MVR driving record & accidents | Real-time braking, speed, & G-force | Critical (determines tier) |
| Vehicle Tech | Make, model, and safety rating | ADAS calibration & repair cost data | Moderate |
Strategies to Lower Your AI-Driven Insurance Quote
To outsmart the algorithm and secure the lowest possible premium in 2026, drivers must proactively manage their digital footprint on insurance platforms.
Opt-In for Telematics Trial Periods: Many insurers offer immediate 15% discounts just for installing their driving app; let it track safe habits for 30 days to lock in permanent savings.
Scrub Unverified Public Records: Ensure your motor vehicle report is free of clerical errors that AI risk models misinterpret as reckless behavior.
Compare AI Aggregators: Use platforms that integrate multi-carrier API feeds rather than single-brand comparison sites to find the best risk-adjusted rate.
“Industry Note: AI-driven pricing rewards transparency and precision. Drivers who actively manage their telematics data consistently out-save those relying on legacy quote calculators.”
Embracing AI comparison tools allows savvy policyholders to customize coverage limits precisely to their driving habits, eliminating wasted premium spend while ensuring robust protection.
Discover more from The Economy
Subscribe to get the latest posts sent to your email.

Oil and Diesel Prices in October 2026: How Supply Shocks Can Reach Inflation

AI Chip Demand in 2026: What TSMC, Nvidia and Data-Center Spending Reveal

Q3 2026 Earnings Season: The Bank, AI and Consumer Signals That Really Matter

Treasury Yields in 2026: Why Higher Bond Rates Matter for Stocks, Mortgages and Savings

KOSPI 2026: Why South Korean Stocks Turned Volatile and What AI Investors Should Watch

IREN Stock in 2026: AI Cloud Growth, Bitcoin Transition and the Risks Investors Miss

Stock Market Crash in 2026? Warning Signs, Scenarios and a Calm Investor Checklist

Peso Mexicano vs Dólar Estadounidense: A Practical USD/MXN Guide for October 2026

Is the Stock Market Open on Columbus Day 2026? NYSE, Nasdaq and Bonds Explained

Concert Ticket Prices in 2026: Dynamic Pricing, Fees and How to Buy Safely

High-Yield Savings Accounts in 2026: How to Compare APY Without Chasing a Headline

EU-China Trade Deal 2026: How Beijing and Brussels Avoided a Trade War—and Who Wins

Social Security 2027 COLA Announcement: Date, Formula and What Retirees Should Check

China’s AI Microdrama Boom: How Beijing Is Reshaping Global Media

China Stocks Today: Are Big Economies in Asia Nearing a Market Bottom?

World’s Largest Economies: Ranking the Top Global Powers

Global Pension Systems Ranked: The World’s Best and Worst Retirement Frameworks

Elon Musk’s Next Moves: Disrupting the 2026 Global Economy

Pakistan Economy 2026: Inside the SBP’s Balancing Act

Crude Oil & Petroleum Market Analysis: OPEC+ Decisions and Price Forecasts

GasBuddy Market Insights: How Crude Price Shifts Impact Local Fuel Cost Averages

Global Equity Market Divergence: US Tech vs. European Dividend Stocks vs. Asian Growth

IMF & World Bank Global Economic Outlook: Growth Forecasts Across Europe and Asia

Silver Price Today: Why the Xi-Trump AI Standoff Is Fueling a Safe-Haven Rally

Bitcoin Price Forecast 2026–2027: Will the 4-Year Cycle Hold?

The Future of Silicon: Supply Chain Vulnerabilities in the 2026 Tech Sector

Asian Stock Markets 2026: Japan, China, Pakistan & More

SpaceX IPO: How Aerospace Is Reshaping Tech Startup News
-

 Markets & Finance9 months ago
Top 15 Stocks for Investment in 2026 in PSX: Your Complete Guide to Pakistan’s Best Investment Opportunities
-

 Analysis8 months ago
Johor’s Investment Boom: The Hidden Costs Behind Malaysia’s Most Ambitious Economic Surge
-

 Analysis8 months ago
Top 10 Stocks for Investment in PSX for Quick Returns in 2026
-

 Banks9 months ago
Best Investments in Pakistan 2026: Top 10 Low-Price Shares and Long-Term Picks for the PSX
-

 Analysis8 months ago
Brazil’s Rare Earth Race: US, EU, and China Compete for Critical Minerals as Tensions Rise
-

 Investment9 months ago
Top 10 Mutual Fund Managers in Pakistan for Investment in 2026: A Comprehensive Guide for Optimal Returns
-

 Global Economy10 months ago
15 Most Lucrative Sectors for Investment in Pakistan: A 2025 Data-Driven Analysis
-

 Global Economy10 months ago
Pakistan’s Export Goldmine: 10 Game-Changing Markets Where Pakistani Businesses Are Winning Big in 2025