
Analysis
The Disappearing American Mortgage: A Generation Priced Out of the Dream

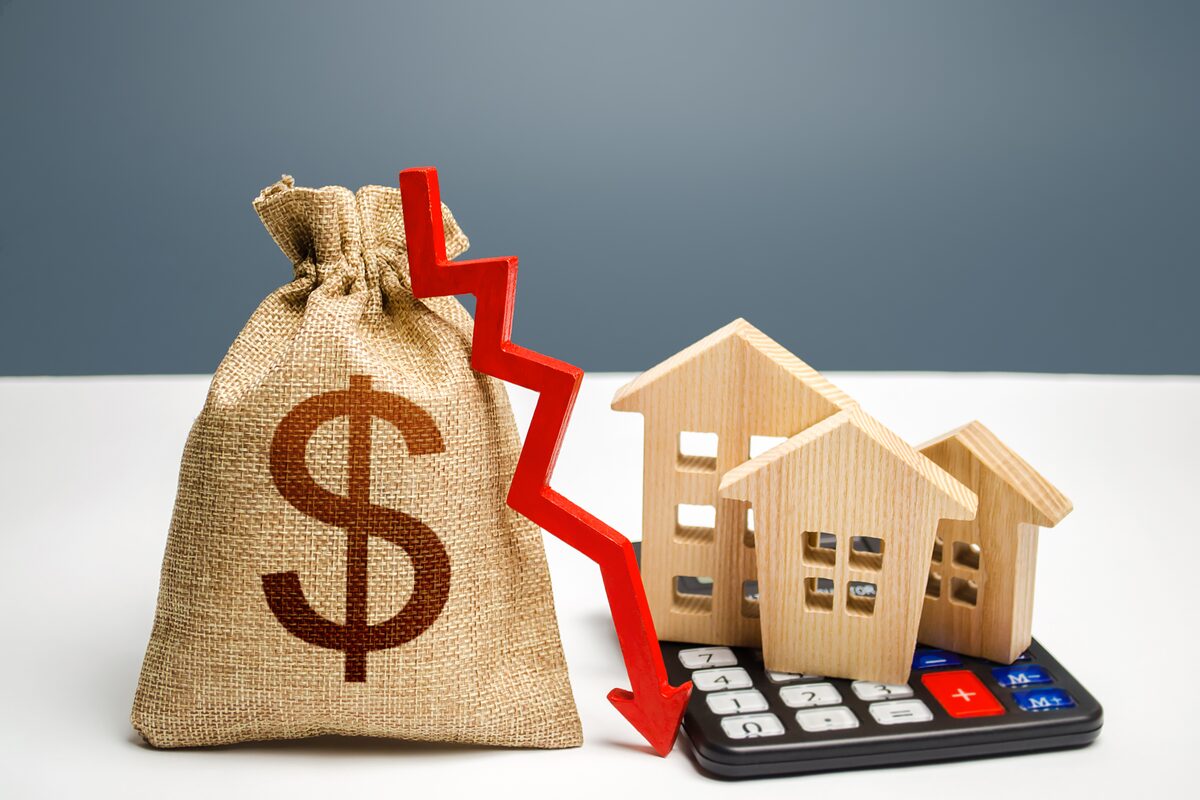
Mortgage applications hit a 25-year low as first-time buyers collapse to 21% of market share. Why young Americans face a future as perpetual renters — and what it means for the economy. “Mortgage applications hit a 25-year low. First-time buyers are a record-low 21% of the market. Why young Americans face life as perpetual renters.
The Numbers No One Wants to See
Consider what it takes to close on a home in America right now. You need a household income approaching six figures to qualify for the median-priced existing home. You need a down payment that, at the current median of 10% for first-time buyers, amounts to more than $43,000 in cash — at the highest level since 1989. You need the nerve to lock into a 30-year fixed mortgage rate of 6.43% — more than double the pandemic-era lows that millions of existing homeowners are still sitting on, quite contentedly, with no intention of surrendering. And you need the good fortune of finding something for sale in the first place.
If you’ve managed all of that, congratulations. You are, in a measurable and increasingly literal sense, one of the lucky few.
The American mortgage — that foundational instrument of middle-class wealth, the financial backbone of the postwar suburban compact — is vanishing. Not gradually, and not quietly. Data released by the Mortgage Bankers Association on March 25, 2026 showed mortgage applications tumbling another 10.5% in a single week, with the Purchase Index falling 5% week-over-week. The week prior — ending March 13 — had already seen a 10.9% collapse, the steepest single-week drop since September 2025. These aren’t blips. They are the fingerprints of a structural transformation so deep that it risks redrawing the sociological map of American wealth for a generation.
Worse Than the Great Recession — Without the Excuse
To grasp how extraordinary the current freeze is, it helps to recall what the housing market looked like during the worst economic catastrophe of living memory. In 2009 and 2010, as the subprime bubble imploded and unemployment breached 10%, mortgage originations cratered. The MBA’s Market Composite Index — which tracks total loan application volume — fell to what seemed like unthinkable lows. The housing market was broken, the country agreed, and policymakers mobilized accordingly.
Today, unemployment sits at roughly 4%. The economy has, by standard macroeconomic measures, recovered. And yet 96 of the 100 lowest readings of the MBA’s weekly mortgage application index have occurred in the past three years — a span that began not with a financial crisis but with the Federal Reserve’s campaign to tame post-pandemic inflation. The market is not broken in the way 2009 was broken. It is frozen, seized by a structural contradiction: the people who own homes have every incentive to stay put, and the people who want homes cannot afford to enter.
The MBA’s weekly Purchase Index — which isolates new home purchase applications from refinancing activity — was only 5% higher than the same week one year ago as of late March 2026, a derisory gain that barely registers against years of suppressed demand. Elevated Treasury yields, driven in part by geopolitical oil-price pressures, have kept mortgage rates stubbornly high. The 30-year conforming rate closed the week at 6.43%, with jumbo balances carrying 6.45%. The window in early 2026 when some lenders briefly offered rates approaching 6.25% — hailed breathlessly at the time as a turning point — has snapped shut.
The Rate-Lock Prison
To understand why the supply side of the housing market has frozen so completely, follow the math of the existing homeowner. The median American seller has now owned their home for a record 11 years before listing — an all-time high in data stretching back to 1981. Roughly 60% of outstanding mortgages in the United States carry rates below 4%. Trading a 3% mortgage for a 6.4% one, on a more expensive house, in a market with higher property taxes and insurance premiums, requires a powerful motivating force — a job relocation, a family expansion, a death, a divorce. For tens of millions of Americans, the math simply doesn’t pencil out, and so they stay. Their inertia is perfectly rational. Its aggregate effect is devastating.
The NAR’s 2025 Profile of Home Buyers and Sellers — a survey of transactions conducted between July 2024 and June 2025 — captures the downstream consequences with clinical precision. The typical seller age hit a record 64. The typical buyer age hit a record 59. The median age of first-time buyers climbed to an all-time high of 40 — up from the late twenties in the 1980s, and from 30 as recently as 2010. By NAR’s accounting, a decade of deferred homeownership costs a typical buyer roughly $150,000 in accumulated equity on a standard starter home. That is not a financial setback. That is a generational wealth transfer, running in reverse.
Redfin, using a different methodology that draws more directly on Federal Reserve microdata, places the first-time buyer median age at 35 in 2025 — lower than NAR’s figure, and a modest improvement from the prior year. Even at 35, the typical first-time buyer is significantly older than at any point in the postwar era, and the methodological debate between NAR and Redfin only underscores the point: by any honest accounting, Americans are buying their first homes later, under more financial duress, with lower long-term equity gains ahead of them.
The First-Time Buyer Collapse
The most alarming data point in the NAR survey is not the age figure — it is the share. First-time buyers accounted for just 21% of all home purchases over the 12-month survey period — a record low in data going back to 1981, and a figure that has been cut in half since 2007, when first-timers made up around 40% of the market. Before the Great Recession, 40% was considered the structural norm. The NAR’s deputy chief economist, Jessica Lautz, did not mince words: “The implications for the housing market are staggering. Today’s first-time buyers are building less housing wealth and will likely have fewer moves over a lifetime as a result.”
The vacuum left by absent first-time buyers has been filled, predictably, by those with the deepest pockets. Repeat buyers now constitute 79% of all home purchases, with a median age of 62 and a median down payment of 23% — the highest since 2003. Thirty percent of repeat buyers paid all cash, bypassing the mortgage market altogether. In a healthy housing ecosystem, first-time buyers feed the lower rungs of the ladder, creating demand that allows existing owners to trade up. When that base collapses, the entire market ossifies. Turnover falls. Supply dwindles. Prices, absent the corrective pressure of a functioning bottom of the market, hold or rise despite unaffordable conditions. This is not a market failure in the traditional sense. It is a market succeeding — extraordinarily well — for a narrow slice of older, already-wealthy participants, at the expense of everyone else.
Key Generational Homeownership Data (2025)
| Generation | Homeownership Rate (2025) | Boomer Rate at Same Age |
|---|---|---|
| Gen Z (ages 19–28) | 27.1% | ~40–44% |
| Millennials (ages 29–44) | 55.4% | ~60–65% |
| Gen X (ages 45–60) | 72.7% | — |
| Baby Boomers (ages 61–79) | 79.9% | — |
Sources: Redfin analysis of Census Current Population Survey, 2025; Scotsman Guide
Gen Z’s homeownership rate reached 27.1% in 2025, up marginally from 26.1% the year before. That modest gain deserves context: when Gen Xers and baby boomers were the same age, homeownership rates for 28-year-olds stood at 42.5% and 44.4%, respectively. Gen Z is tracking 15 percentage points behind its parents’ generation at the same stage of life. Meanwhile, racial gaps remain stark: the homeownership rate for Gen Z Black Americans stood at just 14.2% in Q4 2025, a figure that compounds the racial wealth gap with brutal efficiency.
Among young adults broadly, the under-35 homeownership rate rose from 36.3% to 37.9% in the fourth quarter of 2025 — a genuine uptick, but one that remains below the 25-year average, and one achieved not because the market opened up but because a fraction of younger buyers made extraordinary sacrifices to enter it. As Redfin senior economist Asad Khan noted, “Gen Zers and millennials are making small gains in homeownership because they’re eager to buy, they’re making sacrifices, and because affordability has improved a bit at the margins — not because homes suddenly became affordable.”
Even at current levels, the median household income lags nearly $25,000 behind the earnings required to purchase a median-priced home. That gap is not a rounding error. It is a structural chasm.
The Supply Catastrophe Underneath
Every discussion of housing affordability eventually circles back to supply — and the supply picture in America is not improving fast enough. Single-family housing starts averaged 943,000 units in 2025, down from 1.02 million in 2024, with MBA projecting a roughly flat 2026 at around 930,000 units. That number falls far short of the estimated 1.5 to 2 million new units economists say are required annually to close the supply deficit built up over the past decade and a half of underbuilding.
Homebuilders face a perfect storm of their own: elevated input costs, persistent labor shortages, zoning and permitting barriers that add months and hundreds of thousands of dollars to project timelines, and — critically — an elevated inventory of unsold new homes sitting at 472,000 units as of December 2025, equivalent to an 8-month supply. Builders are not inclined to break ground aggressively into a market where completed homes sit unsold. The result is a construction industry operating at a cautious pace precisely when the country needs urgency.
The rental alternative provides cold comfort. Rents have softened in some Sunbelt markets as a surge of multifamily completions finally came to market, but vacancy rates in major East Coast metros remain tight. For young Americans priced out of ownership, renting is not a temporary waystation — it is increasingly a permanent condition. Apartment List’s 2025 Millennial Homeownership Report found that nearly 25% of millennials expect to always rent — a figure that has roughly doubled since 2018. That psychological shift matters: when a generation stops believing homeownership is attainable, the political and social pressure to fix housing markets loses one of its most powerful engines.
A Global Pattern, an American Inflection
The United States is not alone in this predicament. The housing affordability crisis plaguing American millennials and Gen Z has close cousins in Canada, Australia, the United Kingdom, and across Western Europe, where a toxic combination of years of low interest rates inflating asset prices, NIMBYist planning regimes restricting supply, and demographic demand from large young cohorts has pushed homeownership rates for people under 40 to multi-decade lows. In London, Sydney, Toronto, and Auckland, the conversation about a permanently renting younger class is years further along than in Washington or New York. The political backlash — housing as a central election issue — is already transforming party platforms in the U.K. and Australia.
What distinguishes the American case is the mortgage itself. The 30-year fixed-rate mortgage, a product unique to the United States among major economies, has historically functioned as an extraordinary wealth-building tool and a form of consumption smoothing — allowing households to lock in a predictable housing cost for three decades, building equity through forced savings, and eventually owning an asset outright. The product was explicitly designed, through the government-sponsored enterprises Fannie Mae and Freddie Mac, to democratize capital access. When that instrument becomes unaffordable to the bottom half of the income distribution — and then the bottom 60%, 70% — it stops serving its designed purpose and begins functioning as a wealth-concentrating tool for those already inside the system.
What Comes Next — and What Policy Must Do
The Federal Reserve’s rate-cutting cycle, which saw three quarter-point reductions in 2025, has done remarkably little to ease mortgage rates, which respond primarily to 10-year Treasury yields rather than the fed funds rate. MBA forecasts rates averaging around 6.4% through 2026, while Fannie Mae has projected a more optimistic path toward sub-6% rates by year’s end — a divergence that reflects genuine uncertainty about the trajectory of inflation, fiscal deficits, and global capital flows. Even if rates fell to 5.5% tomorrow, the affordability math for a 28-year-old earning the median income would remain deeply challenging. Rate relief alone cannot fix a market distorted by a decade of underbuilding.
What would fix it — or at least bend the curve — is a policy agenda serious enough to match the scale of the problem:
- Zoning reform at scale. States that have moved to override restrictive local zoning — Montana, California’s recent legislative efforts, and several New England states — are showing early signs that supply can respond when the regulatory cage is opened. Federal incentives tied to zoning liberalization deserve serious legislative attention.
- Expansion of first-time buyer tools. Down payment assistance programs exist in every state, with over 2,200 initiatives nationally — yet 80% of eligible FHA borrowers fail to access them, simply because awareness is catastrophically low. A federally coordinated information campaign, combined with direct first-generation buyer subsidies, could meaningfully move the needle.
- Rate-lock portability. The most counterintuitive policy idea gaining traction is allowing homeowners to transfer their low-rate mortgages to new properties when they sell. If sellers feel less trapped by their existing rates, more would list. More listings means more supply. More supply means lower prices. The mechanism is financially complex, but the logic is sound.
- Long-term institutional investor accountability. The growing share of single-family homes purchased by institutional investors — and converted to rentals — deserves rigorous scrutiny. While the macroeconomic evidence on investor impact is mixed, the political economy of housing requires that policymakers be seen to address what has become a legitimate public grievance.
The Closing of the American Dream
There is a particular cruelty to the present moment that the aggregate data obscures. For three generations, the mortgage was the mechanism by which an ordinary family — a teacher, a mechanic, a nurse — converted labor into permanent wealth. It was imperfect, racially exclusionary in its early decades, and frequently predatory at the margins. But it worked, on balance, as an engine of intergenerational mobility. The children of homeowners were statistically more likely to attend college, accumulate savings, and buy homes themselves. The equity built in a home served as start-up capital for businesses, as a buffer against medical emergencies, as the inheritance that smoothed the generational transfer of modest prosperity.
When 87% of millennials tell pollsters they believe government should do more to make homeownership accessible — a figure significantly higher than older generations — they are not articulating an abstract ideological preference. They are describing a locked door. They grew up watching their parents build equity in appreciating homes. They graduated into a labor market reshaped by the Great Recession. They came of age as borrowers just as rates rose from 3% to 7%. And now, as the MBA’s weekly surveys confirm week after week, they are applying for mortgages at a rate lower than any seen in 25 years — lower than during the depths of the worst economic collapse in living memory.
The homeownership rate for all Americans under 35 stands at 37.9%. It is slightly higher than it was a year ago, and the analysts at Realtor.com are careful to note it. But the 25-year average for that demographic is 39.7%. And when previous generations were the same age, under-35 homeownership ran closer to 42–44%. The gap is not closing. The structural headwinds — rates, prices, supply, debt, stagnant wages relative to home values — are not resolving themselves on a timeline that will save the housing mobility of the generation currently in its prime buying years.
If a 30-year-old in 2026 waits until 40 to buy — as the NAR data suggests is now the median outcome — they will spend a decade paying someone else’s mortgage, building no equity, and arriving at ownership with 10 fewer years of compounding appreciation ahead of them. Multiplied across 80 million millennials and the Gen Z cohort now entering the labor force behind them, that delay represents an almost incalculable transfer of wealth from the young to the already-propertied.
The mortgage is not gone. It is still being written, still being signed, still closing on homes across America every day. But it is becoming a luxury product — a credential of the already-arrived rather than a ladder for the aspiring. That transformation, if left unaddressed, will not merely reshape household balance sheets. It will reshape the country.
Discover more from The Economy
Subscribe to get the latest posts sent to your email.



Key Takeaways
- Rolex’s secondary market rose approximately 7.9% year-over-year as of 2026 (per WatchCharts data) — trailing Patek Philippe (+16.2%) and Tudor (+11.4%) but still outperforming Audemars Piguet (+3.4%).
- Rolex raised U.S. retail prices 4–9% in January 2026 (steel models ~5.6%, gold models ~8.7%), narrowing the historical gap between retail and pre-owned pricing.
- Not every model appreciates: steel sports references (Submariner, GMT-Master II, Daytona) have held value far better than two-tone or widely available dress references like the standard Datejust.
- The Lady-Datejust posted the sharpest 2026 gain among tracked collections — up 22.73%, from roughly $9,269 to $11,376 — driven by demand for smaller, “everyday luxury” watches.
- Gold’s rise past $2,400/oz has directly lifted the investment case for Rolex’s precious-metal references (Day-Date, Sky-Dweller, Yacht-Master).
The Model-by-Model Picture
| Category | 2026 Trend |
|---|---|
| Lady-Datejust | +22.73% (strongest performer among tracked collections) |
| Steel sports models (Submariner, GMT-Master II) | Held value well; corrected from 2022 peak but stabilized above retail |
| Daytona | Corrected from highs above $50,000 to the mid-$30,000s; still among the most sought-after references |
| Two-tone/widely available Datejust | Flat to negative — “holds value” is an overstatement for this category |
| Gold references (Day-Date, Sky-Dweller) | Lifted by gold’s rise above $2,400/oz |
Why the “Rolex Always Appreciates” Myth Is Fading
The pandemic-era boom pushed some references — the Daytona above all — to speculative highs disconnected from historical norms. Since the March 2022 peak, steel sports models have compressed meaningfully, and dealers who bought inventory near the top have in some cases faced 20–40% markdowns on liquidation. The lesson for 2026 buyers: Rolex as a category is not a monolith. Value retention depends heavily on specific reference, condition, and whether the piece comes with box and papers (“full set”).
What’s Actually Driving 2026 Strength
- Retail price increases raise the floor. When a new Submariner retails at $10,050 (up from $9,500), a pre-owned example at $11,000–$12,000 suddenly represents a smaller premium — narrowing the gap without secondary prices actually moving.
- Supply discipline remains Rolex’s core lever. The brand has never confirmed production numbers, and secondary-market premiums remain entirely a function of Rolex’s own manufacturing decisions — a risk factor as much as a support.
- Certified Pre-Owned rollout. Rolex’s now fully rolled-out CPO program has changed how buyers transact in the used market, adding a layer of brand-verified legitimacy that supports pricing.
The Case for Rolex as a Portfolio Diversifier
Financial advisors increasingly frame luxury watches not as a replacement for equities or bonds, but as a tangible, historically low-correlation diversifier — one that carries its own risks (illiquidity, condition-dependent pricing, no yield) but has demonstrated multi-decade resilience for specific references.
Is Rolex a good investment in 2026?
It depends heavily on the specific reference. Steel sports models like the Submariner and Daytona have held or grown in value; two-tone and widely available dress models generally have not. Overall, Rolex’s secondary market rose about 7.9% year-over-year in 2026, trailing Patek Philippe but ahead of Audemars Piguet.
Discover more from The Economy
Subscribe to get the latest posts sent to your email.

Navigating Mortgage and Loan Refinancing in a High-Yield Environment
Global public debt crossing critical thresholds has kept central bank policies volatile, resulting in fluctuating US Treasury yields throughout 2026. For homeowners and commercial property holders burdened by previous high-interest borrowing cycles, finding optimal refinance windows has become a high-stakes financial puzzle. Stalled disinflation and stubborn employment numbers mean rate cuts are incremental, requiring borrowers to act with precision.
Timing your mortgage or commercial loan refinance in this environment requires a deep understanding of yield curve movements and lender risk appetites.
Decoding 2026 Refinance Dynamics
The 10-Year Treasury Yield Benchmark
Mortgage rates continue to track closely with the 10-year US Treasury yield. When macroeconomic anxiety spikes debt issuance, yields rise, tightening consumer borrowing capacity. Savvy borrowers monitor weekly Treasury auctions to lock in rates during brief dip windows.
Hybrid ARMs and Alternative Structures
With fixed rates remaining elevated, 7/1 and 10/1 adjustable-rate mortgages (ARMs) have surged in popularity. These products offer lower initial monthly payments, giving borrowers breathing room until central bank easing cycles fully materialize.
| Loan Product | Current Rate Range | Best For | Key Risk Factor |
| 30-Year Fixed Mortgage | 6.2% – 6.8% | Long-term predictability | Higher initial monthly outlay |
| 7/1 Hybrid ARM | 5.5% – 5.9% | Short-term ownership / flipping | Rate reset risk after year 7 |
| Commercial Refinance | 7.0% – 8.2% | Corporate asset restructuring | Strict DSCR lender covenants |
Actionable Steps for Successful Refinancing
To maximize your chances of securing favorable refinance terms in a volatile market, follow a disciplined preparation strategy.
Boost Your Credit Score Immediately: Lenders in 2026 are applying stringent credit tiering; a 20-point increase can drop your APR by a crucial quarter-point.
Shop Regional Credit Unions: Smaller financial institutions often offer portfolio loans with more flexible underwriting than major national banks.
Calculate the Break-Even Point: Ensure your total closing costs are recouped through monthly savings within 24 months of closing.
“Market Strategist View: Refinancing in 2026 is an exercise in opportunistic timing. Borrowers must maintain immaculate financial profiles ready to strike the moment Treasury yields dip.”
Mastering the complexities of today’s debt environment ensures you can successfully lower your debt service costs and protect your long-term financial stability.
Discover more from The Economy
Subscribe to get the latest posts sent to your email.

The days of pulling generic auto insurance quotes based purely on your zip code and age are officially over. In 2026, insurance comparison engines are powered entirely by generative AI and real-time telematics. These platforms digest thousands of live data points—ranging from your driving smoothness via connected vehicle sensors to real-time traffic congestion patterns—to generate hyper-personalized premiums instantly.
For consumers, this evolution represents both a massive opportunity for savings and a hidden trap for penalty pricing. Understanding how AI algorithms evaluate risk is essential for anyone looking to lower their monthly auto insurance premiums.
How AI Comparison Engines Evaluate Your Risk Profile
Behavioral Telematics and Connected Cars
Modern cars stream performance data directly to insurance aggregators. Generative AI models analyze braking sharpness, acceleration curves, cornering G-forces, and phone distraction metrics. Drivers who maintain smooth, defensive habits are rewarded with dynamic rate cuts of up to 40% compared to traditional rating tiers.
Predictive Traffic and Weather Modeling
AI tools now cross-reference your daily commute route with predictive weather and accident probability models. If your standard parking location or driving corridor has a statistically higher incidence of uninsured motorist claims, your quotes will reflect that hyper-local risk assessment.
| Comparison Factor | Traditional Rating Model | 2026 Generative AI Model | Impact on Premium |
| Mileage & Usage | Annual estimated odometer reading | GPS tracking & live trip duration | High (up to 35% savings) |
| Driving Behavior | MVR driving record & accidents | Real-time braking, speed, & G-force | Critical (determines tier) |
| Vehicle Tech | Make, model, and safety rating | ADAS calibration & repair cost data | Moderate |
Strategies to Lower Your AI-Driven Insurance Quote
To outsmart the algorithm and secure the lowest possible premium in 2026, drivers must proactively manage their digital footprint on insurance platforms.
Opt-In for Telematics Trial Periods: Many insurers offer immediate 15% discounts just for installing their driving app; let it track safe habits for 30 days to lock in permanent savings.
Scrub Unverified Public Records: Ensure your motor vehicle report is free of clerical errors that AI risk models misinterpret as reckless behavior.
Compare AI Aggregators: Use platforms that integrate multi-carrier API feeds rather than single-brand comparison sites to find the best risk-adjusted rate.
“Industry Note: AI-driven pricing rewards transparency and precision. Drivers who actively manage their telematics data consistently out-save those relying on legacy quote calculators.”
Embracing AI comparison tools allows savvy policyholders to customize coverage limits precisely to their driving habits, eliminating wasted premium spend while ensuring robust protection.
Discover more from The Economy
Subscribe to get the latest posts sent to your email.

Stock Market Crash in 2026? Warning Signs, Scenarios and a Calm Investor Checklist

Peso Mexicano vs Dólar Estadounidense: A Practical USD/MXN Guide for October 2026

Is the Stock Market Open on Columbus Day 2026? NYSE, Nasdaq and Bonds Explained

Concert Ticket Prices in 2026: Dynamic Pricing, Fees and How to Buy Safely

High-Yield Savings Accounts in 2026: How to Compare APY Without Chasing a Headline

EU-China Trade Deal 2026: How Beijing and Brussels Avoided a Trade War—and Who Wins

Social Security 2027 COLA Announcement: Date, Formula and What Retirees Should Check

China’s AI Microdrama Boom: How Beijing Is Reshaping Global Media

Q3 2026 Earnings Preview: Can Record Profit Expectations Keep Wall Street’s Rally Alive?

Russia Diesel Deal 2026: Oil Prices and Inflation Risks

Fed Rates 2026: Treasury Yields, Bonds and SGOV Explained

S&P 500 Market Breadth 2026: Weak Rally or Rotation?

The AI Capex Boom: Data Centers Reshaping Growth

Palantir Stock in 2026: Extraordinary AI Growth

PSX Forecast 2026: KSE-100, IMF Reviews & Geopolitics

Middle East War Economics 2026: Oil Prices & Energy Markets

China Stocks Today: Are Big Economies in Asia Nearing a Market Bottom?

Crypto Daily Outlook: Bitcoin, Altcoins, and the Future of Decentralized Finance

Global Pension Systems Ranked: The World’s Best and Worst Retirement Frameworks

World’s Largest Economies: Ranking the Top Global Powers

Elon Musk’s Next Moves: Disrupting the 2026 Global Economy

Pakistan Economy 2026: Inside the SBP’s Balancing Act

GasBuddy Market Insights: How Crude Price Shifts Impact Local Fuel Cost Averages

World Bank & IMF Reports 2026: Why the “3% Growth” Consensus Is Actually a Debate

Crude Oil & Petroleum Market Analysis: OPEC+ Decisions and Price Forecasts

Global Equity Market Divergence: US Tech vs. European Dividend Stocks vs. Asian Growth

IMF & World Bank Global Economic Outlook: Growth Forecasts Across Europe and Asia

Silver Price Today: Why the Xi-Trump AI Standoff Is Fueling a Safe-Haven Rally
-

 Markets & Finance9 months ago
Top 15 Stocks for Investment in 2026 in PSX: Your Complete Guide to Pakistan’s Best Investment Opportunities
-

 Analysis8 months ago
Johor’s Investment Boom: The Hidden Costs Behind Malaysia’s Most Ambitious Economic Surge
-

 Analysis8 months ago
Top 10 Stocks for Investment in PSX for Quick Returns in 2026
-

 Banks9 months ago
Best Investments in Pakistan 2026: Top 10 Low-Price Shares and Long-Term Picks for the PSX
-

 Analysis8 months ago
Brazil’s Rare Earth Race: US, EU, and China Compete for Critical Minerals as Tensions Rise
-

 Investment9 months ago
Top 10 Mutual Fund Managers in Pakistan for Investment in 2026: A Comprehensive Guide for Optimal Returns
-

 Global Economy10 months ago
15 Most Lucrative Sectors for Investment in Pakistan: A 2025 Data-Driven Analysis
-

 Global Economy10 months ago
Pakistan’s Export Goldmine: 10 Game-Changing Markets Where Pakistani Businesses Are Winning Big in 2025