
Analysis
Oil Prices Fall as WSJ Reports Trump Ready to End Iran Campaign — Even With Hormuz Closed

Oil prices dropped 1% after a WSJ report said Trump is willing to end the Iran military campaign even if the Strait of Hormuz stays closed. Here’s what it means for Brent crude, energy markets, and your portfolio in 2026.
Introduction: A 1% Drop That Carries the Weight of History
In the compressed, volatile lexicon of wartime oil markets, a 1% move can be either a tremor or a turning point. On Tuesday morning, as Asia’s trading desks absorbed the latest leak from Washington’s corridors of power, Brent crude futures for May delivery slipped $1.22 — down 1.08% — not because the war in Iran had ended, not because a single tanker had safely transited the Strait of Hormuz, but because of something far more intangible: the reported willingness of one man to walk away from the most disruptive energy conflict in half a century, even if the world’s most critical oil chokepoint remains largely shut.
The Wall Street Journal, citing unnamed administration officials, reported late Monday that President Donald Trump has told aides he is prepared to end the U.S. military campaign against Iran without first securing the reopening of the Strait of Hormuz — a strategic reversal that, if confirmed, would fundamentally reshape the calculus of every energy trader, central bank governor, and petroleum minister on earth. The signal was enough to trim the geopolitical risk premium baked into crude. Whether it marks a genuine diplomatic inflection or merely the latest act in a month of whiplash messaging is the question that will define energy markets — and global economic stability — for the remainder of 2026.
Market Reaction & Technicals: Reading the Price Signal
The immediate market reaction was instructive in its restraint. Brent crude futures erased earlier gains and turned negative, settling around $111 per barrel — a far cry from the near-$120 spike seen just eight days ago, on March 23, but still roughly 50% above the pre-war levels that prevailed before the U.S. and Israel launched strikes on Iran on February 28.
Bloomberg reported that equity-index futures simultaneously climbed — S&P 500 futures rose 0.8%, European shares edged 0.3% higher — in a classic risk-asset rotation that told its own story: some investors believe an end to the conflict is approaching. But the MSCI Asia Pacific Index fell 1% and was on track for its worst month since October 2008, a sobering counterpoint that reflects just how durable the structural damage to energy supply chains has become.
The 1% Brent decline should be viewed through the lens of what it didn’t do. It did not break below $110. It did not approach the psychological floor of $100 that briefly appeared in late March. The war premium in crude is not deflating — it is being partially trimmed, like a balloon with a small leak, by speculation that active hostilities might soon cease. Until the Hormuz question is resolved — either diplomatically or physically — the market’s floor will remain elevated.
Key data point: West Texas Intermediate (WTI) futures for May delivery also declined, dropping 0.72% to approximately $102 per barrel as of early Tuesday trading, according to CNBC.
The Trump Pivot: What the WSJ Report Really Means
The Wall Street Journal report, published late Monday evening, is among the most consequential strategic leaks of the Iran war. Its core revelation — confirmed to the Journal by administration officials — is that Trump and his inner circle have reached a pivotal internal assessment: forcing the Strait of Hormuz back open through military force would push the conflict well beyond the four-to-six-week timeline the President has discussed privately and publicly.
According to reporting compiled across multiple outlets, the strategic logic runs as follows: the U.S. has achieved its primary military objectives — dismantling Iran’s naval capacity and degrading its missile stockpiles. The mission, as now defined by the White House, is complete enough to declare victory and wind down direct hostilities. Reopening the strait, by contrast, would require a fundamentally different and far more complex military operation, one with no guaranteed timeline and with serious escalation risks.
Trump’s fallback positions, as outlined in the leak, have a distinctly diplomatic character:
- Option one: Negotiate a ceasefire with Tehran that includes an Iranian commitment to reopen the waterway.
- Option two: Pressure Gulf State allies and NATO partners to lead any military or logistical effort to reopen Hormuz.
- Option three: Use diplomacy and economic leverage to compel Iran to open the strait over time.
Israeli Prime Minister Benjamin Netanyahu has separately floated an infrastructure-based alternative, suggesting that Gulf pipelines could be rerouted westward through Saudi Arabia to the Red Sea and Mediterranean, bypassing the Hormuz chokepoint entirely. The proposal underscores a growing regional consensus that a durable solution may require reinventing the Middle East’s energy architecture rather than simply restoring the status quo ante.
Why Markets Are Skeptical: The Hormuz Paradox
Here is the paradox at the center of Tuesday’s 1% oil move: the very condition Trump appears willing to accept — a largely closed Strait of Hormuz — is also the primary reason oil prices remain catastrophically elevated in the first place.
The Strait of Hormuz is not merely a shipping lane. It is, as Goldman Sachs co-head of global commodities research Daan Struyven noted in a media briefing, the site of the largest oil supply shock in decades as a measured share of global output. The waterway typically carries approximately one-fifth of the world’s oil and liquefied natural gas (LNG) — a volume so large that even a partial disruption reverberates through every refinery, power plant, and gas pump on the planet.
Iran has not merely threatened to keep the strait closed. It has demonstrated the will and capacity to enforce that closure through mines, missile strikes on tankers, and coordinated harassment of commercial shipping. As recently as Tuesday, Kuwait Petroleum Corporation reported that a fully loaded Kuwaiti crude tanker, the Al Salmi, was struck and set ablaze while anchored at Dubai’s port — evidence that the maritime threat is operational, not theoretical.
Iran’s own signals have been characteristically contradictory. Tehran’s mission to the United Nations indicated that “non-hostile vessels” might pass through the strait if coordinated with Iranian authorities — a formulation that implies continued Iranian veto power over global energy flows. Meanwhile, Iran’s state media has flatly rejected U.S. ceasefire proposals, and an Iranian military spokesperson publicly mocked Washington’s 15-point ceasefire plan, even as Pakistan has offered to host indirect talks.
The result is what Matt Gertken, chief geopolitical strategist at BCA Research, described on CNBC as “a more asymmetric game, with the U.S. leaning toward exit and Iran still incentivized to impose cost.” In energy market terms, that asymmetry means the risk premium will not fully deflate until the physical reality at the strait changes — regardless of what is said in Washington or Tehran.
Global Ripple Effects: From Asian Refineries to American Gas Pumps
The human and economic cost of five weeks of disrupted Hormuz transit is no longer abstract. It is being measured in percentage points of GDP, in inflation data, and in the rising anger of consumers across three continents.
For the United States, the IEA has noted that at least 44 energy assets across nine countries in the region have been severely damaged since the conflict began. American gas prices rose for the 23rd consecutive day as of late March, reaching a national average of $3.96 per gallon — a month-on-month gain of 34%, exceeding the post-Hurricane Katrina spike of 2005 and rivaling the Ukraine-era surge that eventually took prices to a record $5.02 a gallon.
For Europe, the energy shock compounds an already fragile inflation picture. As Euronews reported, the Bank of England’s rate expectations have been overhauled in recent weeks as markets brace for an inflationary shock. The eurozone, still working through the structural energy transition that followed Russia’s 2022 invasion of Ukraine, now faces a second consecutive supply crisis — one that has pushed gold to $4,557 per ounce and forced gold’s worst weekly drop since 1983 as investors rotated to hedge against war-driven inflation.
For Asia, the pain is acute and immediate. Japan, South Korea, and India collectively import the majority of their crude through the Strait of Hormuz. The MSCI Asia Pacific Index’s trajectory toward its worst monthly performance since October 2008 reflects not just equity selling, but a deep structural anxiety about the reliability of energy supply chains that have underpinned Asian industrial growth for decades.
For OPEC and the Gulf States, the calculus is the most complex. Saudi Arabia and the UAE are simultaneously benefiting from elevated prices, being pressured by Washington to increase output, and privately urging the Trump administration — according to Haaretz — to continue fighting until Iran is “decisively defeated.” Riyadh’s pipelines could, in theory, help bypass Hormuz, but diverting the volume typically transiting the strait would require years of infrastructure investment, not weeks.
Historical Parallels and Forward Scenarios: What 2026 Holds
The energy market disruptions of 2026 have already surpassed those of the twin oil shocks of 1973 and 1979, at least by the metric of supply lost as a share of global output — a judgment rendered not by alarmists but by IEA Executive Director Fatih Birol, who noted that the loss of natural gas supply also exceeds the 2022 crisis triggered by Russia’s invasion of Ukraine.
The most instructive historical parallel may be the 1988 “Tanker War” phase of the Iran-Iraq conflict, when U.S. naval escorts — Operation Earnest Will — were required to shepherd Kuwaiti tankers through Hormuz under Iranian fire. That episode lasted 14 months and ultimately required direct U.S. military engagement with Iranian naval forces. The current disruption is orders of magnitude larger, and the political appetite in Washington for a sustained naval campaign to reopen the strait — as the WSJ report makes clear — is limited.
Three forward scenarios define the credible range for oil prices through the remainder of 2026:
- Diplomatic ceasefire with partial Hormuz reopening (base case, ~40% probability): Trump ends major combat operations; Iran agrees to allow commercial shipping under a monitoring regime, similar to the UN’s protocols used in the Black Sea during the Ukraine conflict. Brent crude falls toward $85–$95. U.S. gas prices ease back below $3.50 by Q3 2026.
- Military exit without Hormuz resolution (emerging case, ~35% probability): The WSJ scenario materializes. Trump declares victory and withdraws, but Hormuz remains effectively closed or severely restricted. Crude settles in the $105–$120 range. Global inflation remains elevated; recession risk in Europe and parts of Asia increases materially.
- Escalation or breakdown (tail risk, ~25% probability): Talks collapse; Iran attacks Gulf State infrastructure or a major tanker incident triggers a new escalation cycle. Brent spikes above $130; the IEA triggers a second mass strategic reserve release; G7 emergency economic coordination intensifies. Global recession probability rises sharply.
Investor and Policy Implications: What Sophisticated Markets Must Watch
For investors, the WSJ report introduces a new variable that has not been fully priced: the risk that Hormuz remains impaired even after hostilities end. Markets have been pricing the conflict as a binary — war on, prices high; war off, prices normalize. The leak suggests a more complex endgame in which the geopolitical risk premium does not fully dissipate with a ceasefire, because the structural impediment to oil flows — a belligerent Iran with continued influence over the strait — persists.
Several indicators deserve close monitoring in the days ahead:
- The 15-point ceasefire proposal: The New York Times reported that Washington transmitted this framework to Tehran via Pakistan. Any Iranian counter-proposal or partial acknowledgment would be a significant de-escalation signal.
- Strait of Hormuz transit data: Real-time AIS tracking of commercial vessel movements through the strait, published by platforms like S&P Global Commodity Insights and Kpler, will provide the earliest ground-truth signal on whether the diplomatic temperature is translating into physical oil flows.
- IEA strategic reserve decisions: The IEA has already authorized the release of 400 million barrels from member-country strategic stockpiles — a record. A second release would signal that energy ministers believe the disruption is prolonged, not transient.
- Saudi and Gulf pipeline capacity: Any acceleration of pipeline infrastructure investment — particularly the expansion of the East-West Pipeline through Saudi Arabia — would represent a structural hedge against Hormuz dependence, suppressing the long-term risk premium.
- Federal Reserve posture: The sustained oil price spike has effectively killed expectations of a Fed rate cut in H1 2026. A durable ceasefire that brings Brent below $95 would rapidly reprice rate-cut odds, triggering a significant equity rally and USD depreciation.
Conclusion: The Exit Ramp Is Visible — But the Road Beyond It Is Not
Tuesday’s 1% decline in Brent crude is a measure of hope, not resolution. It reflects the market’s rational response to credible evidence that the Trump administration is looking for an exit from a war it entered with insufficient consideration of how to end it. That the exit ramp now apparently does not require the immediate reopening of Hormuz is, in one sense, reassuring — it makes a ceasefire more achievable in the near term. In another sense, it is deeply unsettling, because it means the world’s most important oil transit corridor could remain contested, mined, and dangerous well into 2027.
The harder geopolitical truth is this: the Strait of Hormuz has never been merely a geographical fact. It is a statement of Iranian power, and no administration in Tehran — battered as the current one is — will surrender that leverage cheaply or quickly. The question is not whether Trump can end the war. The question is whether ending the war, on these terms, ends the energy crisis. Based on everything the market knows today, the answer is: not entirely, not immediately, and perhaps not for a very long time.
What is certain is that the age of cheap, abundant, geopolitically stable oil — already eroding for a decade — has suffered another foundational blow. How investors, policymakers, and consumers adapt to that reality is the defining energy story not just of 2026, but of the decade beyond it.
Discover more from The Economy
Subscribe to get the latest posts sent to your email.


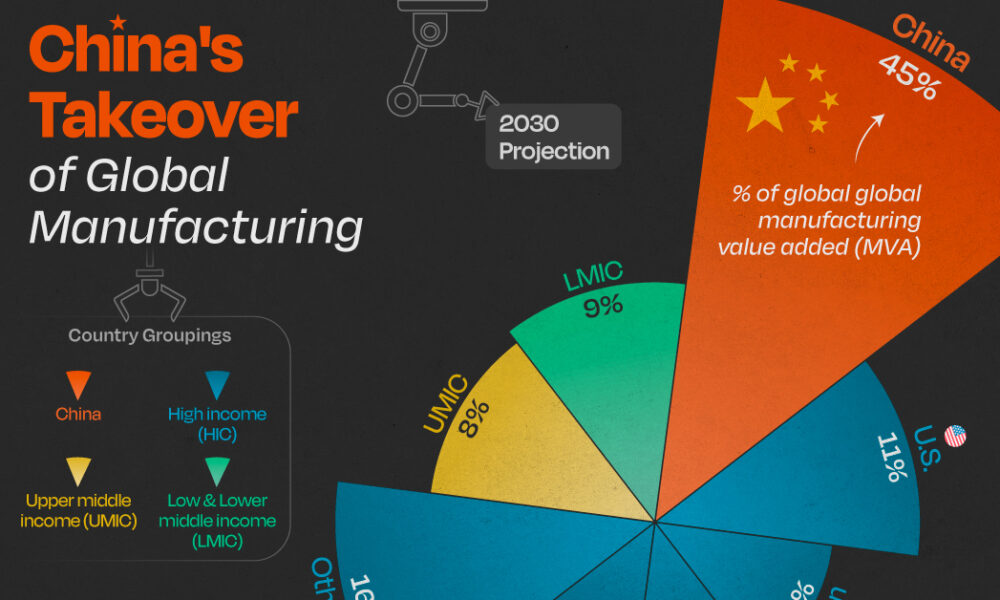
China’s exports have been the good-news story in an otherwise mixed economic picture. They’re not just holding up; through the first four months of 2026 they were running about 14% to 15% above the same period a year earlier, according to figures cited by the US-China Economic and Security Review Commission and Vanguard’s economic outlook. That’s the kind of number that would normally signal a healthy economy. The complication is what’s happening underneath it.
A growth model showing its age
Manufacturing capacity utilization fell to 73.9% in early 2026 — near a decade low outside of the pandemic shutdowns, per the Commission’s bulletin. That’s the tell. China is producing and shipping more, but a growing share of its industrial base is running under capacity, which points to a structural mismatch: the country’s manufacturing engine has outgrown both its domestic consumption and, increasingly, what the rest of the world is willing to absorb without pushback.
Goldman Sachs Research, in a report cited by Goldman Sachs’ own analysis, forecasts 4.8% real GDP growth for 2026 — above consensus expectations of 4.5% — driven substantially by continued export strength and a softening drag from the property downturn. But that same report flags the labor market as a genuine weak spot: hiring, measured across a weighted average of PMI employment sub-indexes, is at its most depressed level in a decade outside Covid, and urban nominal wage growth slowed to just 3.8% year-on-year in Q3 2025.
Why Beijing isn’t reaching for stimulus
Given the export strength, one might expect policymakers to feel less urgency about consumption-side stimulus. That’s roughly what’s happening — and it’s a deliberate choice, not an oversight. Xi Jinping’s government remains committed to dominating high-value manufacturing, which means comprehensive fiscal stimulus aimed at consumers remains unlikely even as domestic demand stays soft, according to the Commission’s bulletin.
The People’s Bank of China is expected to hold its policy rate steady through the rest of the year, preferring targeted structural tools over a broad-based rate cut, per Vanguard’s forecast. That’s a notably cautious stance given how weak the property sector remains — property investment indicators are down 50% to 80% from their 2020–21 peaks, and a “meaningful domestic-demand turnaround remains elusive,” in Vanguard’s own words.
The regulatory push to keep capital at home
Two moves by Chinese regulators in mid-2026 point to where Beijing’s real priority sits: keeping household savings and private capital funneled toward domestic industrial policy rather than flowing overseas. New rules taking effect July 1 restrict outbound investment that could be used to export restricted technology or expertise under the guise of ordinary capital flows, with violations carrying fines, visa restrictions and industry blacklisting, according to the Commission’s bulletin. The regulations follow Beijing’s move to block the founders of AI firm Manus from completing a sale to Meta, even after the company had relocated its headquarters from China to Singapore — a signal that Beijing is willing to reach across borders to keep promising tech assets tethered to domestic or Hong Kong listings.
The currency and trade angle
Goldman’s team makes an out-of-consensus call worth flagging: it expects China’s current account surplus to rise to 4.2% of GDP in 2026, up from 3.6% in 2025, while the broader analyst consensus surveyed by Bloomberg expects a decline to 2.5%. The divergence comes down to export resilience — falling export prices are making Chinese goods more competitive even as the yuan is expected to appreciate slightly, with export-price inflation in dollar terms forecast to turn positive, rising to 0.7% from -2.7% the prior year.
The bottom line
China’s economy in 2026 is a study in contrasts: robust headline export growth sitting on top of underutilized factories, a weak labor market, and a property sector still in its fifth year of decline. The World Bank’s own baseline, published in its country program materials, projects growth moderating toward 4.0% by 2026 — a more conservative read than Goldman’s. Either way, the consensus across forecasters is the same: exports are carrying more of China’s growth than is healthy for the long run, and Beijing’s policy choices this year suggest it’s betting on technological dominance to eventually solve the demand problem, rather than opening the stimulus taps to solve it directly.
Discover more from The Economy
Subscribe to get the latest posts sent to your email.
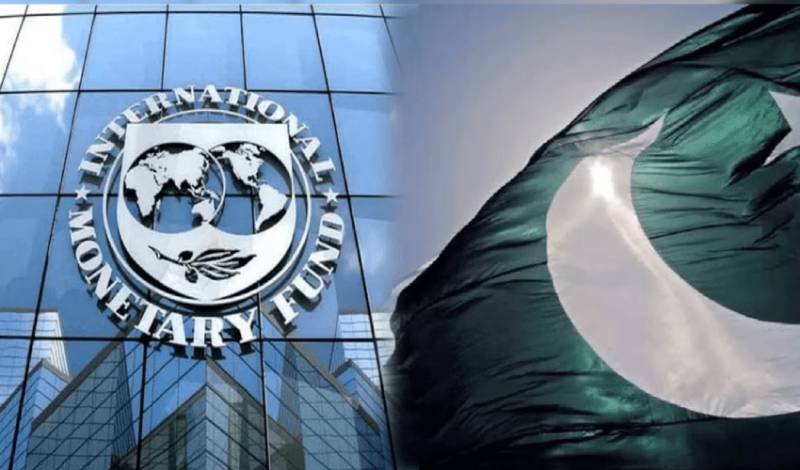
There’s a number that keeps showing up in every conversation about Pakistan’s economy, and it keeps getting bigger: circular debt. As of early July 2026, the gas sector’s share of that debt alone has topped Rs 3.44 trillion, and Islamabad has missed a deadline the IMF set for tariff reforms meant to arrest the slide, according to Dawn.
What circular debt actually is, and why it won’t go away
Circular debt is the chain of unpaid obligations that builds up when the price consumers pay for electricity or gas doesn’t cover what it actually costs to produce and deliver it. Someone in the chain — a power producer, a gas utility, a state-owned enterprise — ends up carrying an IOU, and that IOU gets passed down the line. Earlier this year, IMF officials pressed Pakistan on exactly this dynamic, questioning the government’s plan to zero out gas-sector circular debt, according to Aaj English. At the time, officials said around Rs 150 billion remained payable to companies including Oil and Gas Development Company Limited and Pakistan Petroleum Limited.
Islamabad’s proposed fix included a Rs 5-per-unit levy on gas, dividends from state-owned companies redirected toward debt reduction, and the sale of 35 LNG cargoes annually on the international market. The IMF, per that same reporting, raised pointed questions about whether the plan was actually viable.
The commitments Pakistan has already made
Under its Extended Fund Facility, Pakistan has committed to capping circular debt growth at Rs 300 billion for FY2027 and cutting power-sector subsidies from 0.7% of GDP to 0.6%, according to details reported by ProPakistani. The government has also shifted Nepra’s annual tariff-rebasing cycle from July to January, and Ogra now revises gas tariffs twice a year instead of once.
Structurally, some of this is working. The IMF’s own review in May 2026 credited Pakistan with a primary fiscal surplus of 1.6% of GDP for FY26, broadly in line with program targets, and noted gross reserves had climbed to $16 billion by end-December, up from $14.5 billion six months earlier, according to the IMF’s own press release. That progress unlocked roughly $1.1 billion under the EFF and $220 million under a parallel climate-resilience facility, bringing total disbursements under the two arrangements to about $4.8 billion.
Where the fault lines actually are
The uncomfortable part of this story, laid out by commentary reported in The Hans India, is that revenue targets get IMF scrutiny with great precision, while structural reform of loss-making public enterprises — Pakistan International Airlines and Pakistan Steel Mills chief among them — moves far more slowly. Those enterprises’ losses are absorbed by the national exchequer through subsidies, guarantees, and debt restructuring year after year, and privatization plans keep slipping because the political cost of confronting them is high.
Distribution company inefficiency compounds the problem. In FY25, Discos posted Rs 265 billion in losses, an improvement on FY24’s Rs 276 billion but still a substantial drag, according to Geo News, with Quetta, Peshawar and Hyderabad among the worst-performing utilities.
What happens if the pattern holds
Pakistan’s debt-to-GDP ratio sits between 70% and 80% as of 2026, according to Wikipedia’s economic summary, with debt servicing occasionally consuming two-thirds of government spending. That’s the backdrop against which every circular-debt conversation happens: there is very little fiscal room left to absorb another missed deadline.
The missed gas tariff deadline doesn’t automatically trigger a program breakdown — Pakistan has weathered similar friction points before during its current EFF arrangement. But with the IMF’s own documentation showing persistent concern about the credibility of debt-reduction plans, and with global energy prices still elevated in the aftermath of the Iran war, the margin for further slippage is thin. The next review will likely hinge less on the rhetoric around reform and more on whether the Rs 5 levy and LNG cargo sales actually show up in the numbers.
Discover more from The Economy
Subscribe to get the latest posts sent to your email.
Analysis
Malaysia Bets Its 2026 on “Execution” — And the Semiconductor Upcycle Is Doing the Heavy Lifting

Malaysia’s government has declared 2026 a year of “execution” and “discipline” as the Anwar Ibrahim administration races to deliver on the 13th Malaysia Plan (RMK13) ahead of elections that could come as early as February 2028, according to Fortune’s interview with economy minister Akmal Nasrullah Mohd Nasir.
A Strong Base to Build From
Malaysia’s economy grew 4.9% in 2025 following 5.1% growth the year before, with unemployment falling to 2.9% — the lowest in a decade — and the ringgit trading at its strongest level in five years. HSBC’s ASEAN economist Yun Liu forecasts 4.6% growth for 2026, citing strength in electrical equipment manufacturing, tourism, and sound government policy, while Nomura economists have projected an even more bullish 5.2%, pointing to infrastructure spending under RMK13.
The ASEAN+3 Macroeconomic Research Office (AMRO) projects growth moderating slightly to 4.6% from an estimated 4.9% in 2025, describing Malaysia’s performance as reflecting its “entrenched position in global semiconductor and electronics value chains” and the broader global tech upcycle, according to AMRO’s assessment of Malaysia’s investment upcycle.
Navigating Washington Without Picking Sides
Malaysia’s trade relationship with the US has been turbulent. Washington imposed 25% tariffs on Malaysian goods in April 2025, rattling the country’s export-led economy, before a deal reduced US duties to 19% in exchange for Malaysia lowering tariffs on select American products, with exemptions carved out for aviation components and electrical equipment. Malaysia’s trade hit a record high of more than 3 trillion ringgit (roughly $780 billion) last year despite the friction.
Deputy finance minister Liew Chin Tong has framed Malaysia’s positioning explicitly around neutrality: the country is “not China, not the US,” a stance he argues gives Malaysia a strategic advantage in both geopolitical and supply-chain terms, according to Fortune’s reporting from the Forum Ekonomi Malaysia summit.
Capital Is Flowing In — From Everywhere
Malaysia recorded 22.8 billion ringgit (about $5.8 billion) in foreign direct investment in the first quarter of 2026, a 6.0% year-on-year increase, moderating from the prior quarter’s 48.7% surge. Inflows into information and communication technology services remained particularly strong, with China, Hong Kong, and Singapore serving as the primary capital sources, according to McKinsey’s Southeast Asia quarterly economic review. Bank Negara Malaysia has held its policy rate steady following a pre-emptive 25 basis-point cut in July 2025, with headline inflation projected to average just 2.0% in 2026.
The Long Game: Semiconductors, Rare Earths, and Nuclear Power
Beyond RMK13’s near-term targets, Malaysian officials are positioning the country’s industrial strategy around decades, not years. Minister Akmal has reiterated commitments to eliminate coal use by 2044 and reach net zero by 2050, while confirming Malaysia is actively “exploring the potential” of nuclear power to meet the energy demands of its expanding data-center and semiconductor sectors. AMRO’s structural policy guidance urges Malaysia to develop domestic semiconductor and rare-earth capabilities as a hedge against ongoing US-China “geoeconomic fracturing,” positioning the country as a trusted neutral hub for global manufacturers diversifying away from concentrated exposure to either superpower.
Discover more from The Economy
Subscribe to get the latest posts sent to your email.

China Economy 2026: Export Growth Masks Manufacturing Overcapacity

Pakistan Iran-US Ceasefire Mediation 2026: Diplomatic Gains, Economic Risks

Pakistan Circular Debt Crisis 2026: IMF Deadline Missed, Rs 3.44 Trillion

Indonesia Russian Oil Imports 2026: Why Jakarta Is Diversifying Crude Supply

Russia Bans Diesel Exports 2026: Global Fuel Market Impact Explained

Gulf Sovereign Wealth Funds Hit Record $53.9B in H1 2026 Despite Iran War

America’s Workers Are Vanishing From the Labor Force — And It’s Not the Usual Reasons

ASEAN+3 Enters 2026 From a Position of Strength — But Two Storms Are Building Offshore

US Tariff Investigation 2026: 60 Countries, Forced Labor Claims and the EU Trade Fight

UK Digital Identity Framework 2026: The £5bn Plan to Reshape Financial Verification

The Money Is Drying Up: How US Pressure Is Choking Off Russia-China Payment Channels

Indonesia GDP Growth 2026: 5.61% Expansion Marks Fastest Pace in Three Years

Singapore Makes Its Move to Become Asia’s Precious-Metals Capital

Malaysia Bets Its 2026 on “Execution” — And the Semiconductor Upcycle Is Doing the Heavy Lifting

Top 20 PSX Stocks for Investment in 2027: Your Complete Guide to Pakistan’s Best Investment Opportunities

Investors Pile Into Bullish Dollar Bets as ‘US Exceptionalism’ Trade Returns

Carry Trade Unwind 2026: How the Yen’s Snapback Triggered a Global Margin Call

Pakistan Textile Body Welcomes FY27 Budget, Seeks FTR

Japan’s Nikkei Scales Record Peak as AI Shares Track US Chip Rally

Why China’s Demand Stimulus Still Isn’t Working

Grinding the Already Ground: Pakistan’s Inflation Crisis

JPMorgan Cuts Anthropic AI Access in Hong Kong

Weak Demand at Treasury Auctions Is Quietly Rattling Bond Investors

China Tungsten Export Curbs: Is Japan’s AI Chip Supply at Risk?

Xponential Fitness Franchise Lawsuit: The $3.97M Judgment

SpaceX IPO opens door for retail savers via X Money

SpaceX IPO: Musk Raises $75bn in History’s Largest Listing

Bank Indonesia Rate Hike 2026: New Mandate’s First Market Test
-

 Markets & Finance6 months ago
Top 15 Stocks for Investment in 2026 in PSX: Your Complete Guide to Pakistan’s Best Investment Opportunities
-

 Analysis5 months ago
Top 10 Stocks for Investment in PSX for Quick Returns in 2026
-

 Analysis5 months ago
Brazil’s Rare Earth Race: US, EU, and China Compete for Critical Minerals as Tensions Rise
-

 Analysis5 months ago
Johor’s Investment Boom: The Hidden Costs Behind Malaysia’s Most Ambitious Economic Surge
-

 Banks6 months ago
Best Investments in Pakistan 2026: Top 10 Low-Price Shares and Long-Term Picks for the PSX
-

 Investment6 months ago
Top 10 Mutual Fund Managers in Pakistan for Investment in 2026: A Comprehensive Guide for Optimal Returns
-

 Global Economy6 months ago
15 Most Lucrative Sectors for Investment in Pakistan: A 2025 Data-Driven Analysis
-

 Global Economy6 months ago
Pakistan’s Export Goldmine: 10 Game-Changing Markets Where Pakistani Businesses Are Winning Big in 2025