
Insurance
Gulf Insurance Costs Soar 12-Fold Despite Trump Guarantee: The Global Energy Crisis No One Saw Coming

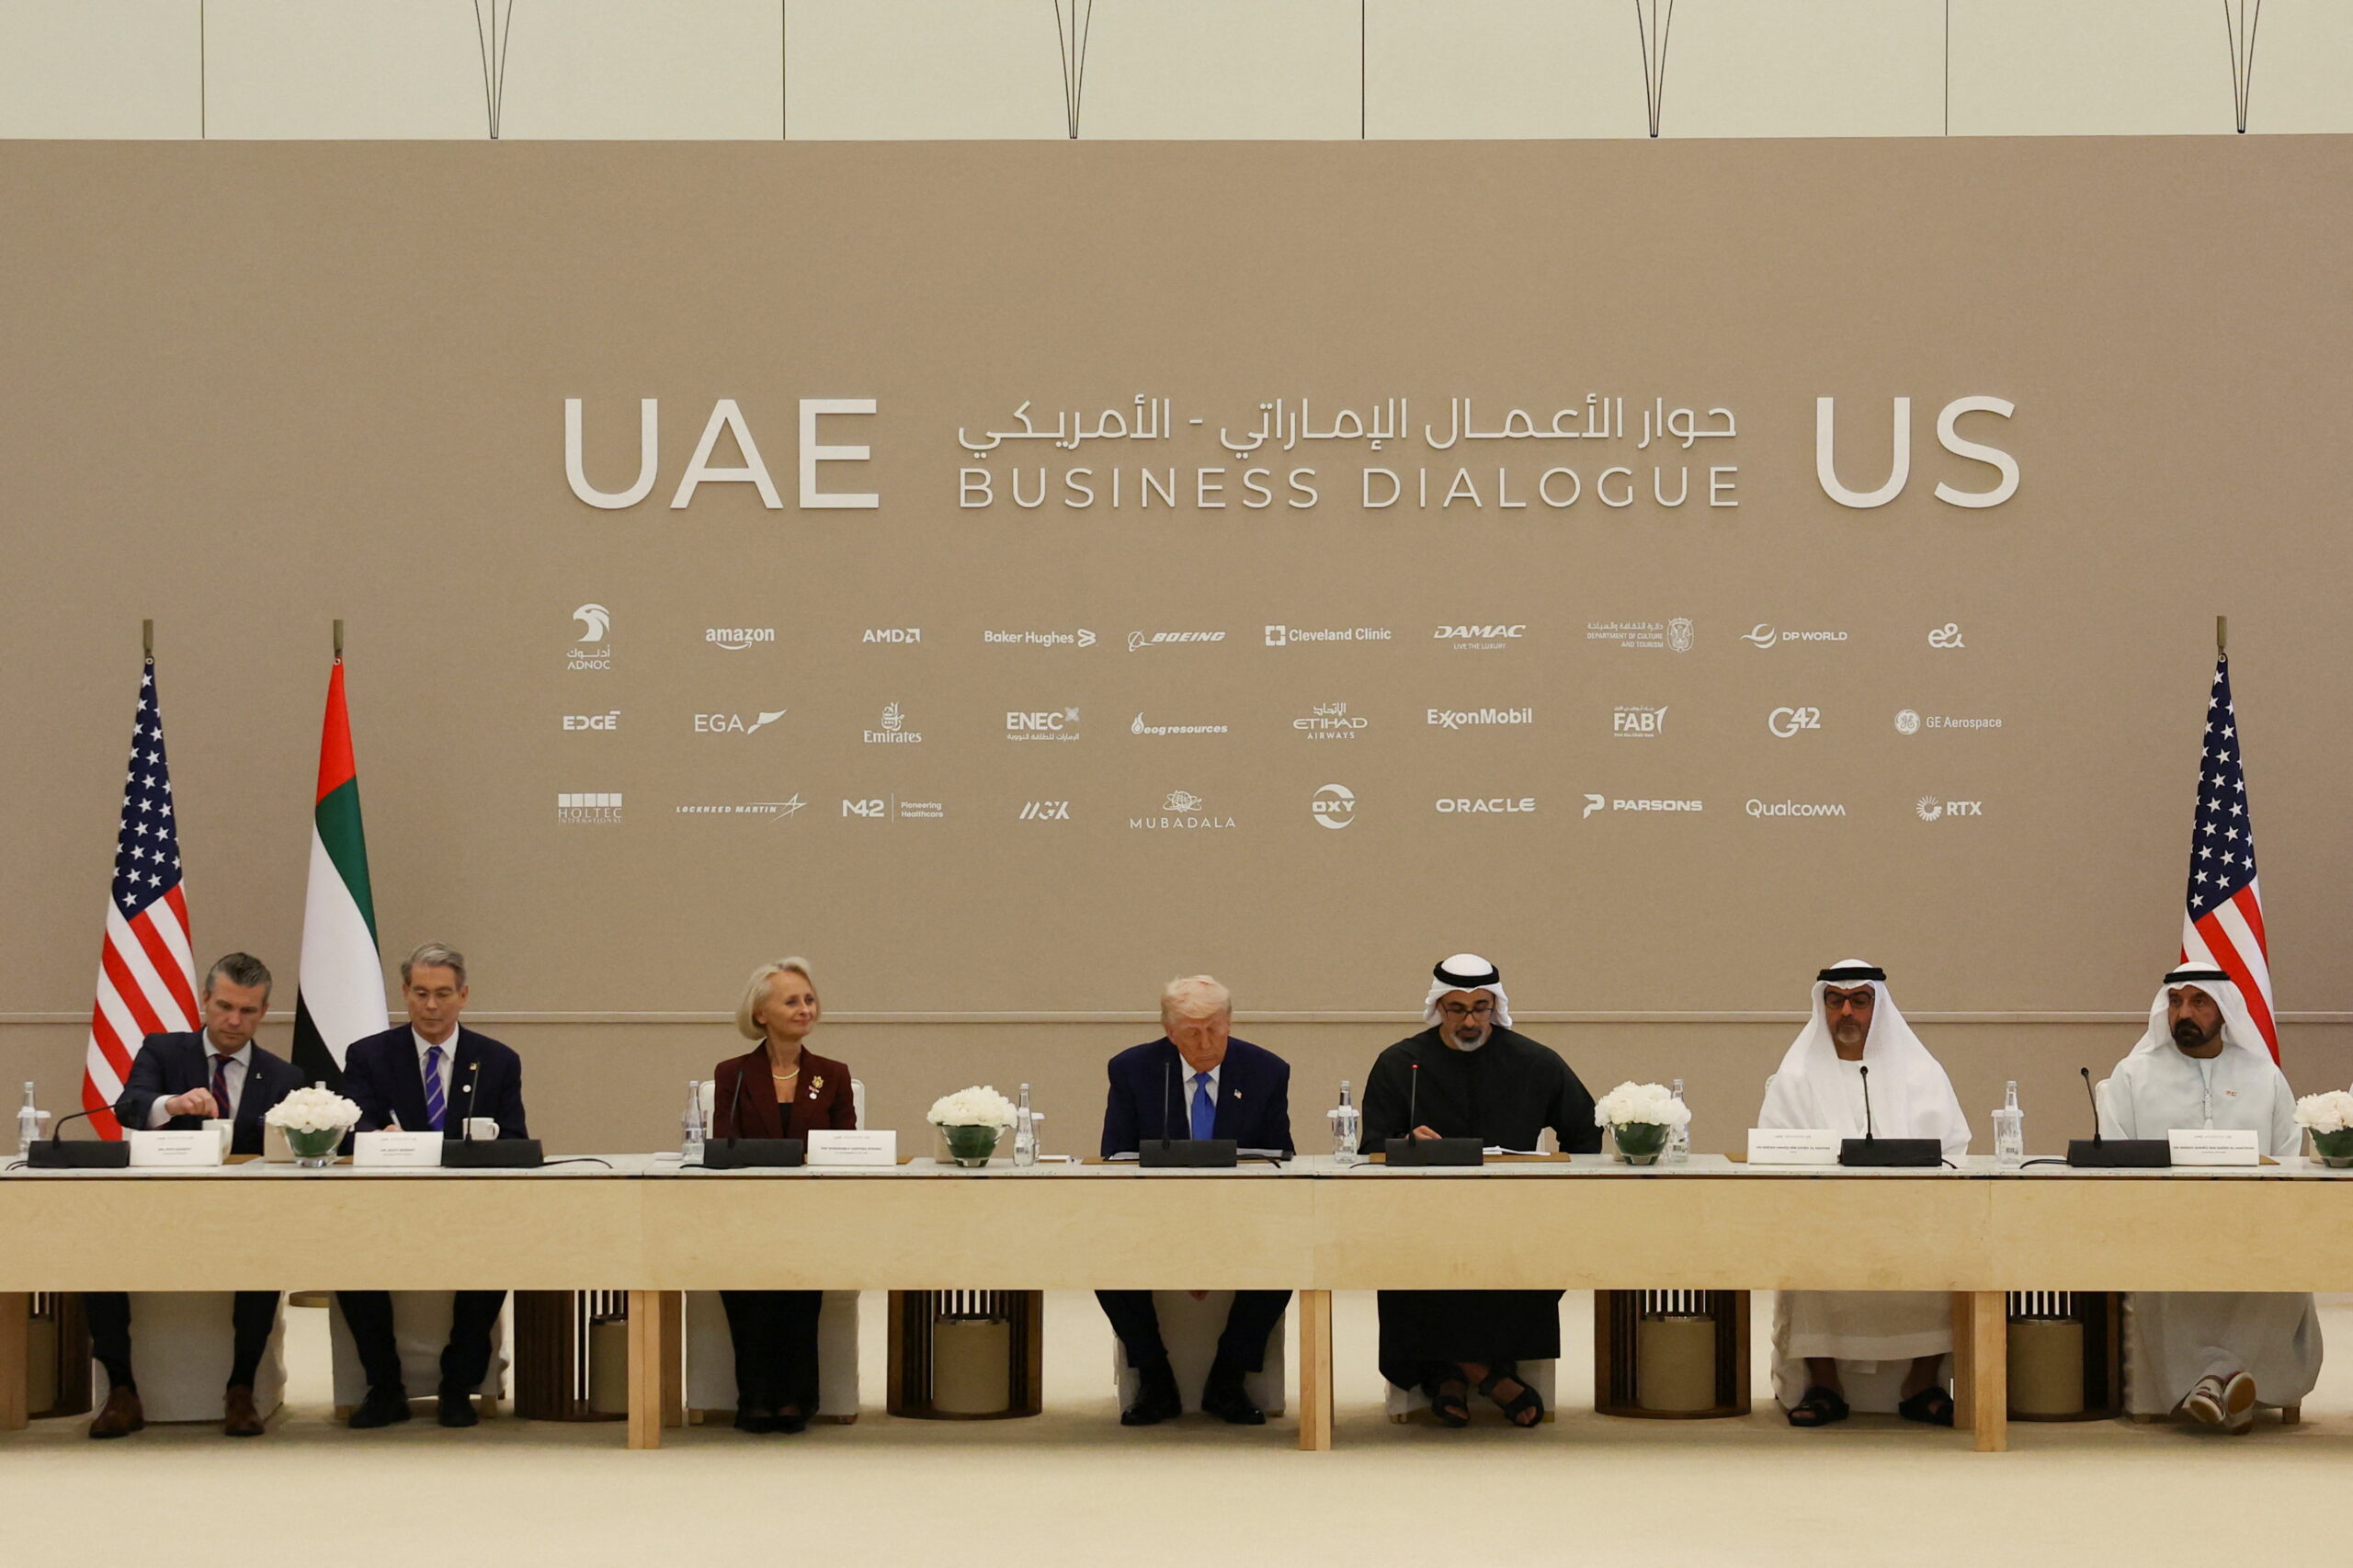
War risk premiums for Strait of Hormuz transits have surged from a pre-crisis baseline of roughly 0.08% to as high as 1% of hull value — a near-12-fold explosion in cost that is quietly strangling global energy trade, even as President Trump promises an insurance backstop through the U.S. Development Finance Corporation.
The Quote That Stops a Ship
Imagine you are the operations director of a midsize Greek tanker company. Your very large crude carrier — a VLCC laden with two million barrels of Saudi crude, worth roughly $160 million at today’s prices — is sitting at anchor in the Gulf of Oman. It was bound for Ningbo. Your broker in London calls Tuesday morning. The hull war risk premium to transit the Strait of Hormuz, if you can get one at all, has just hit 1% of the vessel’s insured value — for a single seven-day period. On a ship valued at $120 million, that is $1.2 million. For one voyage. Last month, the same premium was $96,000.
You tell the captain to hold position.
That decision, replicated by hundreds of operators across the global tanker fleet since the United States and Israel launched joint strikes against Iran on February 28, 2026, is the quiet mechanism behind the most severe disruption to global energy flows since the 1979 Iranian Revolution. It is not missiles or mines that have effectively closed the Strait of Hormuz — it is a spreadsheet, a reinsurer’s risk model, and a 12-fold surge in the price of a specialized insurance policy that most people have never heard of.
The Surge Explained: From 0.08% to Uninsurable
War risk insurance is the unglamorous but indispensable plumbing of global trade. Standard marine policies exclude losses arising from armed conflict; a separate war risk policy fills that gap, and without it, port authorities refuse entry, charterers void contracts, and banks decline to finance cargo. As David Smith, head of marine at insurance broker McGill & Partners, put it bluntly: if you walked into the hull war market right now and said you had a tanker bound through the Strait of Hormuz, there is a genuine possibility you would struggle to find any underwriter prepared to quote terms at all.
The numbers behind the collapse are stark. Before the U.S.-Israeli air campaign against Iran began — what American planners have codenamed “Operation Epic Fury” — war risk premiums for Persian Gulf transits sat at roughly 0.08% to 0.1% of a vessel’s insured hull value on a standard seven-day basis, a baseline consistent with the relatively stable threat environment that followed the 2025 Houthi ceasefire. By March 3, 2026, premiums had surged to as much as 1% of vessel value, even for ships not planning to breach the Strait itself — and underwriters were in some cases declining to quote at all. For a VLCC valued at $120 million, that translates into a single-voyage war risk bill of $1.2 million, versus roughly $96,000 three weeks ago.
The structural driver of this repricing is reinsurance. London’s wholesale marine market does not carry that exposure on its own books — it cedes most of the risk upward to a small group of global reinsurers. When those reinsurers withdrew their support for Gulf war risk extensions in the 72 hours following the February 28 strikes, the primary market followed instantly. The Joint War Committee of Lloyd’s Market Association moved swiftly to expand its list of designated high-risk areas to include Bahrain, Djibouti, Kuwait, Oman, and Qatar — a designation that automatically triggers reset clauses in thousands of charter party agreements and financing contracts worldwide.
The Insurer Exodus: A 72-Hour Cancellation Wave
The mechanics of what happened over March 1 and 2 deserve examination, because they reveal a structural vulnerability that no political guarantee — however loudly announced — can easily override.
All 12 members of the International Group of P&I Clubs, the mutual insurance cooperatives that together cover liability risks for approximately 90% of the world’s ocean-going merchant fleet, simultaneously issued 72-hour notices of cancellation for war risk extensions attached to their Gulf policies. Among the prominent names announcing cancellations effective March 5: Gard, Skuld, NorthStandard, the London P&I Club, and the American Club. Japan’s MS&AD Insurance Group separately suspended new underwriting across a broader range of war risk policies covering waters near Iran, Israel, and neighboring countries.
Skuld stated it was working on a buy-back option to reinstate cover at higher premiums. But the key phrase is “higher premiums” — the market was not withdrawing because the risk was uninsurable in principle. It was withdrawing because reinsurers needed to reset pricing to a level that reflected a genuine war environment, not a residual geopolitical tension premium. The parallel to 2022 is instructive: after Russia invaded Ukraine, insurers cancelled Black Sea war risk extensions before new cover was eventually negotiated — at vastly higher cost — as grain exports resumed months later under new terms. The Hormuz situation is structurally similar, but geographically more consequential.
What distinguishes this moment from previous Gulf shipping crises is the breadth of the insurer pullback. During the 1987–1988 Tanker Wars, the market stayed open — pricing adjusted but never fully closed. Today, the combination of advanced Iranian drone technology, demonstrated willingness to target vessels from multiple flags, and an IRGC commander’s declaration that the Strait is “closed” and any vessel attempting passage would be set ablaze has created what Munro Anderson of Vessel Protect, a war insurance specialist within Pen Underwriting, described as a “de facto closure of the strait based primarily on perception of threat rather than tangible blockade.” Perception, in insurance markets, is reality.
Industry leaders at BIMCO, the global shipping association, have additionally warned that vessels with business connections to the United States or Israel may face difficulty obtaining coverage at any price, introducing a politically discriminatory dimension to coverage decisions that no previous Gulf crisis has featured.
Trump’s Guarantee — Bold But Operationally Thin
On Tuesday, March 3, President Trump responded with the blunt instrument of executive authority. In a post on Truth Social, he announced that he had ordered the U.S. Development Finance Corporation (DFC) to provide, “at a very reasonable price, political risk insurance and guarantees for the Financial Security of ALL Maritime Trade, especially Energy, traveling through the Gulf.” He added that the U.S. Navy would begin escorting tankers through the Strait of Hormuz “if necessary.”
The announcement produced an immediate, if partial, market response. Brent crude pulled back from its intraday high following Trump’s post, trading around $79 to $82 a barrel rather than testing the $90 threshold analysts had feared, though the price still represented a 13% surge from the pre-conflict level of approximately $68 in early February. U.S. stocks trimmed their steepest losses of the session. The Dow, which had been down more than 1,200 points at its low, recovered to a decline of around 300.
But the relief was fragile, because the details behind the headline are deeply problematic.
The DFC is a development finance agency — its mandate is to mobilize private capital in emerging markets, and it offers political risk insurance primarily to protect U.S. companies from losses due to expropriation or political violence in developing countries. Trump’s announcement would require the DFC to sell insurance to shipping companies of all nationalities — a scope of coverage far beyond what the agency has ever underwritten, for risks far beyond its existing actuarial expertise. No mechanism was announced. No pricing was offered. No implementation timeline was given. The White House press office did not respond to requests for further detail.
The Navy escort dimension is, if anything, even more constrained. According to Lloyd’s List, U.S. Navy officials have already privately told tanker executives that the sea service does not currently have the operational availability to provide Hormuz escorts. An estimated one-third of the deployed U.S. fleet is already committed to Middle East operations, engaged in Tomahawk strike missions and air defense of Gulf states that have themselves been targeted by Iranian missiles. The word “if necessary” in Trump’s post is doing considerable heavy lifting.
Economic Fallout: From Gulf to Gasoline Pump
The damage to the broader global economy is unfolding along several distinct channels, and the speed of transmission is faster than in any previous oil shock.
Shipping rates have collapsed into records — in the wrong direction. The benchmark freight rate for VLCCs hauling crude from the Middle East to China climbed to $423,736 per day, more than double the level from the previous session — an all-time record — even as vessels decline to actually make the voyage. Hapag-Lloyd has imposed war risk surcharges of $1,500 per standard container for Arabian Gulf cargo; CMA CGM has introduced an Emergency Conflict Surcharge of $2,000 per container. These costs will be passed to cargo owners, then to manufacturers, then to consumers.
Oil prices are embedding a new floor. Brent crude has risen approximately 13% since February 28, touching $82 per barrel. With roughly 20 million barrels per day transiting the Strait in normal times — equivalent to 20% of global petroleum consumption — analysts at Goldman Sachs and Barclays have warned that a sustained closure could push Brent toward $100 and beyond. Gregory Daco, chief economist at EY-Parthenon, has placed his outer-range forecast at $110 per barrel if the disruption persists through year-end.
American consumers are already feeling the sting. The national average price for a gallon of regular gasoline rose 11 cents overnight to $3.11 — the largest single-day increase since Russia invaded Ukraine in March 2022 — reversing what the Trump administration had spent months celebrating as an energy-price success story heading into midterm election season. Mark Zandi, chief economist at Moody’s Analytics, offered the macro arithmetic: a $10 per barrel increase in oil prices translates into a 25-cent rise in the average gallon of gasoline, $50 billion in additional annual consumer spending, and a 15-basis-point drag on real GDP.
Asia faces an existential energy reckoning. In 2024, 84% of the crude oil and condensate flowing through the Strait of Hormuz was destined for Asian markets, with China, India, Japan, and South Korea accounting for roughly 69% of all Hormuz crude flows. Japan sources close to three-quarters of its crude oil via the Strait. South Korea sources roughly 60%. India sources approximately half its crude and a significant proportion of its LNG through the same waterway. Thailand, with net oil imports equivalent to 4.7% of GDP, faces perhaps the most acute near-term current account shock among major Asian economies, with every 10% rise in oil prices worsening its current account balance by around 0.5 percentage points of GDP.
Qatar, meanwhile, has halted LNG production at Ras Laffan, one of the world’s largest natural gas production and export terminals, cutting off 20% of global LNG supply and triggering emergency price spikes in European gas markets that had only recently stabilized from the post-Ukraine disruptions.
Hamad Hussain, climate and commodities economist at Capital Economics, has warned that oil prices sustained at $100 per barrel would add 0.6 to 0.7 percentage points to global inflation. Analysts at various institutions estimate a prolonged Hormuz closure could shave approximately 0.8% from global GDP through cascading energy, freight, and trade channel effects — a contraction equivalent to wiping out the annual economic output of a medium-sized European economy.
What Happens Next: Three Scenarios
Scenario One: Military Suppression Reopens the Strait Within Weeks. If U.S. and Israeli strikes succeed in degrading Iran’s anti-ship missile, drone, and mining capabilities, and if diplomatic back-channels produce an informal understanding within three to four weeks, war risk premiums could retreat to 0.3–0.4% — elevated but not prohibitive. The DFC insurance mechanism, however imperfect, may provide enough of a bridge to keep some tankers moving, supplemented by Saudi Arabia diverting crude through its East-West pipeline to Red Sea ports. The pipeline can handle approximately 2.6 million barrels per day — meaningful relief, but far short of the 20 million barrels per day that Hormuz normally carries.
Scenario Two: Protracted Conflict, Partial Rerouting. A war lasting two to three months would force a fundamental restructuring of Asian energy sourcing. China would aggressively compete for Atlantic and West African crude cargoes, tightening supply across the entire Pacific basin and pushing prices sharply higher. Cape of Good Hope rerouting adds roughly 12 to 14 days to a Middle East-to-China voyage, absorbing vessel capacity and compounding freight rates. Insurance markets would gradually reopen at a new, permanently higher risk premium — probably 0.4 to 0.6% — as the reinsurance market prices in a structurally more volatile Gulf environment.
Scenario Three: Full Strategic Closure. If Iran successfully deploys naval mines in the Strait’s shipping lanes — a tactic it rehearsed extensively in its 2026 military exercises — and if mining operations survive U.S. suppression efforts, the disruption could extend for months. In this scenario, oil prices reaching $110 to $130 per barrel becomes the base case, not the tail risk. Ali Vaez, director of the Iran project at the International Crisis Group, has described this as a scenario where prices would “gap violently upward on fear alone,” with financial conditions tightening globally, inflation surging by 2 to 4 percentage points, and fragile economies sliding toward recession “in a matter of weeks.”
Expert Voices: What the Market Is Actually Saying
“The underwriters are waiting to see what happens, and I think most sensible shipowners are waiting to see,” David Smith of McGill & Partners told S&P Global. “No shipowner wants to put either his asset, and more importantly his crew, in danger. They’ll look for every alternative.”
Peter Sand, chief analyst at freight pricing platform Xeneta, described the situation as “the further weaponisation of trade,” adding that the crisis had shattered any remaining hopes of a large-scale return of container shipping to the Red Sea in 2026 — plans that had been cautiously rebuilding after the Houthi ceasefire.
Dylan Mortimer, marine hull UK war leader at Marsh McLennan, wrote in a client advisory that the primary risks centre on vessel boarding and seizure by Iranian forces and the potential closure of the Strait — risks that standard commercial reinsurance models are simply not calibrated to price in a sustained, active-war scenario.
The Deeper Structural Question
The 2026 Hormuz crisis has exposed something more troubling than any single insurance rate: the fragility of a global energy system built on the assumption that the Strait would remain perpetually open. For 40 years, planners, economists, and geopoliticians treated Hormuz closure as a theoretical extreme scenario — a catastrophic tail risk too costly for any rational actor to actually pursue. That assumption has now been shattered.
Trump’s DFC guarantee, however symbolically powerful, cannot substitute for the decades of diplomatic architecture — the JCPOA framework, the UN nuclear monitoring regime, the back-channel communications between Washington and Tehran — that collapsed over the past several years. The hard truth is that political risk insurance from a development finance agency is not a substitute for geopolitical stability. It is, at best, a tourniquet.
What markets and policymakers are finally being forced to confront is a question that energy security analysts have raised for years: how long can the world’s most critical chokepoint be treated as a geopolitical externality, managed through deterrence alone, without investing in the diplomatic, infrastructure, and energy-transition alternatives that would genuinely reduce its leverage? The insurance market already has its answer. It is priced at 1% of hull value, per week, with cover increasingly hard to find.
The tankers remain at anchor. The gasoline pumps are turning.
Sources & Further Reading
- S&P Global Market Intelligence: “Marine War Insurance for Hormuz Dries Up” — Primary source for insurer pullback mechanics and premium rates
- CNBC: “US-Iran War Live Updates” — VLCC freight rate records, oil price data, market reaction to Trump’s announcement
- Al Jazeera: “Maritime Insurers Cancel War Risk Cover in Gulf” — Insurer names, 72-hour cancellation notices, premium data
- Maritime Executive: “Trump: U.S. Will Provide Risk Insurance for All Shipping in the Gulf” — DFC mandate scope, Navy escort limitations, Operation Earnest Will comparison
- USNI News: “Trump: U.S. Navy May Escort Tankers Through Strait of Hormuz” — Navy capacity constraints, fleet disposition
- Axios: “Trump Offers U.S. Insurance, Military Escorts to Energy Tankers” — Gasoline price data, political risk framing
- CNBC: “Strait of Hormuz Closure: Which Countries Will Be Hit the Most” — Country-by-country exposure analysis, Kpler data, Nomura framework
- Seatrade Maritime: “The Strait of Hormuz Crisis and Its Devastating Impact on Asia-Gulf Trade” — Asian import exposure data, LNG halt at Ras Laffan
- ABC News: “Why Unrest in the Strait of Hormuz Is Leading to Rising Oil Prices” — Zandi/Moody’s macro multipliers, GasBuddy gasoline data
- U.S. Energy Information Administration: “Amid Regional Conflict, the Strait of Hormuz Remains Critical Oil Chokepoint” — Authoritative baseline data on Hormuz flows and bypass infrastructure
- Windward Maritime AI: “Strait of Hormuz Shipping Falls After Insurance Pullback” — 80% traffic decline data, P&I club mechanics
- Wikipedia: “2026 Strait of Hormuz Crisis” — Consolidated event timeline and oil price data
- Claims Journal / Bloomberg: “Trump Says U.S. Will Escort, Insure Oil Tankers Amid the Iran War” — Bob McNally quote, DFC implementation uncertainty
Discover more from The Economy
Subscribe to get the latest posts sent to your email.


Insurance renewal season is landing on households at the worst possible moment: auto insurance quotes are climbing again after a brief 2025 reprieve, health insurance plans on the ACA marketplace are seeing the steepest premium jump since 2018, and inflation in medical, repair, and litigation costs is compounding across every line of coverage simultaneously. This is not a single-cause story. It is three distinct inflationary engines — repair-cost inflation, medical-cost inflation, and legal/regulatory disruption — converging on the same renewal notices at the same time.
Key Takeaways
- Auto insurance premiums are projected to rise in 32 states by the end of 2026, reversing 2025’s national 6% decline, with the average full-coverage premium reaching approximately $2,158–$2,256 annually.
- ACA marketplace health insurance plans show a 26% average premium increase for 2026 — the largest since 2018 — driven by rising hospital costs, GLP-1 weight-management drug spending, and the expiration of enhanced premium tax credits.
- If enhanced subsidies are not extended, marketplace enrollees could see net premium payments more than double, with some households spending over half their income on coverage.
- Employer-sponsored health coverage costs are projected to rise another 6–7% in 2026 after already increasing 5.6% in 2025.
- High-risk driver categories (DUI history, low credit, teen drivers) are seeing disproportionately large increases even in states where average premiums are stabilizing.
Auto Insurance: The 2025 Relief Was Temporary
After auto insurance quotes fell nationally by about 6% in 2025 — with 39 states seeing declines and several cutting rates by more than 20% — 2026 has reversed that trend. Insurify’s midyear data shows 27 states already recording increases in the first half of the year, with 32 states projected to see higher rates by year-end. The average full-coverage premium is tracking toward $2,158–$2,256 annually, a modest 1–3% increase depending on the data source, but the state-level variance tells the real story.
| State Trend | Example States | Driver |
|---|---|---|
| Largest projected increases | Connecticut (+4%), West Virginia (+3%) | Rate “normalization” after historically low pricing |
| Largest historical 3-year increases | Illinois (+41% over 3 years) | Nearly double the national average pace |
| States still seeing relief | New York (-13% past 12 months) | Falling fatal crash rates, improved loss ratios |
| Highest absolute premiums | Washington D.C. (~$4,017/year in 2025) | Density, litigation costs, claims frequency |
Three structural forces are driving the reversal:
- Repair-cost inflation tied to tariffs. Auto insurers have publicly flagged that tariff-driven increases in parts costs have not yet been fully passed through to consumers — meaning 2026 premium filings are likely understating the eventual impact.
- Rising medical/bodily-injury claim costs. Medical inflation has pushed up the cost of bodily injury liability claims substantially through 2024–2026, with higher ER visits and long-term treatment costs flowing directly into liability coverage pricing.
- “Social inflation.” Rising jury awards and legal settlement costs, particularly concentrated in states like Louisiana and Florida, are pushing insurers to reprice risk more aggressively regardless of an individual driver’s claims history.
A Widening Risk-Based Pricing Gap
The most important trend for consumers shopping auto insurance quotes in Q4 2026 is the divergence between low-risk and high-risk pricing. While full-coverage premiums for clean-record drivers dipped modestly, DUI-related premiums jumped roughly 35% and teen driver premiums rose about 17% in the same period. Insurers are moving away from broad, blanket rate hikes toward sharply targeted, risk-based pricing — meaning the “average premium” figure increasingly understates what any specific household will actually pay.
Health Insurance: The Subsidy Cliff Returns
The health insurance plans story for 2026 is dominated by one policy event: the expiration of enhanced Affordable Care Act premium tax credits that have kept marketplace coverage affordable since 2021. The numbers are stark:
| Metric | 2026 Figure |
|---|---|
| Average ACA marketplace premium increase | 26% (30% in federal Healthcare.gov states, 17% in state-run exchanges) |
| Median proposed insurer rate increase | 18% |
| Portion of increase attributable to subsidy-expiration assumptions | ~4 percentage points |
| Potential net premium increase for subsidized enrollees if credits expire fully | 114%+ (more than double) |
| Subsidy eligibility cliff | 400% of Federal Poverty Level ($62,600 individual / $128,600 family of four) |
| Marketplace enrollees currently receiving subsidies | ~87–92% |
This is the largest ACA rate increase since 2018, the last time comparable federal policy uncertainty disrupted the market. The mechanism is a textbook “adverse selection” spiral: as premiums rise for those losing subsidies, healthier enrollees are expected to exit the marketplace at a disproportionately higher rate than sicker enrollees, which pushes insurers to price in an even less healthy risk pool — a dynamic insurers and policy experts have explicitly warned could become a “death spiral” without legislative intervention.
Illustrative case: A 40-year-old in Indianapolis earning $65,000 on a mid-tier Silver plan saw their subsidized monthly premium of $316 (versus an unsubsidized $388) climb sharply once the enhanced credits expired — with some households above the 400% FPL threshold facing bronze-plan costs exceeding half their household income.
Employer-Sponsored Coverage Is Not Immune
While ACA marketplace changes dominate headlines, employer-sponsored health insurance plans are compounding the same underlying cost pressures. Average annual premiums reached roughly $9,300 for single coverage and $27,000 for family coverage in 2025 — up 5.6% — with a further 6–7% increase projected for 2026, driven by specialty drug costs (notably GLP-1 medications), higher utilization, and healthcare wage inflation. Employers passing along even a portion of that increase means higher payroll deductions, higher deductibles, and narrower networks for millions of covered workers who never touch the ACA marketplace at all.
Life Insurance: The Quiet Line in an Inflationary Environment
Term life insurance has been less volatile than auto or health coverage in 2026, but it is not immune to the same underlying cost pressures. Underwriting costs tied to medical examination and actuarial mortality assumptions are gradually reflecting the same medical-cost inflation hitting health insurers, while insurers’ own investment portfolios — sensitive to the same Treasury yield volatility driving mortgage rates — affect how aggressively term life products are priced and how competitively insurers can guarantee long-duration rate locks. For consumers, the practical implication is straightforward: locking in a term life policy sooner rather than later insulates against future underwriting-cost inflation, particularly for buyers over 50, where premiums are most sensitive to medical-cost trends.
A Household Insurance Cost-Management Framework for Q4 2026
| Coverage Type | Primary 2026 Risk | Recommended Action |
|---|---|---|
| Auto insurance | Risk-based repricing; state-level variance | Shop annually; ask specifically about DUI/teen-driver surcharges |
| ACA health insurance | Subsidy-cliff exposure above 400% FPL | Model both subsidized and full-price scenarios before open enrollment |
| Employer health insurance | Passthrough of 6–7% cost growth | Review HSA/FSA contribution levels; evaluate high-deductible tradeoffs |
| Term life insurance | Gradual underwriting-cost inflation | Lock in coverage now rather than deferring to a later renewal cycle |
FAQ
Why are auto insurance quotes rising again in 2026 after falling in 2025? 2025’s rate declines were largely a correction after insurers had already repriced for pandemic-era claims inflation. In 2026, rising repair costs (partly tariff-driven), medical-cost inflation on bodily injury claims, and “social inflation” from rising legal settlements are pushing rates back up in most states.
How much will my ACA health insurance plan premium increase in 2026? The average marketplace premium increase is 26%, but the actual impact depends heavily on your income relative to 400% of the federal poverty level. Enrollees below that threshold retain some subsidy protection; those above it face the full, unsubsidized rate increase.
Is now a good time to buy term life insurance? Yes — underwriting costs are gradually rising alongside broader medical-cost inflation, so locking in a term life policy now generally secures a more favorable long-term rate than waiting for a future renewal cycle.
Which drivers are seeing the biggest auto insurance increases? High-risk categories are seeing disproportionate increases: DUI-related premiums rose roughly 35% and teen driver premiums rose roughly 17% in the most recent reporting period, even in states where average premiums for low-risk drivers were flat or falling.
Discover more from The Economy
Subscribe to get the latest posts sent to your email.

The days of pulling generic auto insurance quotes based purely on your zip code and age are officially over. In 2026, insurance comparison engines are powered entirely by generative AI and real-time telematics. These platforms digest thousands of live data points—ranging from your driving smoothness via connected vehicle sensors to real-time traffic congestion patterns—to generate hyper-personalized premiums instantly.
For consumers, this evolution represents both a massive opportunity for savings and a hidden trap for penalty pricing. Understanding how AI algorithms evaluate risk is essential for anyone looking to lower their monthly auto insurance premiums.
How AI Comparison Engines Evaluate Your Risk Profile
Behavioral Telematics and Connected Cars
Modern cars stream performance data directly to insurance aggregators. Generative AI models analyze braking sharpness, acceleration curves, cornering G-forces, and phone distraction metrics. Drivers who maintain smooth, defensive habits are rewarded with dynamic rate cuts of up to 40% compared to traditional rating tiers.
Predictive Traffic and Weather Modeling
AI tools now cross-reference your daily commute route with predictive weather and accident probability models. If your standard parking location or driving corridor has a statistically higher incidence of uninsured motorist claims, your quotes will reflect that hyper-local risk assessment.
| Comparison Factor | Traditional Rating Model | 2026 Generative AI Model | Impact on Premium |
| Mileage & Usage | Annual estimated odometer reading | GPS tracking & live trip duration | High (up to 35% savings) |
| Driving Behavior | MVR driving record & accidents | Real-time braking, speed, & G-force | Critical (determines tier) |
| Vehicle Tech | Make, model, and safety rating | ADAS calibration & repair cost data | Moderate |
Strategies to Lower Your AI-Driven Insurance Quote
To outsmart the algorithm and secure the lowest possible premium in 2026, drivers must proactively manage their digital footprint on insurance platforms.
Opt-In for Telematics Trial Periods: Many insurers offer immediate 15% discounts just for installing their driving app; let it track safe habits for 30 days to lock in permanent savings.
Scrub Unverified Public Records: Ensure your motor vehicle report is free of clerical errors that AI risk models misinterpret as reckless behavior.
Compare AI Aggregators: Use platforms that integrate multi-carrier API feeds rather than single-brand comparison sites to find the best risk-adjusted rate.
“Industry Note: AI-driven pricing rewards transparency and precision. Drivers who actively manage their telematics data consistently out-save those relying on legacy quote calculators.”
Embracing AI comparison tools allows savvy policyholders to customize coverage limits precisely to their driving habits, eliminating wasted premium spend while ensuring robust protection.
Discover more from The Economy
Subscribe to get the latest posts sent to your email.
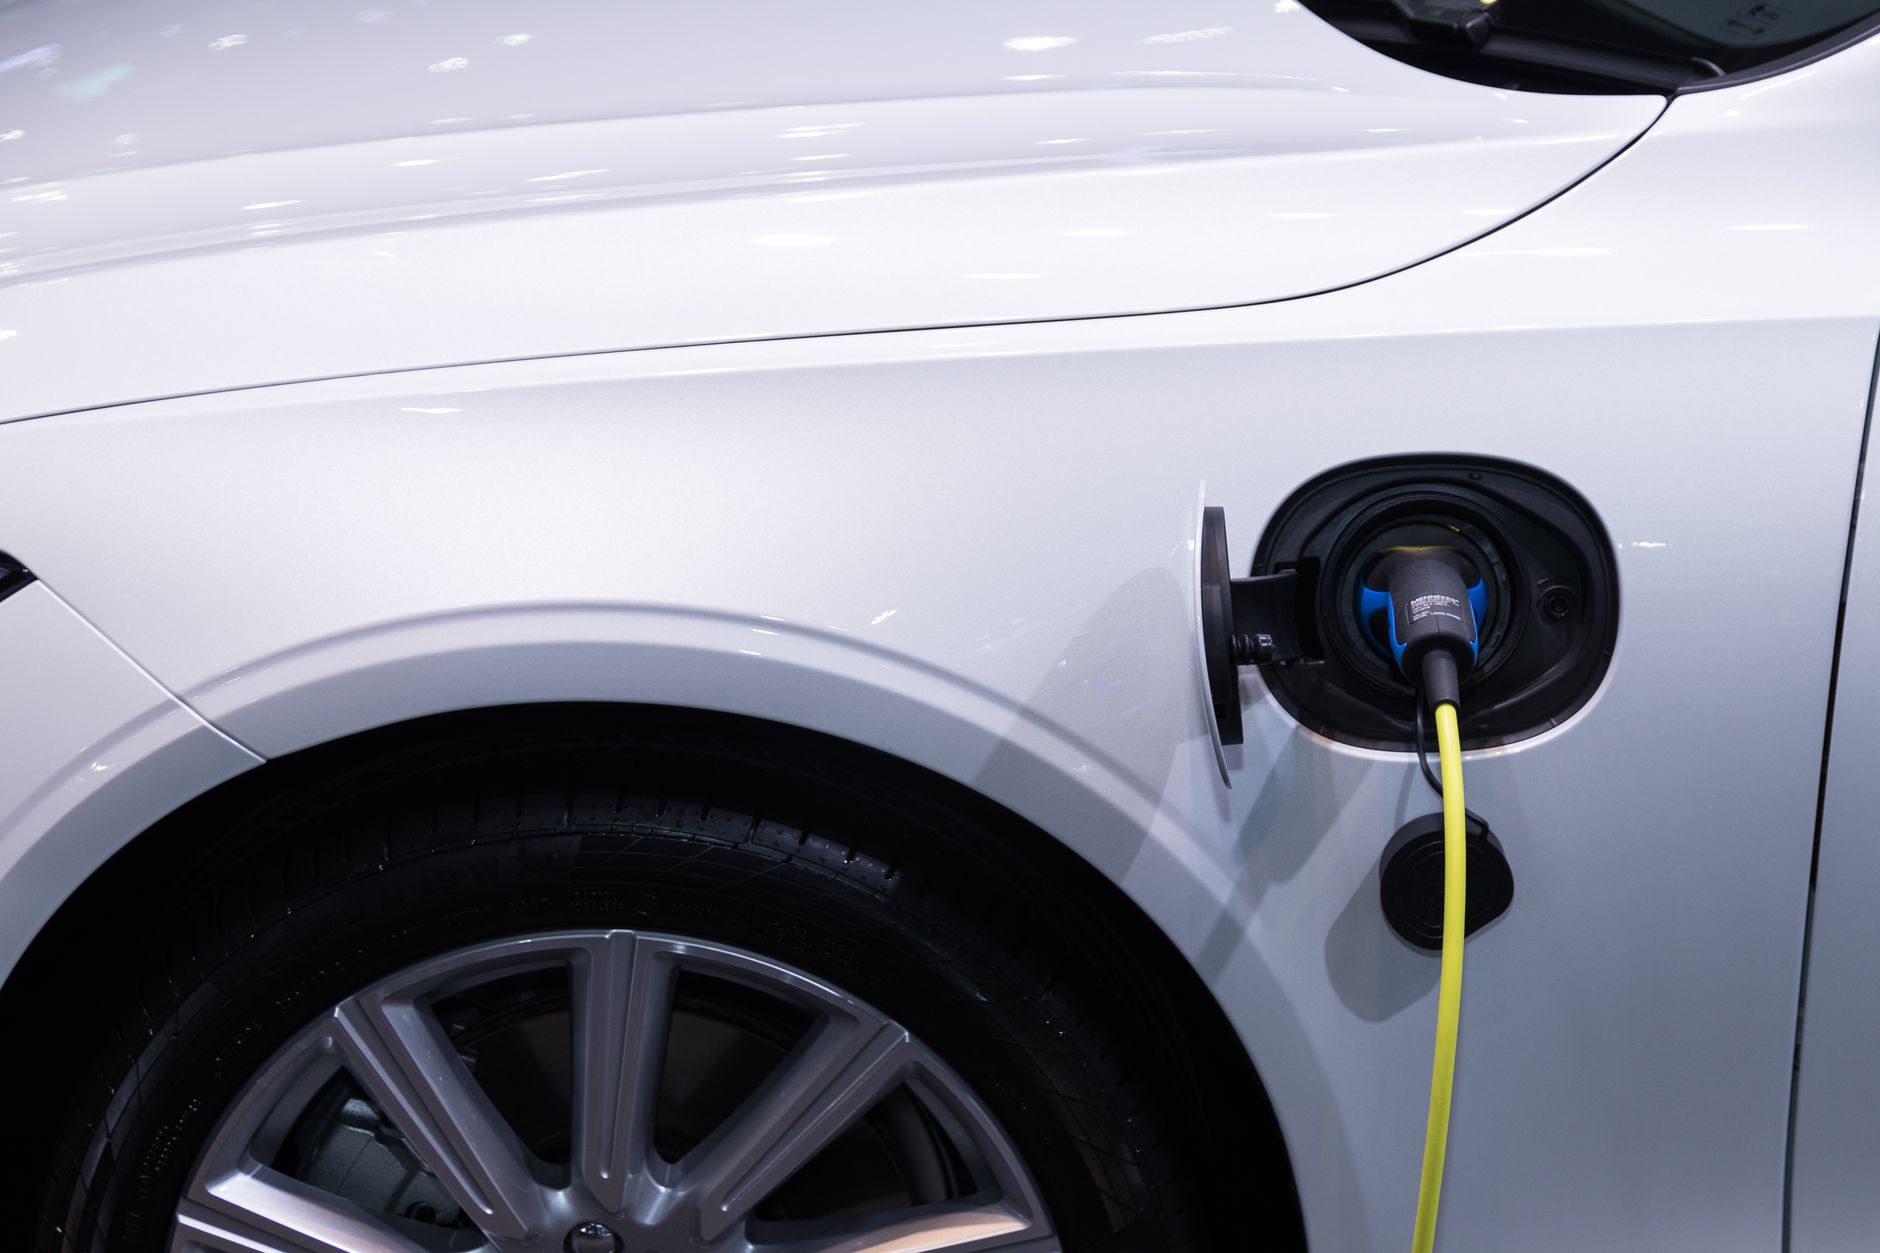
The electric vehicle pitch has always rested on a simple financial promise: fewer moving parts, lower fuel costs, and reduced routine maintenance. That promise is largely holding up in 2026 — but it obscures a second, less-discussed cost center that has grown more expensive, not less: insurance. For buyers and financing professionals evaluating total cost of ownership in 2026, the real story is a financial trade-off between genuine maintenance savings and a meaningfully higher insurance burden driven by battery economics.
Key Takeaways
- EVs cost about $330 less per year in routine maintenance than gas-powered vehicles, averaging roughly $949 annually versus higher combustion-engine upkeep, according to AAA driving-cost research — the “fewer moving parts” savings claim holds up in the data.
- EV insurance premiums run 15–42% higher than comparable gas vehicles, with 2026 estimates from Insurify putting average monthly EV insurance at $263 versus $185 for gas-engine cars.
- Battery pack replacement costs range from $4,000 to $22,000 depending on model and pack size, typically representing 30–40% of a vehicle’s total value — the single largest driver of elevated comprehensive and collision premiums.
- The average new EV cost $55,300 as of February 2026, per Cox Automotive — about $6,532 more than the average new gas vehicle — while used EVs have narrowed to just $1,334 above used gas-vehicle pricing.
- Car insurance rates broadly are projected to rise in 32 US states by the end of 2026, meaning EV owners face a double pressure: category-specific EV premiums layered on top of a generally rising rate environment.
The Maintenance Savings Case: Still Real, Still Meaningful
The mechanical simplicity argument for EVs remains well-supported by 2026 data. Electric vehicles have no oil changes, no transmission fluid service, no timing belt replacement, and no exhaust system — eliminating an entire category of scheduled maintenance that combustion vehicles require throughout their ownership life. AAA’s driving-cost research puts the resulting savings at roughly $330 per year, with average annual EV maintenance costs near $949.
This savings is real and durable, but it is smaller in absolute dollar terms than many buyers assume, and — critically for total-cost-of-ownership modeling — it is frequently outweighed by the insurance side of the ledger for higher-value EV models.
The Insurance Cost Reality: Where the Math Shifts
Where the EV financial story gets more complicated is insurance. Multiple 2026 data sources converge on a consistent range: EVs cost between 15% and 42% more to insure than comparable gas-powered vehicles, depending on the specific models compared and the data provider’s methodology. Insurify’s 2026 figures put the average monthly premium for a gas-engine vehicle at $185, versus roughly $263 for an EV — a 42% premium gap. Full-coverage annual premiums across a range of EV models span more than $8,000, from around $1,947 for a Chevrolet Silverado EV up to $10,402 for a higher-end model like the Audi SQ8 e-tron.
Why EV Insurance Costs More
- Higher replacement value. EVs generally carry a higher purchase price than comparable gas vehicles, which insurers translate directly into higher comprehensive and collision exposure.
- Proprietary parts and limited aftermarket competition. Many EV manufacturers — Tesla being the most cited example, alongside Rivian and Lucid — rely on proprietary components with no aftermarket alternative, keeping repair costs elevated and uncompetitive.
- Specialized labor scarcity. EV repairs require technicians trained on high-voltage systems and advanced driver-assistance technology; the limited pool of qualified shops reduces price competition on labor.
- Sensor and ADAS recalibration costs. A minor collision can cost roughly twice as much to repair on some EVs compared to an equivalent gas vehicle, due to the sensor recalibration required after even minor bodywork.
Battery Replacement: The Core Financial Risk
The battery pack is the single most consequential cost variable in EV ownership economics. Replacement costs in 2026 range from approximately $4,000 to $22,000 depending on the vehicle and pack size, and this single component typically represents 30% to 40% of a vehicle’s total value — a concentration of risk that has no real analog in combustion-engine vehicles, where no single component approaches that share of total vehicle value.
This concentration explains why insurers price EV comprehensive and collision coverage more conservatively: a covered loss involving battery damage exposes the insurer to a claim that can represent a third or more of the vehicle’s insured value in a single event.
Battery Risk Exposure Framework
A useful way to frame the uninsured risk gap for financing and insurance planning:
Annual Uninsured Risk = Battery Replacement Cost ÷ Remaining Warranty Years
Example: a $16,000 battery replacement cost against 4 remaining warranty years implies $4,000 in annual uninsured risk exposure once the manufacturer warranty lapses — a figure that should directly inform decisions around extended mechanical breakdown insurance (MBI) and battery-specific coverage riders.
What Standard Policies Actually Cover
Standard auto policies generally cover EV battery damage caused by a covered event — collision, fire, vandalism, or storm damage — under standard collision or comprehensive coverage, minus the policy deductible. However, normal battery wear and gradual capacity degradation are typically excluded from auto insurance entirely and fall instead under the manufacturer’s warranty or an extended service plan — a gap that becomes financially material as vehicles age past the typical 8-year/100,000-mile battery warranty window common across the industry.
Total Cost of Ownership: Running the Numbers
| Cost Category | EV (2026 average) | Gas Vehicle (2026 average) |
|---|---|---|
| Average new vehicle price | $55,300 | ~$48,768 |
| Average annual maintenance | ~$949 | ~$1,279 |
| Average monthly insurance premium | ~$263 | ~$185 |
| Battery/engine catastrophic replacement risk | $4,000–$22,000 (30–40% of vehicle value) | Comparatively lower, more distributed |
Even accounting for roughly $1,850–$2,800 in annual net advantage that some EV-focused ownership models calculate once fuel savings, amortized tax incentives, and maintenance savings are weighed against the insurance premium gap, the insurance line item alone can erase a meaningful share of the EV’s headline savings case for buyers who do not shop insurance carefully.
Financing and Insurance Strategies for 2026 EV Buyers
- Shop EV-specific insurance discounts explicitly. Green-vehicle or EV-specific rate reductions exist at many carriers but are frequently not advertised — buyers should ask directly rather than assume a standard quote reflects the best available EV rate.
- Evaluate usage-based/telematics insurance. EV owners with shorter commutes and predominantly home charging are strong candidates for pay-per-mile or telematics-based policies, which can meaningfully offset the base-rate premium gap.
- Model mechanical breakdown insurance against the battery risk formula above. For most EVs on the market in 2026, the annual uninsured risk from a post-warranty battery failure exceeds ten times the cost of a typical MBI premium — a favorable risk-transfer trade for most buyers.
- Weigh used EV pricing carefully. With used EV pricing now only about $1,334 above comparable used gas vehicles, the total-cost-of-ownership case for used EVs has improved meaningfully relative to new EVs, where the price premium remains over $6,500.
Frequently Asked Questions
Are EVs cheaper to maintain than gas cars in 2026?
Yes for routine maintenance — EVs save owners roughly $330 per year on average by eliminating oil changes and other combustion-specific servicing — but this saving is frequently offset by higher insurance premiums.
Why is EV insurance more expensive than gas car insurance?
EV insurance runs 15–42% higher due to higher vehicle replacement values, expensive proprietary battery and sensor components, limited aftermarket parts competition, and a smaller pool of specialized repair technicians.
How much does an EV battery replacement cost in 2026?
Battery replacement costs range from approximately $4,000 to $22,000 depending on the vehicle and battery pack size, typically representing 30–40% of the vehicle’s total value.
Conclusion
The EV total-cost-of-ownership picture in 2026 is more nuanced than either enthusiasts or skeptics typically present: the maintenance-savings case remains genuinely true, but it is a smaller number than most buyers expect, while the insurance cost gap — driven overwhelmingly by battery economics — has grown into a comparably sized, and in some cases larger, financial factor. Buyers, financing professionals, and insurers evaluating EVs in 2026 need a total-cost model that weighs both sides of this ledger explicitly, rather than relying on the maintenance-savings narrative alone.
Discover more from The Economy
Subscribe to get the latest posts sent to your email.

Balance of Payments (BOP)

The Falkland Islands Dispute: Sovereign Wealth, Offshore Drilling, and Market Impacts

Gross Domestic Product (GDP): Nominal vs. Real

What is Inflation and the Consumer Price Index (CPI)?

US-China Trade Competition 2026: Supply Chain Relocation Guide

Oil Prices Break $100 in 2026: Middle East Conflict & Energy Markets

South-South Trade Expansion: Digital Integration and Emerging Market Growth

$166B Tariff Refund Tapering Fast: Is Your Business Missing Out?

Stock Market Today: Dow Climbs 500 Points as Markets Shake Off Inflation Jitters

14th WTO Conference 2026: Tariffs & Global Supply Chain Impact

Swish Secures $24M Funding to Disrupt India’s $100B Food Market

Physical AI and Driverless Tech: The Next Trillion-Dollar Industrial Revolution

Enterprise AI Platforms Disrupting B2B SaaS in 2026: Full Analysis

Crypto vs. Safe Haven Assets 2026: Where Institutions Are Hedging

State Farm’s $5B Dividend 2026: Who Qualifies & Payout Dates

US-China Relations in Q3 2026: Trade Tariffs and Supply Chain Risks

Gold’s Wild 2026: From a Record $5,600 Peak to a 24% Crash and Back Toward $4,500

Oil Surges as Strait of Hormuz Traffic Collapses Again

The Rocket That Won’t Quit: Inside SpaceX’s Falcon 9 Launch Machine

Bank of England Set to Hold Rates Through Year-End, Reuters Poll Shows

SpaceX Starship Flight 14: First Orbital Attempt & Starlink V3 Launch Explained

The 2026 Crypto Regulatory Shift: What It Means for Institutional Investors

AI Chip Stocks 2026: The Best Semiconductor Investments Beyond Marvell

Retail Earnings Week: What Home Depot, Target & Walmart Reveal

AI-Powered Training: The Next Multi-Billion Dollar Ecosystem in Fitness

Russia’s Black Sea Oil Exports Fall for a Fifth Straight Week

Global Chip Selloff Deepens: What’s Driving the Aug. 19 Semiconductor Rout

Tween Back-to-School Trends 2026: What’s Driving the $85B Season
-

 Markets & Finance8 months ago
Top 15 Stocks for Investment in 2026 in PSX: Your Complete Guide to Pakistan’s Best Investment Opportunities
-

 Analysis7 months ago
Johor’s Investment Boom: The Hidden Costs Behind Malaysia’s Most Ambitious Economic Surge
-

 Analysis7 months ago
Top 10 Stocks for Investment in PSX for Quick Returns in 2026
-

 Analysis7 months ago
Brazil’s Rare Earth Race: US, EU, and China Compete for Critical Minerals as Tensions Rise
-

 Banks8 months ago
Best Investments in Pakistan 2026: Top 10 Low-Price Shares and Long-Term Picks for the PSX
-

 Investment8 months ago
Top 10 Mutual Fund Managers in Pakistan for Investment in 2026: A Comprehensive Guide for Optimal Returns
-

 Global Economy9 months ago
15 Most Lucrative Sectors for Investment in Pakistan: A 2025 Data-Driven Analysis
-

 Global Economy9 months ago
Pakistan’s Export Goldmine: 10 Game-Changing Markets Where Pakistani Businesses Are Winning Big in 2025