
Business
Publix Store Closures Tracker: Locations, Rebuild Status, and What’s Changing


Publix has closed several stores in 2026, mostly for rebuilds. See the closure list, which sites are being replaced, and where nearby shoppers can go.
Last verified: October 9, 2026. Store closures change often, so confirm details with Publix before making plans.
Key Takeaways
- Most 2026 Publix closures are rebuilds, not permanent exits. Publix says it “replaces supermarkets and closes supermarkets that are not meeting performance expectations.”
- Publix opened seven stores and closed eight between January and March 28, 2026. Seven of the eight closures were linked to replacement stores.
- Some closures have no announced replacement, and Publix has not explained several of them, including two Atlanta-area stores that closed in late 2025.
- Q1 2026 sales rose 2% to $16.1 billion, but comparable-store sales were flat.
- Rebuilds can leave a gap of a year or more. Check the replacement timeline and the nearest open stores before you change your shopping routine.
Search Intent Summary
Shoppers searching for Publix closures want to know whether their store is affected, when it closes, when it reopens, and where to shop in the meantime. This tracker lists the confirmed closures, separates permanent closures from rebuilds, and points to the nearest alternatives where reporting provides them.
The Closure List
The table below covers closures reported between late 2025 and September 2026. It is a snapshot, not a complete record. Publix operates more than 1,400 stores, and its own store locator is the most reliable source for any single location.
| Store and Location | Closure Date | Type | Status |
|---|---|---|---|
| 1380 Atlantic Dr NW, Atlanta, GA (Atlantic Station) | Dec. 27, 2025 | Permanent | No replacement announced; no reason given |
| 2562 Shallowford Rd NE, Chamblee, GA (Shallowford Exchange) | Dec. 27, 2025 | Permanent | No replacement announced; no reason given |
| 8250 Mills Dr, Kendall, FL (Palms at Town & Country) | Jan. 17, 2026 | Rebuild | Demolished and replaced on site; a timeline has not been given |
| 208 Saint James Ave, Goose Creek, SC | Jan. 17, 2026 | Rebuild | Entire store to be torn down and rebuilt |
| 5577 Park St N, St. Petersburg, FL (Eagles Park) | Mar. 7, 2026 | Replaced | New store opened March 12 at 6605 38th Ave |
| 4711 Babcock St NE, Palm Bay, FL | July 11, 2026 | Rebuild | Replacement store planned as part of redevelopment |
| Southdale store, West Palm Beach, FL (Store #50) | Sept. 26, 2026 | Rebuild | Opened in 1959; rebuild timeline not announced |
Two details require caution. Earlier coverage of the Atlanta closures suggested they would close in early 2026, but multiple later reports give December 27, 2025 as the date, and the table follows the later reporting. The Kendall date also appears in multiple formats across reports, so confirm it with the store before relying on it.
Permanent Closures Versus Rebuilds
The distinction matters for shoppers. A rebuild closes the old building, demolishes it, and opens a new store on the same or nearby site. Publix has said rebuilds generally take a year to 18 months, and reporting on one Florida rebuild noted that the old store typically stays closed for 12 to 15 months.
Permanent closures leave a gap. In the Atlanta cases, Publix did not explain its decision. Reporting from CBS News Atlanta found that the nearest alternative to the Shallowford Exchange store was 3.7 miles and about 13 minutes away, which is a meaningful change for shoppers who walked or used a short drive.
Where Shoppers Can Go
For the West Palm Beach Southdale store, Publix is directing customers to several nearby locations while the rebuild takes place. Those include the Village Commons store on Village Boulevard, about 5.1 miles away, the Crosstown Plaza store on North Military Trail, about 6.2 miles away, and the Greenwood Shopping Centre location in Palm Springs, about 4.1 miles away, according to WPTV’s reporting.
For the St. Petersburg Eagles Park shoppers, the replacement store at 6605 38th Ave opened five days after the old store closed. It includes a pharmacy, a liquor store, and curbside pickup and delivery options.
For Atlanta-area shoppers, reporting from the region says the closed stores have not been replaced. Check the Publix store locator for the nearest open location and its hours.
Is Publix Retreating?
The closures do not, on their own, indicate a broad exit. Publix’s 2025 activity included 52 openings, 13 of them replacements, 89 remodels, and 10 closures. Six of the 2025 closures were scheduled for on-site replacement.
The company’s 2026 spending points in the same direction. Capital spending in the first quarter reached $674 million, up from $465 million a year earlier. Publix plans roughly $2.4 billion in total spending for 2026.
Financial results show the strain. Total sales rose 2% in the first quarter, but growth came almost entirely from new stores, and comparable-store sales were flat. A new store’s revenue counts as new-store growth, which can make headline sales look stronger than same-store performance.
The company operated 1,434 stores and had more than 260,000 employees as of May 2026. Publix identifies supercenters, warehouse clubs, dollar stores, and online retailers as its main competitors.
What to Do If Your Store Is Closing
Check the Publix store locator to confirm whether your store is closing, the reopening date if known, and the nearest open location. Store closures are sometimes announced with only a few weeks’ notice, so verify before planning a trip.
If your store is being rebuilt, ask whether associates have been transferred to nearby stores. Publix has said in some cases that staff will be reassigned rather than laid off, as it did for the West Palm Beach closure.
If you rely on pharmacy services, confirm the transfer process with the nearest pharmacy before the closure date. Pharmacy prescriptions can often be transferred, but timing and eligibility depend on the store.
Future Outlook
The rebuild pattern suggests more closures and replacements over the coming year. Publix has not published a full closure schedule, so the list will keep changing. The most useful signals are the company’s quarterly SEC filings, its store locator, and local news coverage of specific sites.
Frequently Asked Questions
Is Publix closing a lot of stores in 2026?
Publix has closed several stores this year, but most closures are linked to rebuilds or replacements. The company opened seven stores and closed eight in the first quarter, with seven of the closures tied to replacement stores.
How long will a rebuilt Publix stay closed?
Publix has said rebuilds generally take a year to 18 months, and one report indicated the old store typically remains closed for 12 to 15 months. Publix often does not announce the reopening date in advance, so check the store locator for updates.
Why did Publix close the Atlanta stores?
Publix has not publicly explained the closures of its Atlantic Station and Shallowford Exchange stores. The company said it closes stores that do not meet performance expectations, but it has not given specific reasons for these locations.
Where can I shop if my Publix is closing?
Check the Publix store locator for the nearest open location. For the West Palm Beach Southdale store, Publix has pointed customers to nearby stores at Village Commons, Crosstown Plaza, and Greenwood Shopping Centre.
Discover more from The Economy
Subscribe to get the latest posts sent to your email.


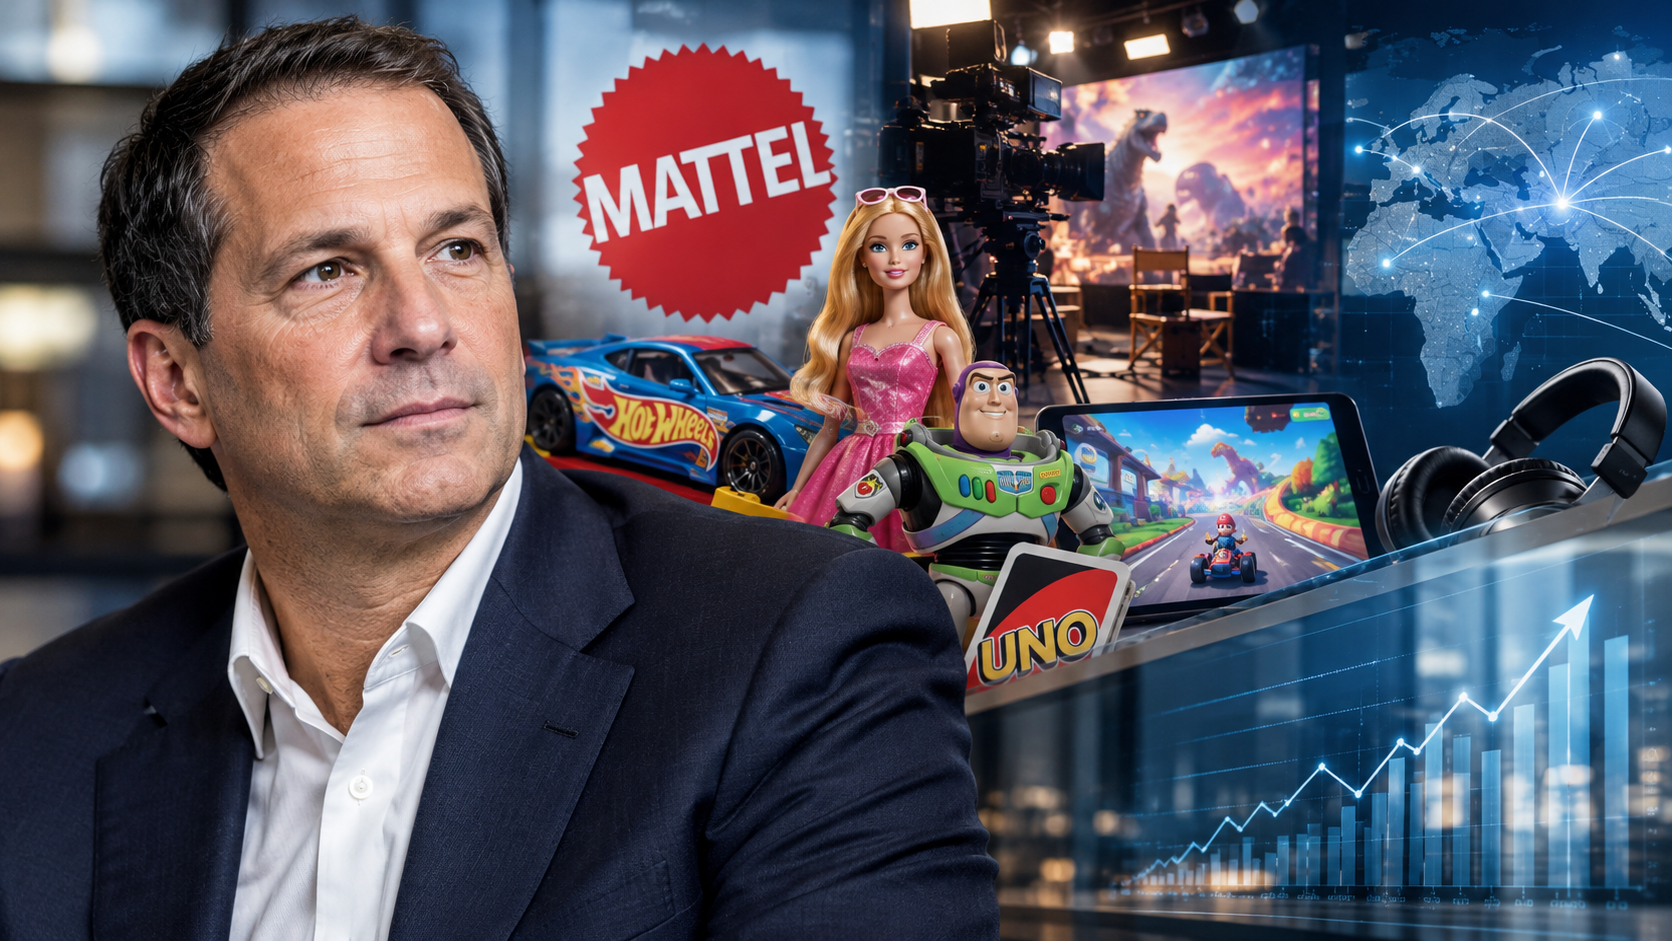
Mattel’s sales are up 10% as it builds mobile games on its franchises. Q2 2026 profits fell, so here’s how Kreiz’s strategy works and what investors should watch.
Key Takeaways
- Mattel reported Q2 2026 net sales of $1.125 billion, up 10% as reported and 9% in constant currency. The company swung to an $18 million net loss from $53 million net income a year earlier.
- Gross margin fell to 48.2% from 50.9%, driven by tariffs, inflation, higher royalties, and other cost pressures.
- The digital push is real but early. Mattel launched its first self-published mobile game, based on Masters of the Universe, and its UNO Wild title is in soft launch, with a global release expected in early 2027.
- The company reaffirmed 2026 guidance: 3% to 6% constant-currency net sales growth and adjusted EPS of $1.27 to $1.39, below 2025’s $1.49.
- Management has bought back $300 million of stock so far this year and reaffirmed a $400 million full-year target.
Search Intent Summary
People searching for Mattel and Ynon Kreiz usually want to understand the company’s turnaround strategy, whether the digital bets are paying off, and whether the financials support the stock. This analysis covers the strategy, the latest quarter, the guidance, and the risks.
The Strategy: IP-Driven Play and Family Entertainment
Kreiz has framed Mattel’s strategy as growing an “IP-driven play and family entertainment business.” In practice, that means building toys, games, and entertainment around brands the company already owns, including Hot Wheels, Barbie, Masters of the Universe, UNO, and Fisher-Price, and then extending those brands into film, television, and digital games.
The approach rests on a simple logic. A toy sold once is a single transaction, while a franchise can generate revenue across several products and platforms for years. Mattel’s Q2 release credited its brand-centric operating model and global capabilities with supporting growth across categories.
Management also points to a three-year cost program, Optimizing for Profitable Growth, which the company says is on track to deliver $225 million in savings by the end of 2026. Those savings are meant to fund the investments in digital and marketing without eroding profit.
The Digital Transformation
The digital push is Mattel’s most visible change. The clearest step came in March 2026, when the company completed full ownership of Mattel163, a mobile games studio. That gave Mattel a development team and a publishing platform rather than relying on licensing games to outside studios.
Since then, the company has launched its first self-published mobile game, based on Masters of the Universe, and has put a second title, UNO Wild, into soft launch. Management says UNO Wild has met its production milestones and expects a global commercial launch in early 2027.
The company plans to spend about $40 million on digital performance marketing, but it intends to deploy most of that when UNO Wild launches in 2027, not in 2026. That timing choice matters. It means 2026 digital results are less likely to reflect the full cost or the full benefit of the strategy.
The games business is already showing up in the numbers. Worldwide gross billings for action figures, building sets, games, and other rose 35% to $358 million in Q2, driven by games, including the full contribution of Mattel163, and by action figures tied to theatrical releases.
Q2 2026: Sales Up, Profit Down
The quarter shows the trade-off in the strategy. The top line grew while profitability fell.
| Metric | Q2 2026 | Q2 2025 | Change |
|---|---|---|---|
| Net sales | $1,125M | About $1,023M | +10% reported, +9% constant currency |
| Reported gross margin | 48.2% | 50.9% | Down 2.7 points |
| Adjusted gross margin | 48.6% | 51.2% | Down 2.6 points |
| Net income (loss) | ($18M) | $53M | Swing of about $71M |
The Q2 2025 net sales figure in the table is derived from the reported 10% growth rate, so check it against the company’s comparison table before publishing.
North America drove much of the growth, with net sales up 12%, while International rose 9%. Management highlighted growth in Hot Wheels, games, and action figures, and said Mattel gained share in vehicles and action figures, citing Circana data.
The margin pressure came from several sources. Management cited tariffs, inflation, higher royalties, and other cost pressures. Royalties are a notable point. Entertainment-linked franchises often carry royalty payments to film studios and rights holders, which rise as the franchise expands.
Guidance and What It Implies
Mattel reaffirmed its full-year 2026 outlook. The key figures are:
- Net sales growth of 3% to 6% on a constant-currency basis
- Adjusted gross margin of about 50%
- Adjusted operating income of $580 million to $630 million
- Adjusted EPS of $1.27 to $1.39
Applied to 2025 net sales of $5.348 billion, 3% to 6% growth implies roughly $5.51 billion to $5.67 billion in 2026. Set against 2025 adjusted EPS of $1.49, the adjusted EPS guidance implies a decline of about 7% to 15%. That gap is the central tension in the story: revenue is growing, but earnings are guided lower.
The guidance excludes any benefit from potential tariff refunds. If refunds materialize, they could improve results beyond the current outlook, but Mattel has not built them into its numbers.
One caveat on the EPS basis. Mattel’s Q1 release described a recast of adjusted EPS to exclude amortization of acquired intangible assets, and the figures in that release differ from those in the Q2 release. Confirm the basis used in the company’s current guidance table before quoting EPS figures.
Capital Returns
Mattel is returning cash to shareholders while it invests. The company repurchased $100 million of shares in Q2, bringing year-to-date buybacks to $300 million. It reaffirmed a full-year target of $400 million. Shares outstanding were 285.7 million at June 30, 2026.
Buybacks reduce the share count, which lifts earnings per share, but they do not add profit by themselves. Investors should separate buyback-driven EPS support from underlying growth. Adjusted operating income guidance of $580 million to $630 million is the better measure of whether the core business is improving.
Risks That Matter
Four risks stand out.
Tariffs and costs. Toys are import-heavy, and tariffs flow directly into gross margin. The Q2 margin decline shows how quickly costs can outpace pricing.
Execution in games. Mobile games are a hit-driven business. Masters of the Universe and UNO Wild have to find audiences at a reasonable cost. The company has not yet disclosed profitability for its self-published titles.
Royalty and licensing costs. As franchises grow through film and games, licensing and royalty payments can rise. That is part of the strategy, but it compresses margins in the short term.
Timing of the payoff. Much of the digital spending comes in 2027, when UNO Wild launches. A slower launch would push the payoff further out, while investors are already seeing lower margins in 2026.
Practical Takeaways for Investors
For investors tracking the turnaround, the metrics to watch are gross margin, adjusted operating income relative to the $580 million to $630 million guidance, and the performance of Mattel163 titles once they reach full launch. Sales growth alone does not show whether the strategy is creating value.
Mattel’s third-quarter results are the next checkpoint. Management said growth continued into the third quarter, and it expects to achieve full-year guidance. Verify the earnings date on the company’s investor site before publishing any timing-dependent statements.
This article is general information, not investment advice. Consider a licensed financial adviser before making investment decisions.
Future Outlook
Kreiz’s strategy is a bet that franchise-led entertainment, supported by owned games and film partnerships, can grow margins over time. The Q2 numbers show the sales half of that bet working. The profit half depends on tariffs, royalties, and whether digital titles reach profitable scale in 2027.
Frequently Asked Questions
What is Ynon Kreiz’s strategy at Mattel?
Kreiz is pursuing an “IP-driven play and family entertainment” strategy, building toys, games, and entertainment around owned brands. The strategy extends franchises into mobile games and film, supported by a cost program intended to fund growth.
Is Mattel’s digital games business profitable?
Mattel has not disclosed profitability for its self-published titles. The Mattel163 acquisition and games business contributed to Q2 revenue growth, but the company’s digital launches are still early, and its largest planned marketing spend comes when UNO Wild launches in 2027.
Why did Mattel’s profit fall if sales rose?
Gross margin fell to 48.2% in Q2 from 50.9% a year earlier. Management cited tariffs, inflation, higher royalties, and other cost pressures. Higher sales did not fully offset the margin decline.
Did Mattel change its 2026 guidance?
No. The company reaffirmed guidance for 3% to 6% constant-currency net sales growth and adjusted EPS of $1.27 to $1.39. The guidance excludes any possible tariff refunds.
Discover more from The Economy
Subscribe to get the latest posts sent to your email.

7-Eleven, Circle K, and Casey’s lead US convenience retail by store count. See how EV charging is spreading across the top chains and where fuel sales stand.
Key Takeaways
- The US had 151,975 convenience stores at the end of 2025, down 280 from the year before, according to NACS and NIQ TDLinx.
- 7-Eleven is the largest chain by store count, with about 12,700 US locations on CSP’s January 2026 ranking. Circle K, Casey’s, and Murphy USA follow.
- Fuel is still the core. Convenience stores sell about 80% of the gasoline bought in the US, and 122,620 stores now sell fuel, the highest number in eight years.
- EV charging remains thin. Wawa and Sheetz have chargers at 11% to 30% of their sites in a Consumer Reports sample, while the two largest chains have added chargers to less than 1% of their stores.
- Most chains are partnering with charging networks rather than building their own, and that model is shifting as 7-Eleven, Circle K, and Wawa take on more ownership.
Search Intent Summary
Readers searching this topic want to know which convenience chains are biggest, how they compare, and whether they’re investing in EV charging. This guide ranks the top chains by store count, explains the EV strategies, and covers the sales and fuel context.
How Market Share Is Measured
Market share in convenience retail can be measured several ways: by store count, by fuel gallons, or by in-store sales dollars. Public data is strongest on store counts, so this ranking uses store counts. Dollar-share estimates are sold by market research firms, and I did not verify figures that would support a revenue-based ranking.
Different sources also count stores differently. CSP’s Top 202 uses stores owned, operated, or franchised as of January 1, 2026. The NACS/NIQ TDLinx count is a separate industry tally. For Circle K, CSP lists 7,308 stores, while the NACS count lists 6,038 locations, so the figures should not be combined or compared directly across sources.
The Largest Chains by Store Count
On CSP’s 2026 Top 202, the leaders are:
- 7-Eleven: about 12,700 stores, the largest chain in the industry
- Alimentation Couche-Tard (Circle K): 7,308 stores under CSP’s count, the second-largest
- Casey’s General Stores: 2,921 stores, concentrated in the Midwest
- Murphy USA: 1,800 stores, a major fuel-focused operator
- bp America: 1,708 stores
- EG America: 1,464 stores
- QuikTrip: 1,196 stores, a Southern and Midwestern chain
- Wawa: 1,189 stores, a Mid-Atlantic favorite
- ExtraMile: 1,174 stores
- GPM Investments: 1,118 stores
Kwik Trip (919), Maverik (818), Sheetz (815), Love’s Travel Stops (668), and Pilot (658) round out the next tier. The threshold for the top 100 in 2025 was 67 stores, which shows how concentrated the market is at the top.
Store counts shifted in 2025 mostly through acquisitions. Circle K’s gain came largely from finishing its purchase of GetGo Café and Market, formerly owned by Giant Eagle. Sunoco’s $9.1 billion acquisition of Parkland Corp. also reshaped the rankings.
Fuel Sales Remain the Core Business
Convenience stores are, first and foremost, fuel retailers. NACS estimates that the industry sells about 80% of the gasoline purchased by consumers in the US, and the number of stores selling fuel rose by 768 in 2025 to 122,620, the highest count in eight years. Overall, 80.7% of convenience stores sell fuel.
That mix matters for margins and for the strategy of the largest chains. Fuel brings traffic, and inside sales, especially food service and tobacco, bring profit. NACS reported the industry generated $837.4 billion in sales in 2024, driven largely by foodservice. Industry-wide 2025 sales were scheduled for release at the NACS summit in April 2026, and readers should check the NACS site for the latest figure.
Gasoline price swings affect this business directly. National average prices reached $4.41 on October 1, 2026, according to AAA, which means fuel margins and foot traffic move with crude oil headlines.
EV Charging: Who Is Investing and How
Convenience stores have become a major location for public charging, but coverage is still limited. A Consumer Reports study of 75 major retailers, covering 11 convenience-store companies, found that Wawa and Sheetz had EV chargers at between 11% and 30% of their locations, averaging six to ten fast chargers per site. Royal Farms was similar. The remaining chains averaged between two and five chargers per site.
Across the sample, only 1.4% of convenience stores offered EV charging. The study noted that c-stores are the only retail category where nearly all chargers are fast chargers, which is a good fit for a quick stop but expensive to install.
The two largest chains are taking a different approach. 7-Eleven launched its own 7Charge network and app, with a stated goal of building one of the largest fast-charging networks of any retailer in North America. Circle K has partnered with IONNA, an EV charging company backed by eight automakers, to add chargers at 350 US stores, including converting about 85 existing charging sites. Neither 7-Eleven nor Circle K had chargers at more than 1% of their stores in the Consumer Reports sample.
Other chains are moving in similar directions. Casey’s is installing IONNA chargers at several locations in six states, with plans to expand the partnership. Sheetz and Wawa also partner with IONNA. Wawa announced in September 2026 that it would install eight branded DC fast chargers in Pennsylvania through a partnership with Electrify America, its first move into owning and operating its own charging equipment rather than hosting third-party chargers. Wawa has operated EV charging at more than 280 locations since 2017.
The model matters for shoppers. Partnerships usually mean the charging company runs the equipment and handles payment, while the store provides the site and drives traffic. Chains that own their chargers get more control over pricing and reliability, but they also take on the cost and risk.
Customer Satisfaction Rankings
Store counts and charging networks are only part of the picture. The American Customer Satisfaction Index’s 2026 convenience store study, released October 6, ranked Meijer first, followed by QuikTrip in second and a tie for third between Wawa and Sheetz. The survey asked 9,465 consumers to score chains on factors including store hours, coffee freshness, bathroom cleanliness, food quality, wait times, and app usability.
Overall satisfaction fell 1% to 75 points, and store layout and cleanliness dropped 3%. Wawa led in the South and Northeast regions in the survey. The findings suggest that growth in food service and digital offerings is not yet translating into higher satisfaction across the industry.
Practical Guidance for Shoppers and Investors
For drivers choosing a chain, the EV question depends on where you travel. If you drive an electric vehicle, check the chain’s charging network and app before a long trip. Many chargers are partnership sites with different payment systems, so confirm the plug type and fees in advance.
For fuel shoppers, the fuel-selling store count is a good sign of supply, but prices vary by brand and region. Compare the station’s posted price with the AAA state average before you fill up.
For investors and industry watchers, the key questions are whether chains can grow charging in high-traffic locations without pressuring margins, and whether the largest chains will move from partnership models to owned networks.
Future Outlook
Store counts are roughly flat, with growth coming from acquisitions and new formats rather than from a rapid expansion of the total store base. EV charging is growing from a small base, and the chains that build dependable fast-charging networks may gain traffic from drivers who need a quick stop. Fuel price volatility will continue to shape the economics of the whole sector.
Frequently Asked Questions
Which convenience store chain is the largest in the US?
7-Eleven is the largest by store count, with about 12,700 US stores on CSP’s January 2026 ranking. Circle K is second, although counts differ by data source.
Which convenience stores have the most EV chargers?
Wawa and Sheetz had chargers at 11% to 30% of their locations in the Consumer Reports sample, with six to ten fast chargers per site on average. 7-Eleven and Circle K have expanded their charging networks but had chargers at less than 1% of their stores in that sample.
How many convenience stores are there in the US?
The NACS/NIQ TDLinx count put the total at 151,975 at the end of 2025, down 280 stores from the year before. About 63% of stores are owned by companies with ten or fewer locations.
Do convenience stores sell most of the gas in the US?
NACS estimates convenience stores sell about 80% of the gasoline purchased by consumers in the US. Fuel is the core product for most chains, even as inside sales and food service grow.
Discover more from The Economy
Subscribe to get the latest posts sent to your email.

US Treasury yields have climbed to multi-year highs, pushing corporate financing costs higher and creating a growing refinancing challenge for American companies. The immediate pressure is concentrated among weaker borrowers, but a prolonged high-rate environment could eventually affect investment, mergers, buybacks and economic growth across corporate America.
The US bond market has entered a more difficult phase for corporate borrowers.
A sharp rise in Treasury yields is increasingly feeding into the cost of corporate debt, forcing companies to reconsider when and how they borrow. The impact is most severe for highly leveraged and lower-rated businesses, but even investment-grade companies are facing a more expensive capital market than they enjoyed during the ultra-low-rate era of the early 2020s.
The issue is no longer simply whether the Federal Reserve raises or cuts short-term interest rates. The bigger question for corporate America is how long long-term borrowing costs remain elevated.
That distinction matters because companies refinancing debt today are replacing old financing obtained at substantially lower rates with new debt priced in a very different market.
The Treasury market is setting a tougher price for corporate debt
The starting point is the US government bond market.
The 10-year Treasury yield has climbed to levels not seen in more than two decades, increasing the baseline rate against which much of the corporate bond market is priced. Recent market reporting has put the 10-year yield above 5%, with investors demanding greater compensation for holding long-duration government debt.
The Federal Reserve has warned that higher interest rates can increase debt-servicing costs for businesses with substantial leverage and upcoming refinancing requirements. The central bank has also noted that the corporate sector entered 2026 with relatively strong investment-grade credit quality, meaning the current environment should not automatically be interpreted as an economy-wide credit crisis.
That distinction is crucial.
The problem is increasingly concentrated in companies that have some combination of high leverage, weak cash flow, floating-rate liabilities or large amounts of debt coming due.
Federal Reserve financial-stability analysis supports the view that corporate credit vulnerabilities remain uneven rather than universal.
Why refinancing is becoming the central risk
Many companies borrowed heavily when interest rates were exceptionally low.
As those bonds mature, companies must either repay the debt from existing cash, refinance it at prevailing rates, sell assets, raise equity or reduce spending.
The refinancing arithmetic can be painful.
Suppose a company borrowed $10 billion at an average interest rate of 3%. Its annual interest bill would be approximately $300 million.
If that debt has to be refinanced at 6%, the annual interest expense rises to approximately $600 million.
The company has not borrowed another dollar, yet its annual financing burden has doubled.
That is why refinancing can become a hidden earnings shock.
Reuters estimates that approximately $4.3 trillion of US non-financial corporate bonds will mature between 2027 and 2031. Annual maturities are expected to rise from roughly $572 billion in 2027 to approximately $1.03 trillion in 2030.
This creates what investors increasingly describe as a corporate refinancing wall.
The weakest companies are feeling the pressure first
The deterioration is not evenly distributed.
Companies with investment-grade balance sheets can generally access capital markets more easily and often have diversified sources of funding.
Highly leveraged companies have fewer options.
According to the Financial Times, borrowing costs for companies rated CCC or lower have risen to approximately 17%, while their risk premium has reached about 12 percentage points.
That level of financing can fundamentally change corporate decision-making.
A project that looked profitable when money cost 5% may no longer make economic sense when financing costs move substantially higher.
This can lead companies to postpone:
- acquisitions;
- share buybacks;
- expansion projects;
- capital expenditure;
- hiring;
- new factories;
- technology investments;
- refinancing transactions.
The consequences can therefore spread beyond bond investors into the real economy.
Corporate America is not facing one uniform debt crisis
One of the most important nuances missing from many discussions about higher borrowing costs is that corporate America is highly divided.
At one end are highly profitable technology companies and other large investment-grade borrowers with enormous cash flows and strong access to capital markets.
At the other are highly leveraged companies whose earnings leave relatively little room to absorb a major increase in interest expense.
The Federal Reserve’s 2026 Financial Stability Report found that investment-grade corporate credit quality remained robust, although some riskier firms, particularly those dependent on private credit, were experiencing greater debt-servicing challenges.
That suggests the current environment is better described as a credit-selection problem than a generalized corporate solvency crisis.
The longer yields remain elevated, however, the greater the probability that today’s refinancing pressure becomes tomorrow’s default problem.
The corporate bond market is already sending signals
Market pricing provides an important window into this transition.
FRED data show Moody’s seasoned Baa corporate bond yield at approximately 6.73% on October 1, 2026. The Baa spread over the 10-year Treasury was about 1.49 percentage points at the beginning of October.
This distinction is important.
Corporate borrowing costs consist broadly of two components:
Treasury yield + corporate credit spread = corporate borrowing yield
The Treasury component compensates investors for the time value of money and government interest-rate risk.
The credit spread compensates investors for taking corporate credit risk.
When both rise simultaneously, companies experience a much more powerful increase in financing costs.
So far, much of the pressure has come from the Treasury side, although credit spreads for weaker borrowers have also widened substantially.
Paramount’s enormous financing illustrates the new reality
The Paramount Skydance transaction provides a particularly useful case study.
Paramount disclosed plans for tens of billions of dollars of debt financing connected with its acquisition of Warner Bros. Discovery. Its SEC filings show that the transaction involved substantial debt commitments, including a large bridge financing facility that was expected to be replaced or reduced through permanent financing.
The transaction demonstrates a broader challenge facing corporate finance teams.
When financing costs are uncertain, companies increasingly have to think about:
How much should we borrow?
For how long?
At what fixed rate?
How much floating-rate exposure should we accept?
Should we refinance now or wait?
Can the acquisition generate enough additional cash flow to justify the higher financing expense?
Those questions become especially important for highly leveraged mergers and acquisitions.
Why companies are shortening maturities
One logical response to high long-term interest rates is to avoid locking in today’s expensive financing for decades.
Companies may therefore prefer shorter maturities.
The strategy has an obvious advantage: if rates fall later, the company can refinance at a lower cost.
But it also creates another risk.
Shorter maturities mean more refinancing requirements in the future.
If interest rates remain high, companies could find themselves repeatedly refinancing debt at elevated rates.
That creates a difficult trade-off between paying more today for long-term certainty and accepting refinancing risk in exchange for shorter-term flexibility.
AI is creating an important exception
One of the most interesting features of the current credit market is the enormous borrowing associated with artificial intelligence infrastructure.
Technology companies are spending unprecedented amounts on data centres, chips, networking infrastructure and electricity capacity.
The Financial Times has reported estimates that hyperscalers could borrow around $1 trillion through 2030 to support AI infrastructure expansion.
For these companies, the calculation is different.
If management believes that failing to invest in AI infrastructure would result in losing a strategic position, higher financing costs may be treated as the price of maintaining competitive advantage.
This creates a strange two-speed corporate credit market.
AI-related investment can remain aggressive while other companies cut capital spending.
That divergence could become one of the defining characteristics of the next phase of the US corporate bond market.
The refinancing wall could become an earnings problem
The most important transmission mechanism is straightforward:
Higher Treasury yields → higher corporate borrowing costs → higher interest expense → lower free cash flow → reduced investment or weaker credit quality.
For companies with strong margins, the increase may be manageable.
For companies operating with thin margins, it can be decisive.
Consider a company generating $1 billion in annual operating cash flow and paying $300 million in interest.
If refinancing raises annual interest expense to $500 million, the company’s interest burden consumes a much larger share of its cash flow.
Management then has fewer resources available for investment, acquisitions, dividends and buybacks.
If revenues simultaneously weaken, the problem becomes more serious.
Could this trigger a wave of corporate defaults?
Not necessarily.
The Federal Reserve’s earlier 2026 assessment showed that corporate bond issuance remained strong and investment-grade credit quality was generally solid.
That provides an important cushion.
Large corporations have also had years to prepare for higher rates by extending maturities and locking in fixed-rate financing.
But the risk is asymmetric.
A stable economy can allow heavily indebted companies to refinance successfully.
A combination of high interest rates, slowing economic growth and falling corporate profits would be much more dangerous.
That is when refinancing pressure can turn into covenant breaches, distressed exchanges, restructurings and defaults.
The Federal Reserve has explicitly warned that higher rates can amplify vulnerabilities associated with leverage and upcoming refinancing needs.
What investors should watch next
Investors should focus on five indicators rather than Treasury yields alone.
1. The 10-year Treasury yield
A sustained move above current levels would increase the baseline cost of corporate financing.
2. High-yield credit spreads
A sharp widening would indicate that investors are demanding substantially greater compensation for corporate credit risk.
3. Corporate refinancing volumes
If companies begin delaying bond issuance, it could signal that borrowers consider market pricing too expensive.
4. Interest coverage ratios
Companies with declining earnings and rising interest expense are particularly vulnerable.
5. Default and distressed-debt indicators
A sustained increase in defaults would suggest that the refinancing problem is becoming a solvency problem.
The bigger issue is the cost of capital
The most important consequence of the bond sell-off may not be a sudden wave of bankruptcies.
It may be a gradual repricing of corporate decision-making.
For more than a decade, exceptionally low interest rates encouraged companies to borrow cheaply, refinance frequently, acquire competitors and return capital to shareholders.
That model becomes less attractive when the cost of capital rises substantially.
The result could be a more disciplined corporate environment in which companies demand higher returns from acquisitions and capital projects.
That may ultimately be healthy.
But the transition could be painful for companies that built their business models around cheap debt.
A new test for corporate America
The US economy has already demonstrated considerable resilience in the face of higher rates.
The question now is whether that resilience extends to a corporate sector facing a large refinancing cycle.
The numbers suggest that the pressure will build gradually rather than arrive as a single shock.
The immediate danger is concentrated among highly leveraged and lower-rated companies. Investment-grade borrowers remain considerably better positioned.
But the refinancing calendar means the issue cannot simply be dismissed.
With roughly $4.3 trillion of non-financial corporate bonds coming due between 2027 and 2031, the cost of money over the next several years will matter enormously.
If Treasury yields eventually decline, many companies could refinance more comfortably.
If yields remain elevated while earnings weaken, the pressure could move steadily up the credit spectrum.
That makes the current bond-market sell-off more than a story about government debt.
It is becoming a test of how much corporate America can adapt to a world in which capital is no longer cheap.
Bottom line
The US corporate sector is not yet facing a systemic debt crisis. The stronger borrowers retain substantial market access, while investment-grade credit quality remains relatively resilient.
But the refinancing cycle is creating a growing divide between companies that can absorb higher interest costs and those that cannot.
The crucial variable is therefore not simply whether the Federal Reserve raises or lowers its policy rate.
It is whether long-term borrowing costs remain high long enough for the refinancing wall to become an earnings and solvency problem.
For investors, the next phase of the credit cycle will be about separating companies that can grow their cash flows faster than their financing costs from those whose balance sheets were built for the era of cheap money.
Discover more from The Economy
Subscribe to get the latest posts sent to your email.

Anthropic Draws the Line: Why Claude’s New Usage Policy Explicitly Bans ‘Cruel Behavior’ Toward AI

Ynon Kreiz & Mattel’s Digital Transformation: Franchise Strategy and Financial Growth

Crude Oil & Petroleum Market Analysis: OPEC+ Decisions and Price Forecasts

Top US Convenience Store Chains: Store Counts, EV Charging, and Sales Trends

Publix Store Closures Tracker: Locations, Rebuild Status, and What’s Changing

How to Find Google Maps Fuel Prices and Save on Every Fill-Up

Global Market Outlook: Navigating Interest Rates, Inflation, and Commodity Spikes

PEP Stock Analysis: PepsiCo Financials, Dividend Yield, and Sector Volatility

Social Security $90 Payment Claims: What’s Real, What’s a Scam, and What Your 2027 COLA Could Be

EU vs UK Electric Vehicle Tariffs: Impact on Automotive Supply Chains & Consumer Prices

Complete Guide to Home Loan Refinancing: Interest Rate Trends & Loan Calculation Strategies

Algorithmic Dogfights: Why the U.S. and China Must Establish Rules of Engagement for Autonomous Air Power

Stock Market Today: Dow, S&P 500, and Nasdaq Retreat as Treasury Yields

Global Economic Outlook 2026: 7 Forces Reshaping Markets, Trade and Business

Oil Prices Break $100 in 2026: Middle East Conflict & Energy Markets

China Stocks Today: Are Big Economies in Asia Nearing a Market Bottom?

Middle East War Economics 2026: Oil Prices & Energy Markets

PSX Forecast 2026: KSE-100, IMF Reviews & Geopolitics

Crypto Daily Outlook: Bitcoin, Altcoins, and the Future of Decentralized Finance

Global Pension Systems Ranked: The World’s Best and Worst Retirement Frameworks

Enterprise AI Platforms Disrupting B2B SaaS in 2026: Full Analysis

World’s Largest Economies: Ranking the Top Global Powers

Elon Musk’s Next Moves: Disrupting the 2026 Global Economy

Pakistan Economy 2026: Inside the SBP’s Balancing Act

GasBuddy Market Insights: How Crude Price Shifts Impact Local Fuel Cost Averages

World Bank & IMF Reports 2026: Why the “3% Growth” Consensus Is Actually a Debate

Global Equity Market Divergence: US Tech vs. European Dividend Stocks vs. Asian Growth

Stock Market Today: Dow Climbs 500 Points as Markets Shake Off Inflation Jitters
-

 Markets & Finance9 months ago
Top 15 Stocks for Investment in 2026 in PSX: Your Complete Guide to Pakistan’s Best Investment Opportunities
-

 Analysis8 months ago
Johor’s Investment Boom: The Hidden Costs Behind Malaysia’s Most Ambitious Economic Surge
-

 Analysis8 months ago
Top 10 Stocks for Investment in PSX for Quick Returns in 2026
-

 Banks9 months ago
Best Investments in Pakistan 2026: Top 10 Low-Price Shares and Long-Term Picks for the PSX
-

 Analysis8 months ago
Brazil’s Rare Earth Race: US, EU, and China Compete for Critical Minerals as Tensions Rise
-

 Investment9 months ago
Top 10 Mutual Fund Managers in Pakistan for Investment in 2026: A Comprehensive Guide for Optimal Returns
-

 Global Economy10 months ago
15 Most Lucrative Sectors for Investment in Pakistan: A 2025 Data-Driven Analysis
-

 Global Economy10 months ago
Pakistan’s Export Goldmine: 10 Game-Changing Markets Where Pakistani Businesses Are Winning Big in 2025