
Analysis
Why This Oil Shock Is Different

On February 28, 2026, Operation Epic Fury changed the world. A coordinated US-Israeli strike on Iran’s nuclear infrastructure and military leadership didn’t just ignite a regional war. It triggered — within seventy-two hours — the closure of the Strait of Hormuz: the narrow, S-curved waterway through which roughly 20% of the world’s seaborne oil and gas normally flows every single day. It wasn’t submarines or naval mines that stopped the tankers. It was cheap Iranian drones, launched with surgical timing into the corridor’s most insurable stretch, that convinced the world’s war-risk underwriters to withdraw coverage almost overnight.
Brent crude surpassed $100 per barrel on March 8, 2026 — the first time in four years — and clawed toward $126 at its peak. The International Energy Agency has characterised this as the “largest supply disruption in the history of the global oil market.” The IEA’s executive director called it “the greatest global energy security challenge in history.”
We have heard comparisons to 1973 and 1979. Those comparisons are seductive and dangerously incomplete. This oil shock is structurally, mechanically, and politically different from every one that preceded it. And financial markets — despite the equity sell-offs and Treasury yield spikes — are still not pricing the full depth of that difference.
What Makes This Shock Geometrically Larger
The 1973 Arab oil embargo cut global supply by roughly 7–8%. The Iranian Revolution in 1979 removed about 4% of world supply from the market. Even the Persian Gulf War in 1990-91 was partially cushioned by Saudi spare capacity mobilised within weeks.
The Strait of Hormuz closure removes close to 20% of global oil supplies simultaneously — not as a gradual embargo, but as an overnight cliff. Iraq and Kuwait, unable to export because local storage is now full, have been shutting in their oil wells since early March, with Gulf producers collectively losing an estimated 10 million barrels per day by mid-March. Qatar has declared force majeure on all LNG exports. The Gulf region, which produces nearly half of the world’s urea and 30% of ammonia, has become a fertiliser embargo wrapped inside an energy shock — with urea prices already up 50% since the conflict began.
The geometry of this disruption is also different. In past shocks, oil found alternative routes and buyers adapted. Here, Saudi Arabia’s East-West Pipeline — cranked to its 7 million barrel-per-day capacity for the first time ever — can only partially offset a full Strait closure. And now, as of this writing, Iran’s allies are threatening to close the Bab al-Mandeb as well, the Red Sea chokepoint that would take another 5% of global supply offline and trap Saudi’s pipeline bypass in a second siege. A quarter of the world’s energy supply could be blocked simultaneously. No prior shock has approached this topology.
The Exhausted Policy Arsenal: Why 2026 Is Not 1979
Here is the argument that has circulated in various forms since the crisis began: policy buffers that existed in past shocks are simply gone. I want to make this point sharper than it has been made elsewhere.
In 1973, the US federal debt was 35% of GDP. Today, it sits above 120%. After pandemic-era spending, the American Rescue Plan, the Inflation Reduction Act, and the One Big Beautiful Bill tax cuts, fiscal space is not tight — it is effectively negative in any meaningful countercyclical sense. The same is true in Europe, where governments spent aggressively through the 2021–2022 energy crisis and have little appetite for another round.
On the monetary side, the Fed entered this crisis already constrained. After cutting rates 175 basis points between September and December 2025, the FOMC now finds itself frozen — unable to cut further without stoking the very inflation its credibility depends on controlling, unable to hike without risking a recession it can see building in real time. Fed Chair Powell, at the March 18 press conference, acknowledged plainly that the dual mandate is in genuine tension: progress on inflation “has not been as much as we hoped.” Richmond Fed President Tom Barkin had warned as recently as January that policy would “require finely tuned judgments” — a diplomatic phrase that in today’s context translates to paralysis by a thousand considerations.
Alliance Bernstein puts it succinctly: the Fed faces a “recipe for policy stasis.” If it hikes to control inflation, it deepens the growth shock. If it cuts to support the economy, it fires an accelerant into an inflationary fire already burning hotter than its pre-crisis 3% PCE baseline can absorb. Markets are currently pricing roughly 45% probability of a rate hike — something Goldman Sachs considers excessive but which reflects a real, unresolved policy dilemma that no textbook resolves cleanly. The 10-year Treasury yield spiking to 4.13% in a single session on March 5 was not a flight to safety. It was a flight away from the fiction that this is manageable.
In Arthur Burns’ Fed, the 1973 shock arrived with inflation expectations still anchored from years of post-war price stability. Today, core PCE inflation was already running at 3% — a full percentage point above target — when the first missile struck Iranian soil. The economy is entering the fire from a building already warmed.
The EV Transition Paradox and the Demand Inelasticity Trap
There is a structural story here that few analysts have told fully. The green energy transition — years in the making — has produced a perverse interim condition: demand for oil has become simultaneously weaker at the margin and more inelastic at the core.
Electric vehicles now represent a meaningful share of new car sales globally, particularly in China and Europe. But the installed base of internal combustion engines runs into the hundreds of millions. Shipping, aviation, petrochemicals, fertiliser production — none of these have been decarbonised. The world has diversified its future away from oil while remaining acutely dependent on it for the present. Eighty-five percent of Middle Eastern polyethylene exports pass through Hormuz. Nearly all of the Gulf’s fertiliser — the input on which global corn and wheat yields depend — transits this same 34-kilometre waterway.
What this means in practice: demand cannot adjust quickly when supply collapses. In 1979, conservation mandates and behavioural shifts had immediate traction in an economy where households drove gas-guzzlers and factories ran on oil-fired boilers. The Philippines has declared a national energy emergency, effectively acknowledging it has no workable substitute for the 98% of crude it imports from the Middle East. Demand destruction, when it comes, will not be orderly. It will arrive through recession, through rationing, and through food inflation cascading from fertiliser shortfalls — the kind of second-round effects that extend an oil shock from a quarter to a year.
US shale production — often cited as the great geopolitical buffer that didn’t exist in the 1970s — faces its own constraints. Permian Basin productivity growth has been flattening. The industry has returned capital to shareholders rather than drilling new wells, and ramp-up times measured in months cannot respond to a supply shock measured in weeks. The Strategic Petroleum Reserve, depleted significantly through the post-Ukraine releases of 2022, has been partially rebuilt but the IEA convened emergency meetings to coordinate its 1.2-billion-barrel reserve — a buffer designed for weeks of coverage, not months of closure. And the US, politically and militarily the country most able to force the strait back open, has been simultaneously reluctant to release SPR volumes without confirming physical infrastructure damage on Gulf terminals.
Asia: The Epicentre That Will Reshape Global Energy Geopolitics
The asymmetry of this shock matters enormously. China, India, Japan, and South Korea account for 75% of Gulf crude exports and 59% of its LNG. The Hormuz closure is, first and foremost, an Asian supply crisis.
Japan has already released 80 million barrels from strategic reserves — the equivalent of 15 days of domestic demand. South Korea has launched an energy-saving campaign and reversed course on coal plant decommissioning. China has continued importing Iranian crude on dark-fleet arrangements even during the crisis, its strategic stockpiling providing a buffer unavailable to most other importers. India, exposed and import-dependent, faces its harshest energy test since 1973.
But the longer-term geopolitical reshaping is more profound than these emergency responses suggest. Asia’s exposure to Hormuz dependency has just been measured in real time, in dollars, in rationing queues, and in government emergency declarations. Every major Asian economy will now accelerate — with genuine political urgency — its pivot toward diversification: Gulf alternatives via the longer Cape of Good Hope routing, domestic renewables, and bilateral energy pacts with non-Gulf producers. The IEA’s guidance on emergency demand reduction measures — remote working, public transport, four-day working weeks — is already being implemented in Manila. These are not temporary behavioural changes. They are policy frameworks being institutionalised under pressure.
China’s strategic response will define the next decade of global energy geopolitics. Beijing has not joined Western condemnation of Iran’s strait closure. It has, instead, quietly extracted preferential pricing for Chinese-flagged vessels still transiting the corridor under negotiated safe-passage agreements. If the crisis hardens China’s relationships with Persian Gulf producers while simultaneously accelerating its own domestic energy transition, the geopolitical consequence is a Middle East that becomes progressively more transactionally aligned with Beijing — and a Western energy security architecture that has lost one of its central assumptions.
Europe: Second Crisis, Same Circles
Europe’s predicament is acute and somewhat self-inflicted. European gas storage entered this crisis at just 30% capacity, following a harsh 2025–2026 winter. Dutch TTF gas benchmarks have nearly doubled to over €60/MWh. QatarEnergy has declared force majeure on all exports. The ECB postponed its planned rate reductions on March 19, simultaneously raising its 2026 inflation forecast and cutting GDP growth projections. UK inflation is expected to breach 5%. Chemical and steel manufacturers across the EU have imposed surcharges of up to 30% on output costs.
“Just like the crisis after Russia’s full-scale invasion of Ukraine,” as one European official put it. “Different conflict. Same European divisions; same dilemmas over energy. We can’t keep going round in these circles.”
The paradox is that Europe’s own green energy investments offer the most credible medium-term adaptation pathway of any major economy. Offshore wind capacity has grown dramatically since 2022. Heat pump installations have accelerated. The policy infrastructure — carbon pricing, renewable mandates, grid investment — exists in a way it does not in Asia or the United States. If the Hormuz crisis persists into the summer refill season, the pressure on European governments to accelerate renewable deployment will be existential rather than aspirational.
Why Markets Are Still Underpricing the Long-Term Fallout
The SPDR S&P 500 ETF has dropped roughly 6% since the conflict began. That is an appropriate volatility response to a geopolitical shock. It is not a pricing of structural change.
Here is what equity markets have not yet fully discounted: the medium-term pass-through of higher energy costs into corporate margins, the second-order fertiliser and food inflation shock arriving in the third and fourth quarters of 2026, the leadership uncertainty at the Fed with Powell’s term expiring in May, and the real possibility — now flagged by analyst Ed Yardeni, who has raised his 1970s-style stagflation odds to 35% — that this is not a six-week crisis but a six-month restructuring of global energy flows.
The Dallas Fed’s research suggests a one-quarter closure of the Strait reduces global real GDP growth by an annualised 2.9 percentage points in Q2 2026. A three-quarter closure reduces full-year global growth by 1.3 percentage points. These are not catastrophic numbers in isolation. But they arrive on top of tariff inflation still working through the system, a US economy whose two primary growth engines — AI investment and wealthy consumer spending — are both sensitive to equity valuation corrections, and a geopolitical environment in which the Bab al-Mandeb is now explicitly threatened as an Iranian escalation option.
If the Bab closes simultaneously with Hormuz, a quarter of the world’s energy supply is blockaded. At $170 a barrel, Oxford Economics estimates the stagflationary impact “roughly doubles,” with consequences for central bank paths, corporate earnings, and political stability from Manila to Milan. That tail risk is not adequately priced in current equity valuations or credit spreads.
The Contrarian Case: Adaptation Is Faster Than It Looks
It would be dishonest to end without acknowledging the countervailing forces — and there are real ones.
Iran has rational incentives to limit the damage. As David Roche of Quantum Strategy observed, Tehran needs oil revenues to function. A partial reopening — not to US and Israeli shipping, but to non-aligned vessels — is already being negotiated. Iranian drones stopped commercial traffic not through naval dominance but through insurance withdrawal. The same mechanism, running in reverse, can restart flows: a US government insurance backstop for non-combatant shipping, combined with naval escorts, could partially restore traffic without requiring a ceasefire.
The speed of adaptation in this crisis has also been notable. Japan mobilised strategic reserves within days. Saudi Arabia maxed its bypass pipeline within weeks. South Korea reversed coal plant retirement decisions within hours of the emergency declaration. The world’s energy system is more distributed and more resilient than the 1970s model, even if it is far more exposed at Hormuz specifically.
And the long-term investment signal from this shock is unmistakable. Every government, every energy company, every pension fund with infrastructure exposure now has concrete evidence — not theoretical modelling, but lived experience — that Hormuz dependency is an unhedged existential risk. The acceleration of LNG terminal diversification, Gulf bypass infrastructure, and renewable baseload that follows this crisis will reshape global energy investment for the next decade. The disruption is real. So is the creative destruction it will force.
The Bottom Line
This oil shock is different because it combines a geometrically larger supply disruption than any predecessor with emptier fiscal and monetary arsenals, more inelastic demand structures, and a geopolitical complexity — the EV transition paradox, the Bab al-Mandeb threat, China’s strategic ambiguity — that no prior framework anticipates.
The 1973 shock broke the illusion that oil was cheap. The 1979 shock broke the illusion that the Middle East was stable. This shock is breaking the illusion that the global economy has policy space and supply-chain flexibility adequate to absorb the worst-case Hormuz scenario.
Markets will eventually price what is coming. The question is whether they do so gradually — through the slow grind of corporate earnings revisions and food inflation data — or suddenly, through a second leg of commodity price spikes as the summer demand season collides with still-constrained supply. The evidence of April 2026 suggests they are still pricing the former while the latter remains the more probable path.
Discover more from The Economy
Subscribe to get the latest posts sent to your email.


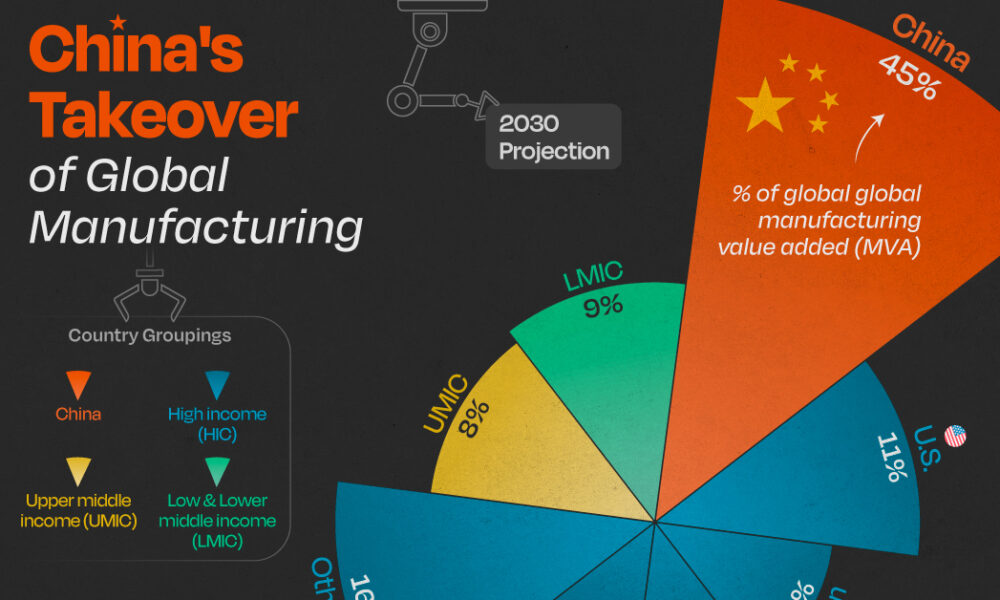
China’s exports have been the good-news story in an otherwise mixed economic picture. They’re not just holding up; through the first four months of 2026 they were running about 14% to 15% above the same period a year earlier, according to figures cited by the US-China Economic and Security Review Commission and Vanguard’s economic outlook. That’s the kind of number that would normally signal a healthy economy. The complication is what’s happening underneath it.
A growth model showing its age
Manufacturing capacity utilization fell to 73.9% in early 2026 — near a decade low outside of the pandemic shutdowns, per the Commission’s bulletin. That’s the tell. China is producing and shipping more, but a growing share of its industrial base is running under capacity, which points to a structural mismatch: the country’s manufacturing engine has outgrown both its domestic consumption and, increasingly, what the rest of the world is willing to absorb without pushback.
Goldman Sachs Research, in a report cited by Goldman Sachs’ own analysis, forecasts 4.8% real GDP growth for 2026 — above consensus expectations of 4.5% — driven substantially by continued export strength and a softening drag from the property downturn. But that same report flags the labor market as a genuine weak spot: hiring, measured across a weighted average of PMI employment sub-indexes, is at its most depressed level in a decade outside Covid, and urban nominal wage growth slowed to just 3.8% year-on-year in Q3 2025.
Why Beijing isn’t reaching for stimulus
Given the export strength, one might expect policymakers to feel less urgency about consumption-side stimulus. That’s roughly what’s happening — and it’s a deliberate choice, not an oversight. Xi Jinping’s government remains committed to dominating high-value manufacturing, which means comprehensive fiscal stimulus aimed at consumers remains unlikely even as domestic demand stays soft, according to the Commission’s bulletin.
The People’s Bank of China is expected to hold its policy rate steady through the rest of the year, preferring targeted structural tools over a broad-based rate cut, per Vanguard’s forecast. That’s a notably cautious stance given how weak the property sector remains — property investment indicators are down 50% to 80% from their 2020–21 peaks, and a “meaningful domestic-demand turnaround remains elusive,” in Vanguard’s own words.
The regulatory push to keep capital at home
Two moves by Chinese regulators in mid-2026 point to where Beijing’s real priority sits: keeping household savings and private capital funneled toward domestic industrial policy rather than flowing overseas. New rules taking effect July 1 restrict outbound investment that could be used to export restricted technology or expertise under the guise of ordinary capital flows, with violations carrying fines, visa restrictions and industry blacklisting, according to the Commission’s bulletin. The regulations follow Beijing’s move to block the founders of AI firm Manus from completing a sale to Meta, even after the company had relocated its headquarters from China to Singapore — a signal that Beijing is willing to reach across borders to keep promising tech assets tethered to domestic or Hong Kong listings.
The currency and trade angle
Goldman’s team makes an out-of-consensus call worth flagging: it expects China’s current account surplus to rise to 4.2% of GDP in 2026, up from 3.6% in 2025, while the broader analyst consensus surveyed by Bloomberg expects a decline to 2.5%. The divergence comes down to export resilience — falling export prices are making Chinese goods more competitive even as the yuan is expected to appreciate slightly, with export-price inflation in dollar terms forecast to turn positive, rising to 0.7% from -2.7% the prior year.
The bottom line
China’s economy in 2026 is a study in contrasts: robust headline export growth sitting on top of underutilized factories, a weak labor market, and a property sector still in its fifth year of decline. The World Bank’s own baseline, published in its country program materials, projects growth moderating toward 4.0% by 2026 — a more conservative read than Goldman’s. Either way, the consensus across forecasters is the same: exports are carrying more of China’s growth than is healthy for the long run, and Beijing’s policy choices this year suggest it’s betting on technological dominance to eventually solve the demand problem, rather than opening the stimulus taps to solve it directly.
Discover more from The Economy
Subscribe to get the latest posts sent to your email.
There’s a number that keeps showing up in every conversation about Pakistan’s economy, and it keeps getting bigger: circular debt. As of early July 2026, the gas sector’s share of that debt alone has topped Rs 3.44 trillion, and Islamabad has missed a deadline the IMF set for tariff reforms meant to arrest the slide, according to Dawn.
What circular debt actually is, and why it won’t go away
Circular debt is the chain of unpaid obligations that builds up when the price consumers pay for electricity or gas doesn’t cover what it actually costs to produce and deliver it. Someone in the chain — a power producer, a gas utility, a state-owned enterprise — ends up carrying an IOU, and that IOU gets passed down the line. Earlier this year, IMF officials pressed Pakistan on exactly this dynamic, questioning the government’s plan to zero out gas-sector circular debt, according to Aaj English. At the time, officials said around Rs 150 billion remained payable to companies including Oil and Gas Development Company Limited and Pakistan Petroleum Limited.
Islamabad’s proposed fix included a Rs 5-per-unit levy on gas, dividends from state-owned companies redirected toward debt reduction, and the sale of 35 LNG cargoes annually on the international market. The IMF, per that same reporting, raised pointed questions about whether the plan was actually viable.
The commitments Pakistan has already made
Under its Extended Fund Facility, Pakistan has committed to capping circular debt growth at Rs 300 billion for FY2027 and cutting power-sector subsidies from 0.7% of GDP to 0.6%, according to details reported by ProPakistani. The government has also shifted Nepra’s annual tariff-rebasing cycle from July to January, and Ogra now revises gas tariffs twice a year instead of once.
Structurally, some of this is working. The IMF’s own review in May 2026 credited Pakistan with a primary fiscal surplus of 1.6% of GDP for FY26, broadly in line with program targets, and noted gross reserves had climbed to $16 billion by end-December, up from $14.5 billion six months earlier, according to the IMF’s own press release. That progress unlocked roughly $1.1 billion under the EFF and $220 million under a parallel climate-resilience facility, bringing total disbursements under the two arrangements to about $4.8 billion.
Where the fault lines actually are
The uncomfortable part of this story, laid out by commentary reported in The Hans India, is that revenue targets get IMF scrutiny with great precision, while structural reform of loss-making public enterprises — Pakistan International Airlines and Pakistan Steel Mills chief among them — moves far more slowly. Those enterprises’ losses are absorbed by the national exchequer through subsidies, guarantees, and debt restructuring year after year, and privatization plans keep slipping because the political cost of confronting them is high.
Distribution company inefficiency compounds the problem. In FY25, Discos posted Rs 265 billion in losses, an improvement on FY24’s Rs 276 billion but still a substantial drag, according to Geo News, with Quetta, Peshawar and Hyderabad among the worst-performing utilities.
What happens if the pattern holds
Pakistan’s debt-to-GDP ratio sits between 70% and 80% as of 2026, according to Wikipedia’s economic summary, with debt servicing occasionally consuming two-thirds of government spending. That’s the backdrop against which every circular-debt conversation happens: there is very little fiscal room left to absorb another missed deadline.
The missed gas tariff deadline doesn’t automatically trigger a program breakdown — Pakistan has weathered similar friction points before during its current EFF arrangement. But with the IMF’s own documentation showing persistent concern about the credibility of debt-reduction plans, and with global energy prices still elevated in the aftermath of the Iran war, the margin for further slippage is thin. The next review will likely hinge less on the rhetoric around reform and more on whether the Rs 5 levy and LNG cargo sales actually show up in the numbers.
Discover more from The Economy
Subscribe to get the latest posts sent to your email.
Analysis
Malaysia Bets Its 2026 on “Execution” — And the Semiconductor Upcycle Is Doing the Heavy Lifting
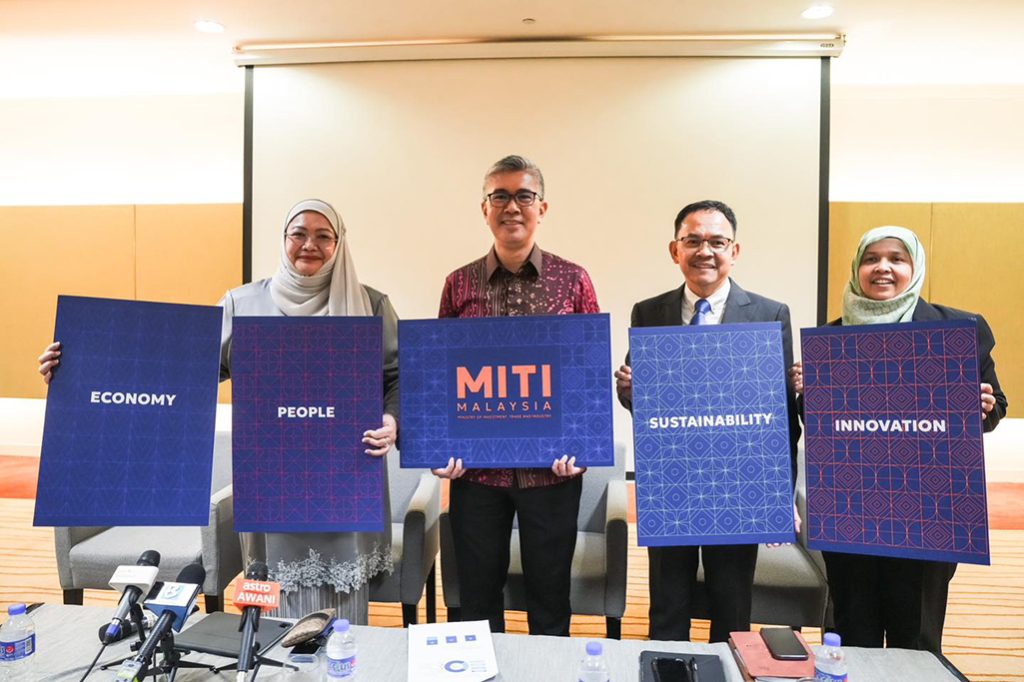
Malaysia’s government has declared 2026 a year of “execution” and “discipline” as the Anwar Ibrahim administration races to deliver on the 13th Malaysia Plan (RMK13) ahead of elections that could come as early as February 2028, according to Fortune’s interview with economy minister Akmal Nasrullah Mohd Nasir.
A Strong Base to Build From
Malaysia’s economy grew 4.9% in 2025 following 5.1% growth the year before, with unemployment falling to 2.9% — the lowest in a decade — and the ringgit trading at its strongest level in five years. HSBC’s ASEAN economist Yun Liu forecasts 4.6% growth for 2026, citing strength in electrical equipment manufacturing, tourism, and sound government policy, while Nomura economists have projected an even more bullish 5.2%, pointing to infrastructure spending under RMK13.
The ASEAN+3 Macroeconomic Research Office (AMRO) projects growth moderating slightly to 4.6% from an estimated 4.9% in 2025, describing Malaysia’s performance as reflecting its “entrenched position in global semiconductor and electronics value chains” and the broader global tech upcycle, according to AMRO’s assessment of Malaysia’s investment upcycle.
Navigating Washington Without Picking Sides
Malaysia’s trade relationship with the US has been turbulent. Washington imposed 25% tariffs on Malaysian goods in April 2025, rattling the country’s export-led economy, before a deal reduced US duties to 19% in exchange for Malaysia lowering tariffs on select American products, with exemptions carved out for aviation components and electrical equipment. Malaysia’s trade hit a record high of more than 3 trillion ringgit (roughly $780 billion) last year despite the friction.
Deputy finance minister Liew Chin Tong has framed Malaysia’s positioning explicitly around neutrality: the country is “not China, not the US,” a stance he argues gives Malaysia a strategic advantage in both geopolitical and supply-chain terms, according to Fortune’s reporting from the Forum Ekonomi Malaysia summit.
Capital Is Flowing In — From Everywhere
Malaysia recorded 22.8 billion ringgit (about $5.8 billion) in foreign direct investment in the first quarter of 2026, a 6.0% year-on-year increase, moderating from the prior quarter’s 48.7% surge. Inflows into information and communication technology services remained particularly strong, with China, Hong Kong, and Singapore serving as the primary capital sources, according to McKinsey’s Southeast Asia quarterly economic review. Bank Negara Malaysia has held its policy rate steady following a pre-emptive 25 basis-point cut in July 2025, with headline inflation projected to average just 2.0% in 2026.
The Long Game: Semiconductors, Rare Earths, and Nuclear Power
Beyond RMK13’s near-term targets, Malaysian officials are positioning the country’s industrial strategy around decades, not years. Minister Akmal has reiterated commitments to eliminate coal use by 2044 and reach net zero by 2050, while confirming Malaysia is actively “exploring the potential” of nuclear power to meet the energy demands of its expanding data-center and semiconductor sectors. AMRO’s structural policy guidance urges Malaysia to develop domestic semiconductor and rare-earth capabilities as a hedge against ongoing US-China “geoeconomic fracturing,” positioning the country as a trusted neutral hub for global manufacturers diversifying away from concentrated exposure to either superpower.
Discover more from The Economy
Subscribe to get the latest posts sent to your email.

China Economy 2026: Export Growth Masks Manufacturing Overcapacity

Pakistan Iran-US Ceasefire Mediation 2026: Diplomatic Gains, Economic Risks

Pakistan Circular Debt Crisis 2026: IMF Deadline Missed, Rs 3.44 Trillion

Indonesia Russian Oil Imports 2026: Why Jakarta Is Diversifying Crude Supply

Russia Bans Diesel Exports 2026: Global Fuel Market Impact Explained

Gulf Sovereign Wealth Funds Hit Record $53.9B in H1 2026 Despite Iran War

America’s Workers Are Vanishing From the Labor Force — And It’s Not the Usual Reasons

ASEAN+3 Enters 2026 From a Position of Strength — But Two Storms Are Building Offshore

US Tariff Investigation 2026: 60 Countries, Forced Labor Claims and the EU Trade Fight

UK Digital Identity Framework 2026: The £5bn Plan to Reshape Financial Verification

The Money Is Drying Up: How US Pressure Is Choking Off Russia-China Payment Channels

Indonesia GDP Growth 2026: 5.61% Expansion Marks Fastest Pace in Three Years

Singapore Makes Its Move to Become Asia’s Precious-Metals Capital

Malaysia Bets Its 2026 on “Execution” — And the Semiconductor Upcycle Is Doing the Heavy Lifting

Top 20 PSX Stocks for Investment in 2027: Your Complete Guide to Pakistan’s Best Investment Opportunities

Investors Pile Into Bullish Dollar Bets as ‘US Exceptionalism’ Trade Returns

Carry Trade Unwind 2026: How the Yen’s Snapback Triggered a Global Margin Call

Pakistan Textile Body Welcomes FY27 Budget, Seeks FTR

Japan’s Nikkei Scales Record Peak as AI Shares Track US Chip Rally

Why China’s Demand Stimulus Still Isn’t Working

Grinding the Already Ground: Pakistan’s Inflation Crisis

JPMorgan Cuts Anthropic AI Access in Hong Kong

Weak Demand at Treasury Auctions Is Quietly Rattling Bond Investors

China Tungsten Export Curbs: Is Japan’s AI Chip Supply at Risk?

Xponential Fitness Franchise Lawsuit: The $3.97M Judgment

SpaceX IPO opens door for retail savers via X Money

SpaceX IPO: Musk Raises $75bn in History’s Largest Listing

Bank Indonesia Rate Hike 2026: New Mandate’s First Market Test
-

 Markets & Finance6 months ago
Top 15 Stocks for Investment in 2026 in PSX: Your Complete Guide to Pakistan’s Best Investment Opportunities
-

 Analysis5 months ago
Top 10 Stocks for Investment in PSX for Quick Returns in 2026
-

 Analysis5 months ago
Brazil’s Rare Earth Race: US, EU, and China Compete for Critical Minerals as Tensions Rise
-

 Analysis5 months ago
Johor’s Investment Boom: The Hidden Costs Behind Malaysia’s Most Ambitious Economic Surge
-

 Banks6 months ago
Best Investments in Pakistan 2026: Top 10 Low-Price Shares and Long-Term Picks for the PSX
-

 Investment6 months ago
Top 10 Mutual Fund Managers in Pakistan for Investment in 2026: A Comprehensive Guide for Optimal Returns
-

 Global Economy6 months ago
15 Most Lucrative Sectors for Investment in Pakistan: A 2025 Data-Driven Analysis
-

 Global Economy6 months ago
Pakistan’s Export Goldmine: 10 Game-Changing Markets Where Pakistani Businesses Are Winning Big in 2025