
Inflation
What is Inflation and the Consumer Price Index (CPI)?

Understanding the Cost of Living, Price Hikes, and Macroeconomic Stability
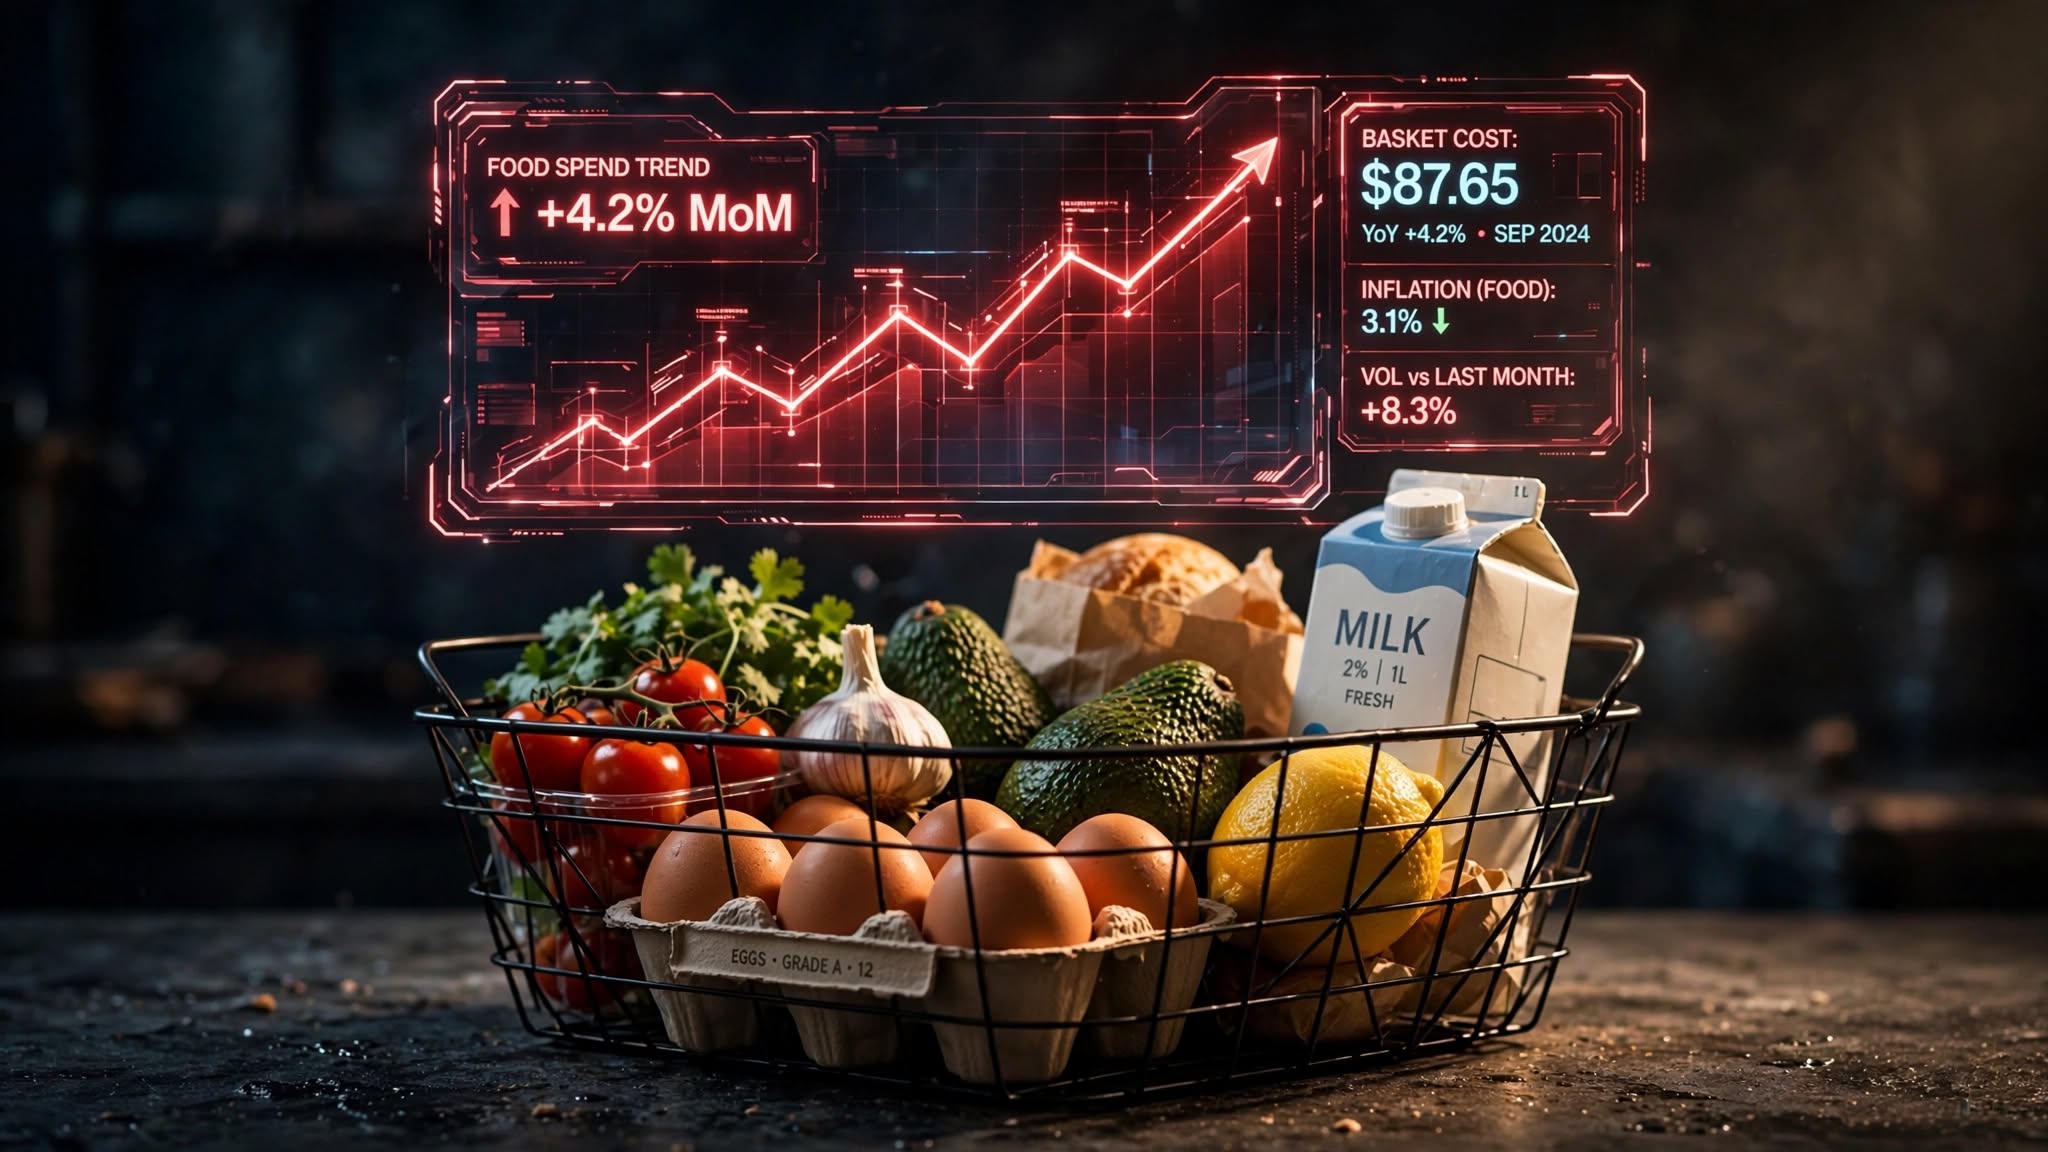
Inflation is the rate at which the general level of prices for goods and services rises in an economy, subsequently eroding the purchasing power of a currency. When inflation goes up, every single unit of currency buys a smaller percentage of a good or service. This means that if inflation is running at 10% annually, a basket of groceries that costs Rs. 1,000 today will cost Rs. 1,100 a year from now.
For readers of Thefinance.pk and Economy.com.pk, understanding inflation is foundational because it affects everything from daily household grocery budgets to high-level corporate investment strategies. It is not inherently a negative phenomenon; central banks generally target a low, predictable inflation rate (often around 2% in developed economies) to encourage consumption and investment over hoarding cash. However, hyperinflation or volatile inflation can cripple economic growth.
The Three Main Causes of Inflation
Economists generally divide the causes of inflation into three primary categories:
- Demand-Pull Inflation: This occurs when the overall demand for goods and services in an economy outpaces the economy’s ability to produce them. In simple terms, it is “too much money chasing too few goods.” This often happens during periods of rapid economic growth or when a government injects large amounts of stimulus money into the economy.
- Cost-Push Inflation: This type of inflation is driven by an increase in the cost of production. When raw materials (like crude oil or agricultural commodities) become more expensive, or when wages rise significantly, manufacturers pass these increased costs onto the consumer in the form of higher retail prices. A global oil shock is a classic trigger for cost-push inflation.
- Built-In Inflation: Also known as wage-price inflation, this is a psychological and adaptive phenomenon. When workers expect prices to continue rising, they demand higher wages to maintain their standard of living. Employers grant these wage increases but raise the prices of their goods and services to maintain profit margins, creating a continuous loop.
Measuring Inflation: The Consumer Price Index (CPI)
While inflation is the overarching concept, the Consumer Price Index (CPI) is the specific statistical metric used to measure it. The CPI tracks the average change over time in the prices paid by urban and rural consumers for a predefined “basket” of goods and services.
This basket is meticulously designed to reflect the daily spending habits of an average household. It includes various categories heavily weighted by their importance:
- Food and Non-Alcoholic Beverages: Often the largest weight in developing economies.
- Housing, Water, Electricity, and Gas: Utility costs and rent.
- Transport: Fuel prices and public transit costs.
- Health and Education: Medical care, tuition fees, and books.
- Apparel: Clothing and footwear.
How is CPI Calculated?
Statistical bureaus calculate CPI by collecting price data for the items in the basket from retail outlets across the country on a weekly or monthly basis. They establish a “base year” to serve as a benchmark (given an index value of 100).
If the base year is 2016 (Index = 100), and the current index value is 150, it means that the general price level of the basket has increased by 50% since 2016. The percentage change in the CPI from one month to the next, or one year to the next, represents the inflation rate.
CPI in the Context of Pakistan’s Economy
In Pakistan, the Pakistan Bureau of Statistics (PBS) is responsible for compiling and releasing CPI data every month. For platforms like economist.media, the monthly CPI reading is a critical data point.
Because a massive portion of the average Pakistani household income is spent on food and energy, the PBS assigns a very high weighting to these categories. Consequently, when global oil prices spike or agricultural yields drop (due to floods or droughts), Pakistan’s CPI surges aggressively. This imported inflation forces the State Bank of Pakistan (SBP) to tighten monetary policy, usually by raising interest rates to suppress demand and stabilize the Rupee.
The Hidden Tax on Savings
One of the most profound impacts of inflation is its effect on savings. Inflation is often referred to as a “hidden tax.” If you keep your money in a traditional savings account yielding 5% annually, but the CPI inflation rate is 10%, your real rate of return is negative 5%. Your money is mathematically growing, but its actual buying power in the real world is shrinking. This dynamic pushes investors toward assets that traditionally outpace inflation, such as real estate, equities, or gold.
Key Takeaways:
- Inflation represents the loss of purchasing power over time.
- The CPI measures this change using a weighted basket of everyday goods and services.
- Central banks combat high inflation by raising interest rates, which cools down consumer spending and corporate borrowing.
- High food and energy weights make developing economies particularly susceptible to global commodity price shocks.
Authoritative Sources & Further Reading:
- World Bank: Inflation Overview and Global Data
- International Monetary Fund (IMF): Inflation and the Cost of Living
Discover more from The Economy
Subscribe to get the latest posts sent to your email.


The Bureau of Labor Statistics’ July Consumer Price Index report, released Wednesday, August 12, showed headline CPI rising just 0.1% month-over-month, holding the annual inflation rate at 3.4% — a second consecutive month of cooling and a result that gives the Federal Reserve considerably more room to maneuver at its September meeting (BLS).
Inside the Numbers
The July reading followed a 0.4% monthly decline in June — the sharpest drop since April 2020 — as the initial energy shock from the U.S.-Iran conflict continued to fade. Trading Economics’ breakdown shows gasoline prices up 24.6% year-over-year in July, down from 26.7% in June, while fuel oil costs rose 39.1%, easing from 42.9% the prior month. Shelter inflation cooled slightly to 3.2% from 3.3%, and food inflation held steady at 3% (Trading Economics).
Economists polled ahead of the release had expected a similarly modest 0.1% headline increase and a 0.2% rise in core CPI, according to CNBC’s pre-release preview, with the report widely seen as “a big deal for the Fed” given how directly it would shape September rate-decision odds (CNBC).
Why This Report Matters More Than Usual
The July CPI print landed against the backdrop of a weak July jobs report that had already shifted market expectations sharply toward a rate cut. CNBC’s prediction-market tracking noted that the odds of a Fed hike in September “tumbled” following the disappointing jobs data, with the debate among traders shifting almost entirely toward the size of an eventual cut rather than its direction (CNBC Finance).
That combination — a softening labor market alongside genuinely cooling inflation — is precisely the setup the Fed has been waiting for since the Iran-war-driven energy spike complicated its policy path earlier in the year. With energy-related price pressures now clearly in retreat and the labor market showing real cracks, the case for holding rates restrictively into the fall has weakened considerably.
The Market Reaction
Broader financial markets have been trading on exactly this dynamic all week. CNBC’s live markets coverage from August 10 showed oil prices still elevated — Brent crude near $84.42 a barrel — as traders assessed mixed signals over whether a US-Iran deal to reopen the Strait of Hormuz would materialize, even as equity markets continued pricing in a more dovish Fed path (CNBC). By August 12, European and U.S. futures were mixed as attacks on vessels in the Red Sea and Gulf of Oman reignited some shipping-route concerns even as Strait of Hormuz reopening diplomacy continued to show incremental progress (CNBC).
What Comes Next
The Fed’s rate decision is still roughly a month away, and one more jobs report and a Personal Consumption Expenditures inflation reading will land before then. But Wednesday’s CPI data removes one of the last major obstacles to a September cut. The BLS has confirmed the next Consumer Price Index release — covering August data — is scheduled for September 11, 2026, just days before the Fed’s meeting, meaning that report will likely be the final, decisive input into the September decision (BLS).
For now, the combination of a cooling CPI print and a softening labor market has done what months of Fed commentary could not: it has largely settled the argument over the direction of the next move, leaving only the size of the cut still genuinely in question.
What was the US inflation rate in July 2026?
US CPI inflation held at 3.4% year-over-year in July 2026, with prices rising just 0.1% month-over-month, reinforcing market expectations for a Federal Reserve rate cut in September.
Discover more from The Economy
Subscribe to get the latest posts sent to your email.
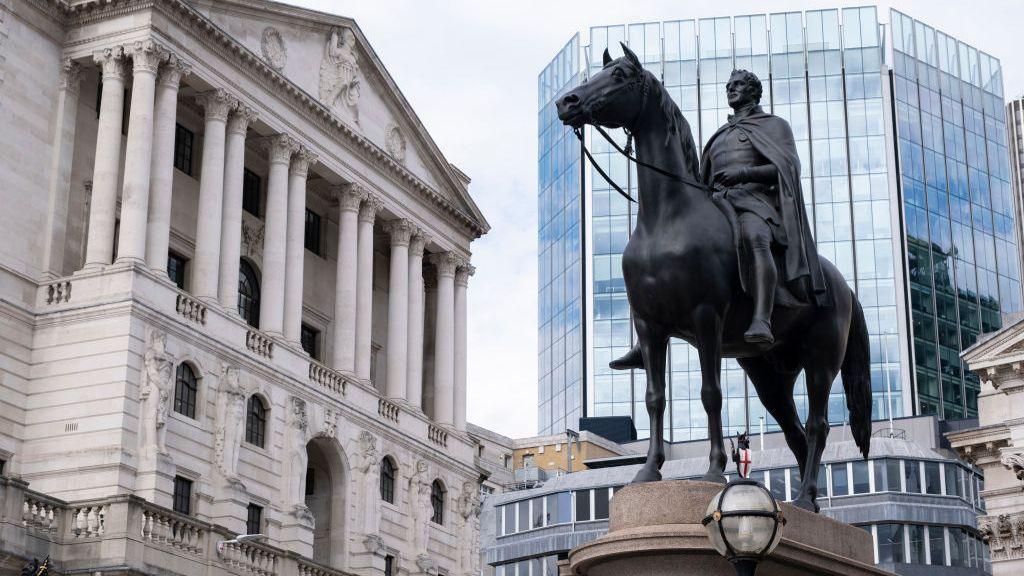
The Bank of England’s Monetary Policy Committee left interest rates unchanged at 3.75% on July 30, but the accompanying message was anything but reassuring: policymakers now expect CPI inflation to peak at around 3.2% in the fourth quarter of 2026, with “risks to the inflation outlook tilted to the upside” (House of Commons Library).
A Split Committee, a Cautious Message
The vote itself revealed real disagreement inside the Bank: six members backed holding rates steady, while three voted for a 0.25 percentage point increase — a notably hawkish split for a central bank that spent the previous 16 months gradually cutting rates from a 2023 peak of 5.25% down by a cumulative 1.5 percentage points (House of Commons Library).
Governor Andrew Bailey framed the dilemma plainly: “Inflation has fallen faster than we’d expected, but the conflict in the Middle East continues to mean high and volatile energy prices. That will cause inflation to rise again later this year,” he said, according to Hanbury Wealth’s summary of the July decision (Hanbury Wealth).
The Numbers So Far
UK CPI inflation stood at 2.6% in June 2026, down from 2.8% in May, with food price inflation easing to 1.7% — its lowest level since August 2024 (House of Commons Library). Prior to the Middle East conflict, the Bank had expected inflation to fall to around 2% from April and hold there through the rest of 2026. Instead, its June 18 forecast pointed to CPI running “a little under 3%” in Q3 and “a little over 3¼%” in Q4 — materially hotter than the pre-conflict baseline.
Why Britain Is Uniquely Exposed
The Resolution Foundation’s Q2 2026 Macroeconomic Policy Outlook identifies two structural features that make the UK more vulnerable to this energy shock than its G7 peers. First, gas accounts for 62% of final household energy consumption in Britain — by far the highest share in the G7 — and UK electricity prices are closely tied to wholesale gas costs. Second, UK interest rates have been unusually reactive: in March 2026, UK 10-year gilt yields rose more than those of any other G7 economy except Italy, reflecting both sticky inflation and stretched public finances (Resolution Foundation). The same analysis notes the IMF and OECD both cut their 2026 UK growth forecasts by 0.5 percentage points — the largest downgrade of any advanced economy.
The Labour Market Is Cooling Too
Employment data compiled by Opus Business Advisory Group shows unemployment holding at 4.9% in the three months to May, with job vacancies falling to 712,000 — almost half their 2022 level. Youth unemployment is a particular concern, running at 16.4% for those aged 16–24 in March–May 2026, up from 14.2% a year earlier. Real wage growth, adjusted for CPIH, was just 0.3% for the period — modest but a slight improvement on the near-flat readings of previous quarters (Opus Business Advisory Group).
Government Response
Prime Minister Andy Burnham has moved to cushion the cost-of-living impact directly, pledging a £2 bus-fare cap across England and the removal of VAT from household electricity bills from October, while insisting he will maintain existing fiscal rules rather than raise taxes (Hanbury Wealth). Separately, the government has announced a 20% business-rates reduction for pubs, clubs, and live-music venues from April 2027, alongside an expansion of the British Business Bank’s Growth Guarantee scheme to reach 12,000 more UK businesses — part of a wider push to arrest small-firm closures amid what the Federation of Small Businesses calls a troubling “new normal” of contraction expectations.
The Bottom Line
The British Chambers of Commerce forecasts UK GDP growth of just 0.9% for 2026, with unemployment peaking at 5.2% and inflation reaching 3.8% by year-end — modestly hotter than the Bank’s own projection. Both the BCC and IMF broadly agree the Bank should hold rates steady through the rest of 2026 rather than tighten further, betting that a restrictive-but-stable policy stance will anchor long-term inflation expectations without needlessly crushing growth (British Chambers of Commerce). Whether that bet pays off depends almost entirely on how the Middle East conflict — and the energy prices it continues to drive — evolves over the rest of the year.
What is the Bank of England’s interest rate in August 2026?
The Bank of England held its base rate at 3.75% on July 30, 2026, with policymakers projecting CPI inflation will peak near 3.2% in Q4 2026 due to Middle East-driven energy price pressures.
Discover more from The Economy
Subscribe to get the latest posts sent to your email.
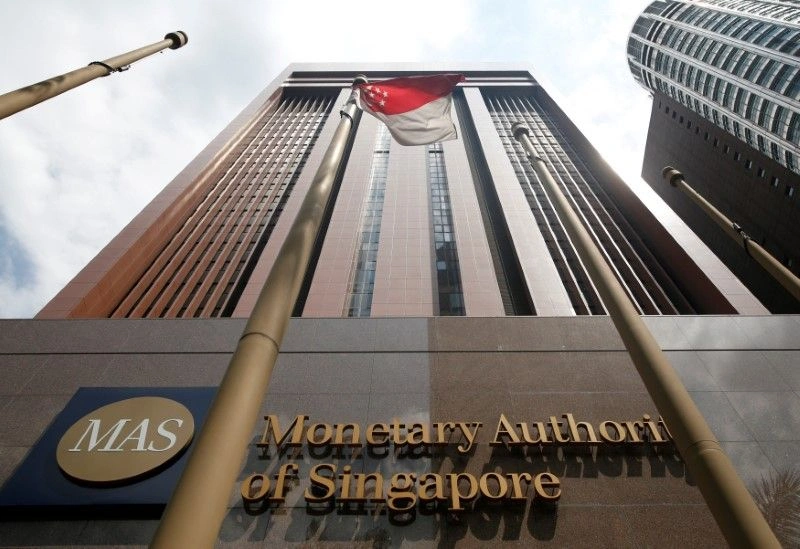
The Monetary Authority of Singapore nudged its exchange-rate-based policy stance slightly tighter in its July review, a modest but notable shift after the city-state’s economy grew a stronger-than-expected 5.7% year-on-year in the second quarter, powered by an AI-driven manufacturing boom that is increasingly reshaping the country’s growth mix.
Growth Beats Expectations Again
Singapore’s economy expanded 5.7% year-on-year in the second quarter of 2026, according to advance estimates from the Ministry of Trade and Industry released 14 July, moderating only slightly from an upwardly revised 6.3% in the first quarter, according to MAS’s own July policy statement. On a quarter-on-quarter seasonally adjusted basis, GDP rose 1.1%, continuing an unbroken run of above-trend expansion. Manufacturing has been the standout performer, posting 12.2% year-on-year growth in the second quarter — up from 8.0% in the first — driven by the electronics and precision engineering clusters riding the global AI capital expenditure wave, according to data reported by Indiplomacy.
The strength has prompted a wave of forecast upgrades. UOB Global Economics and Markets Research lifted its 2026 GDP growth forecast to 4.8% from 4%, while S&P Global Market Intelligence matched that upgrade, and Nomura flagged upside risk to its own 4.6% forecast, according to Xinhua — all comfortably above the Ministry of Trade and Industry’s official 2.0–4.0% guidance range.
MAS Leans Against Rising Core Inflation
The growth surprise has not been without cost. MAS Core Inflation, which excludes accommodation and private transport costs, rose to 1.5% year-on-year in the second quarter, up from 1.2% in the January–February period before the Middle East conflict began, according to the central bank’s own policy statement. Fuel-price surges have pushed up point-to-point transport and non-cooked food inflation, while retail goods prices have climbed on higher import costs and a tobacco tax increase.
In response, MAS increased the slope of the Singapore dollar nominal effective exchange rate (S$NEER) policy band slightly in its July review — a modest tightening move that builds on an April 2026 tightening step, according to the bank’s Macroeconomic Review. Singapore uses its exchange rate, rather than interest rates, as its primary monetary policy tool, managing the currency’s path within an undisclosed band against a basket of trading partner currencies.
The Positive Output Gap Is Widening
Perhaps the most telling technical signal in MAS’s July statement is its acknowledgment that Singapore’s positive output gap — the extent to which the economy is running above its estimated potential — is now forecast to widen further in 2026, rather than narrow as previously expected. That reflects both the stronger-than-anticipated first-half growth data and MAS’s expectation that GDP will be sustained at elevated levels near-term, powered by continued AI-related capital expenditure, a robust construction pipeline, and steady credit-driven expansion in the financial sector.
Singapore’s central bank, MAS, slightly tightened its S$NEER exchange-rate policy band in July 2026 after GDP grew 5.7% year-on-year in Q2, driven by AI-linked manufacturing growth of 12.2%. Core inflation rose to 1.5%, prompting the modest policy shift even as growth forecasts were upgraded to as high as 4.8%.
Why This Matters Beyond Singapore
As a bellwether for Asian trade and technology cycles, Singapore’s data offers one of the clearest real-time signals of how durable the global AI infrastructure buildout has become, even as broader Asian growth forecasts have been trimmed elsewhere in the region due to Middle East-driven energy costs. For global investors, the combination of resilient growth and rising core inflation puts MAS in a position other regional central banks may soon face: managing an AI-driven boom that is proving inflationary in ways that are only loosely connected to traditional demand-side overheating.
What to Watch
MAS’s next scheduled policy review will be closely watched for whether the central bank continues its gradual tightening path or judges that easing global energy costs — following the partial reopening of the Strait of Hormuz — have done enough of the disinflationary work on their own. Singapore’s full second-quarter economic survey, due after the advance estimate, will offer a fuller sectoral breakdown of where the AI-driven strength is concentrated.
Discover more from The Economy
Subscribe to get the latest posts sent to your email.

Balance of Payments (BOP)

The Falkland Islands Dispute: Sovereign Wealth, Offshore Drilling, and Market Impacts

Gross Domestic Product (GDP): Nominal vs. Real

What is Inflation and the Consumer Price Index (CPI)?

US-China Trade Competition 2026: Supply Chain Relocation Guide

Oil Prices Break $100 in 2026: Middle East Conflict & Energy Markets

South-South Trade Expansion: Digital Integration and Emerging Market Growth

$166B Tariff Refund Tapering Fast: Is Your Business Missing Out?

Stock Market Today: Dow Climbs 500 Points as Markets Shake Off Inflation Jitters

14th WTO Conference 2026: Tariffs & Global Supply Chain Impact

Swish Secures $24M Funding to Disrupt India’s $100B Food Market

Physical AI and Driverless Tech: The Next Trillion-Dollar Industrial Revolution

Enterprise AI Platforms Disrupting B2B SaaS in 2026: Full Analysis

Crypto vs. Safe Haven Assets 2026: Where Institutions Are Hedging

State Farm’s $5B Dividend 2026: Who Qualifies & Payout Dates

US-China Relations in Q3 2026: Trade Tariffs and Supply Chain Risks

Gold’s Wild 2026: From a Record $5,600 Peak to a 24% Crash and Back Toward $4,500

Oil Surges as Strait of Hormuz Traffic Collapses Again

The Rocket That Won’t Quit: Inside SpaceX’s Falcon 9 Launch Machine

Bank of England Set to Hold Rates Through Year-End, Reuters Poll Shows

SpaceX Starship Flight 14: First Orbital Attempt & Starlink V3 Launch Explained

The 2026 Crypto Regulatory Shift: What It Means for Institutional Investors

AI Chip Stocks 2026: The Best Semiconductor Investments Beyond Marvell

Retail Earnings Week: What Home Depot, Target & Walmart Reveal

AI-Powered Training: The Next Multi-Billion Dollar Ecosystem in Fitness

Russia’s Black Sea Oil Exports Fall for a Fifth Straight Week

Global Chip Selloff Deepens: What’s Driving the Aug. 19 Semiconductor Rout

Tween Back-to-School Trends 2026: What’s Driving the $85B Season
-

 Markets & Finance8 months ago
Top 15 Stocks for Investment in 2026 in PSX: Your Complete Guide to Pakistan’s Best Investment Opportunities
-

 Analysis7 months ago
Johor’s Investment Boom: The Hidden Costs Behind Malaysia’s Most Ambitious Economic Surge
-

 Analysis7 months ago
Top 10 Stocks for Investment in PSX for Quick Returns in 2026
-

 Analysis7 months ago
Brazil’s Rare Earth Race: US, EU, and China Compete for Critical Minerals as Tensions Rise
-

 Banks8 months ago
Best Investments in Pakistan 2026: Top 10 Low-Price Shares and Long-Term Picks for the PSX
-

 Investment8 months ago
Top 10 Mutual Fund Managers in Pakistan for Investment in 2026: A Comprehensive Guide for Optimal Returns
-

 Global Economy9 months ago
15 Most Lucrative Sectors for Investment in Pakistan: A 2025 Data-Driven Analysis
-

 Global Economy9 months ago
Pakistan’s Export Goldmine: 10 Game-Changing Markets Where Pakistani Businesses Are Winning Big in 2025