
Analysis
What Does the Iran Conflict Mean for Global Central Banks? The Answers Unfortunately Depend on How Long the Conflict Lasts
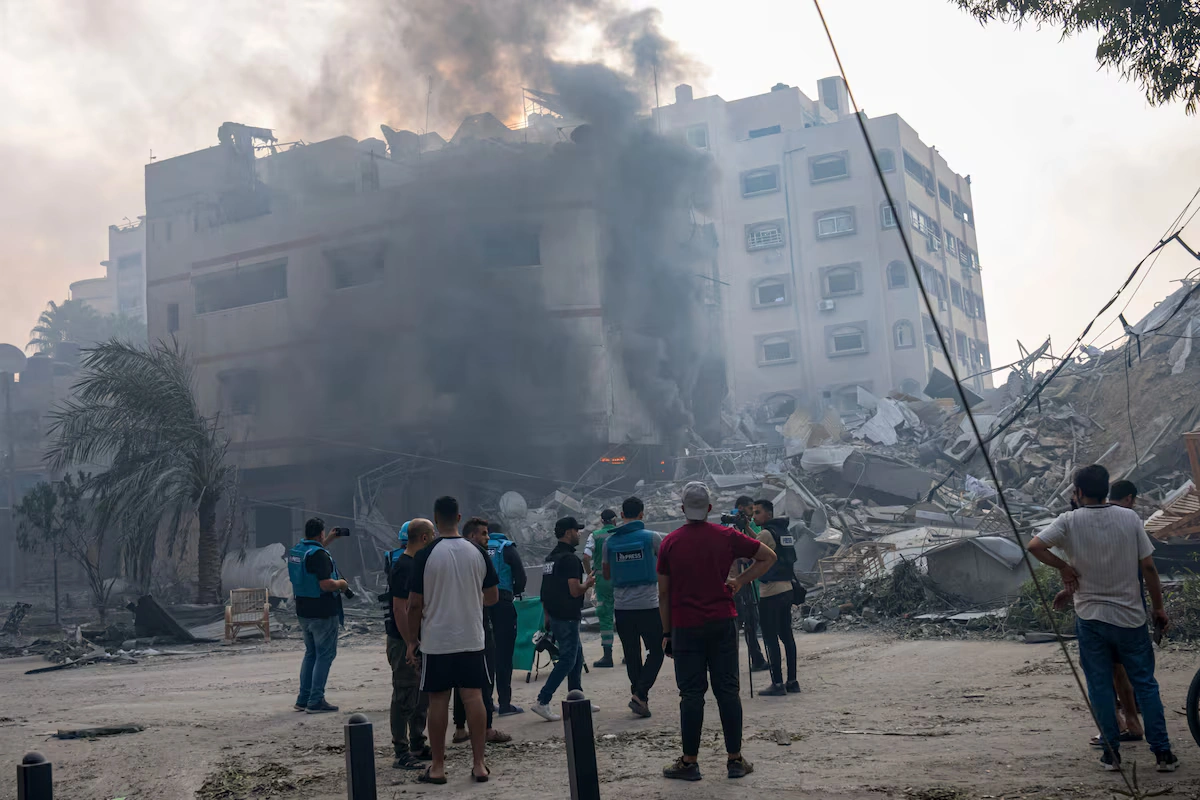
The strikes came before dawn on February 28, 2026. Within hours, the geopolitical architecture that central bankers had quietly priced into their models for years had collapsed — replaced by something far more volatile, far more dangerous, and infinitely harder to forecast. The US-Israel military campaign against Iran, which killed Supreme Leader Ayatollah Ali Khamenei along with more than 500 others in its opening salvo, did not just reshape the Middle East. It sent a seismic tremor through every trading floor, finance ministry, and central bank boardroom on the planet.
By the time Asian markets opened on March 3, the damage was already visible. Major indexes in Tokyo, Seoul, and Hong Kong shed between 2% and 2.5%. Gold — the world’s oldest fear gauge — surged past $5,330 per ounce, a record that would have seemed unthinkable even six months ago. Oil prices, already elevated by months of regional tension, lurched toward the $80–$100 per barrel range as traders frantically repriced the risk of Strait of Hormuz disruption. In Dubai and Abu Dhabi, explosions rattled skylines that had long marketed themselves as symbols of Gulf stability. Hezbollah activated across Lebanon’s southern border. US forces reported casualties in Kuwait.
Central banks — institutions built on the premise of calm, methodical deliberation — suddenly found themselves navigating a crisis with no clear runway.
The brutal truth, which policymakers in Washington, Frankfurt, Tokyo, and Mumbai are only beginning to articulate publicly, is this: what the Iran conflict means for global central banks depends almost entirely on how long the fighting lasts. Short-term containment leads to one playbook. A prolonged, multi-front war writes an entirely different one — and it is not a comfortable read.
The Oil Shock Ripple Effect
Start where every macroeconomist must start right now: oil. The oil shock from the Iran conflict is not merely a supply disruption story. Iran produces roughly 3.4 million barrels per day and controls strategic chokepoints through which nearly 20% of the world’s seaborne oil passes. As Reuters has reported, the preliminary market reaction already reflects deep anxiety about Hormuz closure scenarios, with Brent crude futures pricing in a war-risk premium not seen since the 2003 Iraq invasion.
But oil’s inflationary sting in 2026 arrives in a world that is structurally different from 2003 — or even 2022. Central banks in the US, Europe, and much of Asia spent two years aggressively tightening monetary policy to break post-pandemic inflation. Many were only beginning to ease. Rate cuts, cautiously telegraphed through late 2025, were supposed to provide relief to slowing economies. The Iran escalation has placed all of that in jeopardy.
A sustained move to $100/bbl or beyond would, according to JPMorgan’s commodities research desk, add approximately 0.5–0.8 percentage points to headline inflation across G7 economies within two quarters. For central banks already wrestling with “last-mile” disinflation — the stubborn core inflation that resists rate cuts — this is precisely the wrong kind of supply shock at precisely the wrong time.
Key inflationary transmission channels to watch:
- Fuel and energy — the most direct pass-through, affecting transport, manufacturing, and utilities within weeks
- Food prices — fertilizer costs, shipping rates, and agricultural logistics all move with oil
- Supply chain repricing — firms that endured 2022 may move faster to rebuild inventory buffers, driving input cost inflation
- Freight and insurance premiums — Gulf routing disruptions could spike global shipping costs by 30–60%, echoing Red Sea crisis dynamics from 2024
The Fed’s Dilemma in a Volatile World
No institution faces a more acute version of this dilemma than the US Federal Reserve. The impact of Iran war on the Federal Reserve is simultaneously an inflation problem, a growth problem, and a financial stability problem — all arriving at once.
Coming into February 2026, the Fed had cut rates twice from their 2024 peak and was widely expected to deliver two more cuts before year-end. That calculus is now suspended. The Fed finds itself caught between two uncomfortable poles: ease too aggressively, and it risks embedding a new inflation psychology at a moment when energy prices are spiking; hold rates too long, and it risks amplifying the contractionary demand shock that always accompanies serious geopolitical disruptions.
As the New York Times noted in its initial conflict coverage, investors are already pulling back from risk assets in patterns that mirror early COVID-era capital flight. The dollar, paradoxically, has strengthened — a typical safe-haven response — even as US equities fell. This complicates the Fed’s domestic picture: a stronger dollar tightens financial conditions without any Fed action at all.
Fed Chair messaging in the days since the strikes has been notably cautious. Expect extended “data-dependent” language that essentially means: we are waiting to see if this is a 10-day conflict or a 10-month one. The Iran geopolitical risks to monetary policy are simply too scenario-dependent for the Fed to commit to a forward path right now.
Short conflict (under 30 days): Fed likely stays on hold for one meeting cycle, resumes cut trajectory by Q2 2026 if oil retreats below $85/bbl. Prolonged conflict (3–6+ months): Fed pauses all easing indefinitely; potential rate hike discussion re-emerges if inflation re-accelerates above 3.5%.
ECB and BoE: Balancing Inflation and Growth
If the Fed’s dilemma is painful, the European Central Bank’s is arguably worse. The question of how the Iran war affects ECB rate cuts lands in a Eurozone economy that was already decelerating. Germany, never fully recovered from the energy shock of 2022–23, is particularly exposed. Europe imports roughly 90% of its oil needs, and unlike the US, it has no domestic production buffer to cushion a Gulf supply shock.
The ECB had been navigating a gentle easing cycle — the most delicate in its history — threading the needle between a weakening German industrial base and still-elevated services inflation in southern Europe. A sustained oil shock from the Iran conflict snaps that thread. ECB President Christine Lagarde faces the same stagflationary ghost that haunted her predecessor during the 2022 energy crisis: slowing growth and rising prices, with no clean policy response to either.
ING Think’s macro team estimates that a $20/bbl sustained oil increase above baseline adds roughly 0.4 percentage points to Eurozone CPI — enough to delay the ECB’s rate-cut path by at least two meetings. The Bank of England faces near-identical mathematics, compounded by the UK’s unique vulnerability to financial market volatility given London’s role as a global trading hub.
European central bank scenario matrix:
| Conflict Duration | ECB Response | BoE Response |
|---|---|---|
| Under 30 days | Pause cuts by 1 meeting | Pause cuts by 1 meeting |
| 1–3 months | Suspend 2026 cut cycle | Suspend 2026 cut cycle |
| 3–6 months | Consider emergency liquidity tools | Emergency repo window activation |
| 6+ months | Full stagflation protocol | Coordinated G7 response likely |
Asian Central Banks on High Alert
The dimension most underreported in Western financial coverage is the pressure now bearing down on Asian central banks amid Iran oil prices. And the pressure is severe — for reasons both economic and geopolitical.
Japan imports almost all of its energy. The Bank of Japan, only recently beginning its long-awaited normalization after decades of ultra-loose policy, faces a genuine threat to that trajectory. A sustained oil shock would push Japanese import costs sharply higher, weakening the yen and importing inflation through a channel the BoJ cannot easily offset with rate policy alone.
India’s Reserve Bank presents a different but equally acute case study. India is the world’s third-largest oil importer, and energy subsidies remain politically sensitive. The RBI, which had been managing a careful balance between rupee stability and growth support, now faces the prospect of renewed currency pressure as oil costs inflate the current account deficit. The Atlantic Council’s energy security desk has flagged India, Pakistan, and several Southeast Asian economies as particularly vulnerable to a prolonged Gulf conflict, given their lack of strategic petroleum reserve depth.
China occupies an ambiguous position. As a major oil importer, China suffers from higher prices. But China also has significant diplomatic and economic ties to Iran and may see strategic opportunity in a prolonged US military entanglement in the Middle East. The People’s Bank of China will likely prioritize yuan stability and domestic liquidity above all else, potentially accelerating yuan-denominated oil trade deals as a longer-term structural response.
Asian central bank pressure points at a glance:
- 🇯🇵 Bank of Japan — normalization path threatened; yen weakness accelerating
- 🇮🇳 Reserve Bank of India — current account stress, rupee under pressure, inflation uptick risk
- 🇰🇷 Bank of Korea — export growth headwinds; equity market selloff creating financial stability concern
- 🇨🇳 People’s Bank of China — yuan stabilization priority; watching US dollar dynamics closely
- 🇸🇬 Monetary Authority of Singapore — trade-dependent economy faces dual shock from oil and risk-off capital flows
uration Matters: Short vs. Long-Term Scenarios
Here is the honest reckoning that every central banker is running privately right now — and every investor should be running too.
Scenario A: Contained Conflict (Under 30 Days)
If the US-Israel campaign achieves its military objectives quickly, Iran’s retaliatory capability is degraded, and the Strait of Hormuz remains open, then oil markets could normalize toward $75–80/bbl within weeks. Gold would likely retrace from its record highs. Central banks — Fed, ECB, BoE, and the major Asian institutions — would pause briefly, absorb the data, and resume their pre-conflict trajectories by mid-2026. This is the market’s base case as of early March, reflected in the relatively contained (if painful) equity selloffs.
Scenario B: Prolonged Conflict (3–6+ Months)
This is where the geopolitical risks to the global economy in 2026 become genuinely systemic. A multi-month war involving Iranian missile campaigns, Hezbollah front activation, and potential Hormuz closure would constitute the most significant energy supply shock since 1973. In this scenario:
- Oil sustains above $100/bbl, potentially spiking toward $130–150/bbl in a Hormuz closure event
- Global inflation re-accelerates, forcing central banks into a new tightening cycle — or at minimum, abandoning all planned easing
- Recession risk in Europe rises sharply; US growth slows materially
- Emerging markets with dollar-denominated debt face a brutal combination of a strong dollar, high oil, and capital flight
- Central banks may be forced into rare coordinated action — reminiscent of 2008 and 2020 — to stabilize financial markets
As the Wall Street Journal’s economics desk has observed, the policy toolkit for stagflationary shocks is genuinely limited. You cannot simultaneously fight inflation and support growth through conventional rate policy. Something has to give.
The Deeper Question: Is Monetary Policy Even the Right Tool?
There is a broader, uncomfortable truth buried in all of this analysis. Central banks are being asked to manage consequences of a geopolitical crisis they had no hand in creating and no power to resolve. The Iran conflict and central banks narrative often implies that the right interest rate setting can somehow insulate economies from war. It cannot.
What monetary policy can do is prevent a supply shock from becoming a permanent inflation psychology, maintain financial system liquidity, and signal credibility to markets under stress. What it cannot do is replace the barrels of oil that stop flowing, rebuild the supply chains disrupted by Gulf instability, or restore the business confidence shattered by images of explosions in Dubai.
The Financial Times’ coverage of central bank responses has rightly noted that the real test will be coordination — between central banks, between fiscal authorities, and between allied governments on strategic petroleum reserve releases. The International Energy Agency has already begun consultations on coordinated SPR deployment, a move that could take as much as 1.5–2 million barrels per day of supply pressure off the market if executed at scale.
Central Bank Response Comparison Table
| Central Bank | Pre-Conflict Stance | Short Conflict Response | Prolonged Conflict Response |
|---|---|---|---|
| US Federal Reserve | Gradual easing | Pause cuts, hold | Halt easing; hike risk if inflation >3.5% |
| European Central Bank | Gentle easing cycle | Delay 1–2 cuts | Suspend cycle; stagflation protocol |
| Bank of England | Cautious easing | Hold and reassess | Emergency liquidity measures |
| Bank of Japan | Early normalization | Slow normalization | Pause; defend yen via intervention |
| Reserve Bank of India | Neutral/mild easing | Currency intervention | Rate hold; capital flow management |
| People’s Bank of China | Selective stimulus | Yuan stabilization | Accelerate alternative trade mechanisms |
| Bank of Korea | Hold | Hold; equity market monitoring | Emergency rate cut risk if recession |
What History Tells Us — And Why 2026 Is Different
The 1973 Arab oil embargo. The 1979 Iranian Revolution. The 1990 Gulf War. The 2003 Iraq invasion. Each of these conflicts produced oil shocks that reshaped monetary policy for years. But 2026 is different in several important ways that make simple historical analogies dangerous.
First, central banks enter this crisis with far less policy room than they had in most prior episodes. Interest rates, while off their peaks, remain above neutral in most major economies. Quantitative easing balance sheets are still elevated. The “whatever it takes” toolkit is not empty — but it is leaner.
Second, the global economy in 2026 is more financially interconnected than at any prior point in history. Sovereign wealth funds from the Gulf states manage trillions in global assets. A prolonged conflict could force asset liquidations that ripple through bond and equity markets in ways entirely unrelated to oil prices themselves.
Third — and perhaps most importantly — this conflict involves direct US military action, not proxy involvement. The geopolitical risk premium on the dollar, on US Treasuries as safe havens, and on the broader rules-based international economic order is being repriced in real time.
Conclusion: Diversify, Stay Informed, and Resist Panic
The honest answer to the question posed in this article’s headline is also the most unsatisfying one: we don’t know yet. The Iran conflict’s meaning for global central banks will be written in the days and weeks ahead as the military situation either stabilizes or deepens.
What we do know is this: central banks will be reactive, not proactive. They will watch oil, watch inflation expectations, watch currency markets, and watch credit spreads with extraordinary vigilance. They will communicate carefully and commit cautiously. And they will be managing the consequences of a war, not solving it.
For investors, the message is equally clear. Geopolitical risks to the global economy in 2026 are no longer tail risks — they are the central scenario. Portfolios built on the assumption of continued easing cycles and stable energy markets need urgent reassessment.
Consider speaking with a qualified financial advisor about:
- Energy sector exposure and commodity diversification
- Safe-haven asset allocation (gold, CHF, JPY in a contained scenario)
- Duration risk in bond portfolios given inflation uncertainty
- Emerging market exposure, particularly in oil-importing Asian economies
- Geographic diversification away from single-region concentration
The world’s central banks are doing what they always do in moments like this: buying time, gathering data, and hoping the politicians and generals resolve the crisis before they are forced to make decisions no monetary tool was designed to handle. The rest of us would be wise to prepare for the possibility that this time, the hoping may not be enough.
Sources & Further Reading:
- Reuters: How US-Iran tensions could shape world markets
- New York Times: Investors Brace for Stock Market’s Reaction
- Wall Street Journal: What the Iran Conflict Means for the Global Economy
- Financial Times: What does the Iran conflict mean for global central banks?
- JPMorgan Commodities Research
- Atlantic Council: Gulf Energy Security
- ING Think: Eurozone Macro Analysis
Discover more from The Economy
Subscribe to get the latest posts sent to your email.


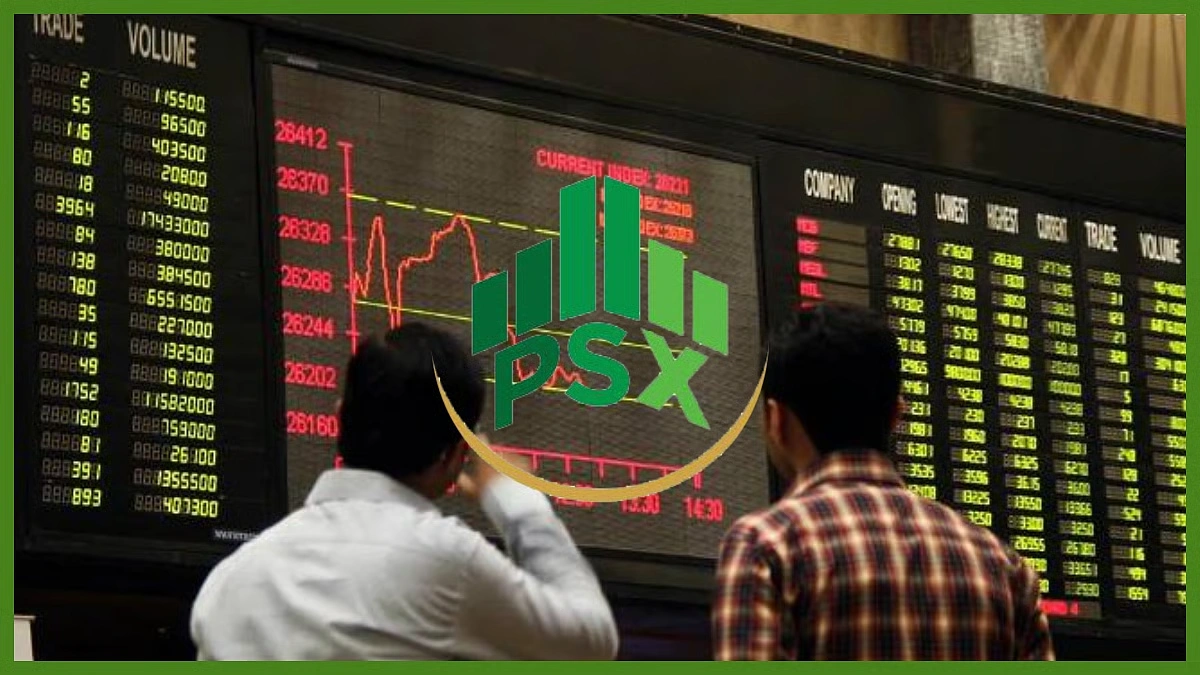
The KSE-100 index collapsed 9.57% on March 2, 2026 — its worst-ever single-day absolute loss — as US-Israel strikes on Iran triggered a PSX bloodbath, oil shock, and global market panic. Here’s the full breakdown.
Key Facts at a Glance
| Metric | Value |
|---|---|
| KSE-100 Closing Value (Mar 2, 2026) | 151,972.99 |
| Points Lost (Single Day) | 16,089.17 |
| Percentage Decline | 9.57% |
| Intraday Low | 151,747.96 |
| Circuit Breaker Triggered | 9:22 AM PKT |
| Brent Crude (Day’s High) | ~$82.00/barrel |
| Gold | $5,327/oz (+1%) |
| Previous Close (Feb 28) | 168,062.17 |
| Drawdown from Jan 2026 Peak | ~19% |
It began not with the opening bell, but with silence — the particular, loaded silence of traders staring at screens as the world they priced for had, overnight, become a different one entirely. By 9:22 on a Monday morning in Karachi, the Pakistan Stock Exchange had effectively declared an emergency, triggering a mandatory trading halt after the benchmark KSE-100 index plummeted 15,071 points — nearly 9% — in less than half an hour of trading. When markets finally closed, the KSE-100 had shed 16,089 points to settle at 151,972.99, a decline of 9.57% that constitutes the worst absolute single-day loss in the exchange’s history.
This was no ordinary correction. This was the market’s verdict on a new and dangerous world.
The Trigger: When Washington and Tel Aviv Changed the Calculus
The proximate cause was a seismic geopolitical event that investors had feared but hoped would remain theoretical. Over the weekend of February 28–March 1, 2026, the United States and Israel launched what the White House described as “major combat operations” in Iran, reportedly killing Supreme Leader Ayatollah Ali Khamenei in the opening strikes. Tehran’s response was swift and broad: retaliatory missile barrages targeting US military installations across the Gulf, with blasts reported in the UAE, Qatar, Bahrain, Kuwait, Jordan, and Saudi Arabia.
Dubai International Airport was briefly engulfed in chaos, with footage showing people fleeing a smoke-filled passageway as Iran’s missile salvos — mostly intercepted — sent shockwaves through Gulf infrastructure. President Trump, characteristically blunt, suggested the campaign could last another four weeks.

For energy markets, the threat to the Strait of Hormuz was the true horror. Roughly 15 million barrels of crude oil per day — approximately 20% of the world’s total oil supply — transit the Strait daily, making it the planet’s most consequential energy chokepoint. Marine tracking sites showed tankers piling up on either side, unable to obtain insurance for the voyage. Brent crude surged 9% to $79.41 a barrel in early Monday trading, while West Texas Intermediate climbed 8.6% to $72.79 — the steepest single-day energy price spike since the brief Israel-Iran war of 2025.
The PSX Collapse: Anatomy of a Historic KSE-100 Plunge
Pakistan, as a major net oil importer and a nation whose western border already simmers with Afghan tensions, sits at an especially exposed node in this crisis network. The market did not wait for analysis.
The benchmark index closed at 151,972.99, plunging 16,089.17 points or 9.57% in a single session. It traded within a wild intraday range of 7,580 points, recording a high of 159,328.59 and a low of 151,747.96, reflecting extreme volatility throughout the session. Total trading volume surged to 479.70 million shares.
Monday’s decline marks the KSE-100’s highest-ever single-day fall in absolute terms. Historically, the largest percentage decline was on June 1, 1998 at 12.4%, but due to the lower base of the index at that time, it does not rank in the top ten for absolute point drops. Today’s crash, in sheer numerical magnitude, stands alone.
The circuit breaker fired at 9:22 AM after the KSE-30 fell 5% from its previous close. Following the resumption of trading around 10:22 AM, strong recovery momentum briefly emerged, pushing the index more than 6,000 points higher from its intraday floor — before selling pressure re-emerged and erased those gains.
Market breadth told a brutal story: of the 100 index companies, only one closed higher, 98 declined, and one remained unchanged. The heaviest individual drags were Fauji Fertilizer Company (-1,595 pts), UBL (-1,301 pts), Engro Holdings (-886 pts), Hub Power (-718 pts), and Meezan Bank (-681 pts).
Sector Damage (Index Points Lost):
| Sector | Points Eroded |
|---|---|
| Commercial Banks | 5,031.81 |
| Fertilizer | 2,192.22 |
| Oil & Gas Exploration | 1,715.57 |
| Cement | 1,428.11 |
| Investment Companies/Securities | 982.42 |
Pakistan’s Particular Vulnerability
Why did Karachi suffer so much more than London, Frankfurt, or New York? The answer is structural, not merely psychological.
Pakistan imports the vast majority of its energy needs. Every $10 rise in the per-barrel price of crude translates to roughly $2.5 billion in additional annual import costs — a meaningful sum for an economy currently navigating IMF-supervised stabilisation. Analysts were quick to connect the dots: “Elevated oil prices are highly detrimental to Pakistan’s external account, and persistently high commodity prices are likely to trigger a new wave of inflation,” said Waqas Ghani, Head of Research at JS Global.
The country was already navigating a dual-front stress test. Pakistan’s Defence Minister had described the situation with Afghanistan as tantamount to “open war,” and the KSE-100 has now fallen nearly 19% from its record high of 189,166.83 set in January 2026, edging dangerously close to the 20% threshold commonly associated with a formal bear market.
In the week before Monday’s collapse, the index had already shed 5,107 points — a 2.9% weekly decline. The PSX crash of March 2 was therefore not a surprise attack on a healthy market, but a breaking point on an already-fractured one.
The Global Picture: A Coordinated Rout
Pakistan’s pain was severe, but it was not isolated. Global markets opened the week sharply lower after the US-Israel strikes on Iran rattled investors across every time zone. In the US, S&P 500 futures were down 1.1%, Nasdaq 100 futures fell 1.5%, and the Dow Jones futures slid 1.1%. In Europe, the pan-European Stoxx 600 fell nearly 1.8% during Monday’s session.
Asian markets joined the rout: India’s Sensex fell 1.3%, Taiwan’s benchmark lost 0.9%, and Singapore’s dropped 2.3%. Bangkok’s SET fell 4%, while the UAE and Kuwait temporarily closed their own stock markets entirely, citing “exceptional circumstances.”
Gold surged to $5,408.10 per ounce — a 3.1% single-day gain — as the classic safe-haven flight took hold. The US dollar strengthened against most emerging-market currencies, adding a secondary pressure on Pakistan’s rupee and its debt-servicing capacity.
Standard Chartered’s Global Head of Research Eric Robertsen noted that investors had already been underpricing geopolitical risk, pointing to commodity-linked currencies outperforming as markets began pricing exposure to scarce resources and terms-of-trade winners.
What Analysts and Economists Are Saying
The bull case for containment: Quantum Strategy’s David Roche argued that the market impact depends almost entirely on duration. If the conflict remains short and contained, he noted, the risk-off move and oil spike could be brief — referencing the June 2025 pattern, when Israel struck Iranian nuclear sites and equities sold off sharply at the open before recovering once it became clear the Strait of Hormuz was not disrupted.
The bear case for escalation: Goldman Sachs estimated that oil prices could blow past $100 a barrel if there is an extended disruption to Strait of Hormuz flows — a scenario with severe implications for Pakistan’s current account and inflation trajectory.
The structural concern: Arif Habib Limited (AHL), in its latest note, highlighted that despite the near-term pressure, the tail-end of March typically marks the beginning of a seasonally bullish period for the KSE-100, and that following an almost 15% drawdown, the index appears poised for a rebound towards the 175,000 level, with sustained support above 165,000 likely to underpin such a move.
Recovery Scenarios: Three Possible Paths Forward
Scenario 1 — Swift De-escalation (30–45 days) If the US-Iran conflict remains largely aerial and does not close the Strait of Hormuz, global oil markets could retrace sharply. Pakistan would benefit from falling crude prices, a stabilizing rupee, and renewed risk appetite for frontier markets. KSE-100 recovery to 165,000–170,000 is plausible by April.
Scenario 2 — Prolonged Campaign (60–90 days) A sustained conflict, particularly one that throttles Strait of Hormuz traffic, would push Brent above $90–100, forcing Pakistan to burn through foreign exchange reserves at an accelerated pace and potentially triggering an emergency IMF review. The KSE-100 could test support at 140,000.
Scenario 3 — Regime Change and Uncertainty The death of Ayatollah Khamenei opens a power vacuum scenario in Iran that few analysts have priced. Ben Emons of FedWatch Advisors argued that leadership strikes in Tehran raise regime-change tail risks and leave an uncertain endgame — potentially the most destabilizing medium-term outcome for all regional markets, including PSX.
Actionable Insights for Investors
This is not a moment for panic, but it is a moment for precision. Here is what the data suggests:
1. Energy-linked plays carry double risk. Pakistani oil marketing companies and refineries face margin compression from higher crude costs even as revenues appear to rise in PKR terms. The sector’s net impact is negative for most listed names.
2. Banks face a credit cycle test. Commercial banks, which bore the largest index-point losses today, face rising non-performing loan risk if a fresh inflation cycle materializes. However, their healthy net interest margins — built during the high-rate era — provide a buffer. Selectively accumulating quality names on dips remains a viable strategy.
3. Fertilizer stocks are caught in a vice. Higher natural gas costs (linked to LNG imports) and falling farm-gate prices from commodity pressure could squeeze margins. Fauji Fertilizer’s 1,595-point drag on the index today reflects this anxiety.
4. Technicals matter now. AHL’s observation that the KSE-100 remains 7% above its 200-day moving average is significant — it represents a long-term structural support that institutional investors will defend. Breach of 145,000 would mark genuine capitulation territory.
5. Watch the Strait, not just the headlines. The single most important variable for Pakistan’s macro outlook over the next 30–60 days is not battlefield developments, but whether marine traffic through the Strait of Hormuz normalizes. A functional strait = manageable oil shock. A blocked strait = crisis conditions.
The Bigger Picture
Pakistan’s PSX bloodbath today is, in one sense, a microcosm of a broader truth about the global economy in 2026: the world has underpriced geopolitical risk for years, and it is now receiving the bill. From Karachi to Frankfurt, from the Gulf tanker lanes to Wall Street’s futures desks, the US-Israel strikes on Iran have created a risk-repricing event of genuine historical significance.
The Pakistan Stock Exchange, with its volatile frontier-market character, tends to price these shocks faster and harder than more liquid peers. That same characteristic means it tends to recover faster when clarity returns. The question Pakistani investors — and the government — must answer urgently is: what decisions, made today, preserve the most options for that recovery?
Discover more from The Economy
Subscribe to get the latest posts sent to your email.
Analysis | China’s AI Strategy | Global Technology Review
How China’s low-cost AI models—10 to 20 times cheaper than US equivalents—are quietly building global tech dependence, reshaping the AI race, and challenging American dominance.
In late February 2026, ByteDance unveiled Seedance 2.0, a video-generation model so capable—and so strikingly inexpensive—that it sent tremors through Silicon Valley boardrooms. The timing was no accident. Within days, Anthropic filed a legal complaint alleging that a Chinese national had systematically harvested outputs from Claude to train a rival model, a practice known in the industry as “distillation.” The accusation crystallized what many AI executives had quietly been saying for months: China is not simply competing in artificial intelligence. It is running a fundamentally different play.
The strategy is elegant in its ruthlessness. While American frontier labs—OpenAI, Google DeepMind, Anthropic—compete on the technological frontier, racing to build the most powerful and most expensive models imaginable, China’s leading AI developers are racing in the opposite direction. They are making AI astonishingly cheap, broadly accessible, and deeply entangled in the infrastructure of developing economies. Understanding how cheap AI tools from China compare to American frontier models is not merely a technology question. It is a question about who writes the rules of the next era of the global economy.
| Metric | Figure |
|---|---|
| Chinese AI global market share, late 2025 | 15% (up from 1% in 2023) |
| Cost advantage vs. US equivalents | Up to 20× cheaper |
| Alibaba AI investment commitment through 2027 | $53 billion |
The Sputnik Moment That Changed Everything
When DeepSeek released its R1 reasoning model in January 2025, the reaction in Washington was somewhere between bewilderment and alarm. US officials, accustomed to treating American AI supremacy as a structural given, struggled to explain how a Chinese startup—operating under heavy export restrictions that denied it access to Nvidia’s most advanced chips—had produced a model that matched, or in certain benchmarks exceeded, OpenAI’s o1. Reuters (2025) described the release as “a wake-up call for the US tech industry.”
The label that stuck was borrowed from Cold War history. Investors, policymakers, and researchers began calling DeepSeek’s R1 “a Sputnik moment”—a demonstration that the adversary had capabilities that had been systematically underestimated. The reaction was visceral: Nvidia lost nearly $600 billion in market capitalization in a single trading session. But the deeper implication was not about one model or one company. It was about a method.
“The real disruption isn’t that China built a good model. It’s that China built a cheap model—and cheap changes everything about adoption curves, lock-in, and geopolitical leverage.”
— Senior analyst, Brookings Institution Center for Technology Innovation
DeepSeek’s R1 was trained at an estimated cost of under $6 million, a fraction of what OpenAI reportedly spent on GPT-4. The model was open-sourced, triggering an avalanche of derivative models across Southeast Asia, Latin America, and sub-Saharan Africa. The impact of low-cost Chinese AI on US dominance had moved from hypothetical to measurable. By the fourth quarter of 2025, Chinese AI models had captured approximately 15% of global market share, up from roughly 1% just two years earlier, according to estimates cited by CNBC (2025).
Five Models and Counting: The Pace Accelerates
DeepSeek was only the opening act. Within weeks, five additional significant Chinese AI models had shipped—a pace that surprised even close observers of China’s technology sector. ByteDance’s Doubao and the Seedance family of multimodal models, Alibaba’s Qwen series, Baidu’s ERNIE updates, and Tencent’s Hunyuan collectively constitute what The Economist (2025) termed China’s “AI tigers.”
American labs have pushed back hard. Anthropic’s legal complaint over distillation practices reflects a broader industry concern: that Chinese developers are not merely competing on engineering talent but systematically harvesting the intellectual output of Western models to accelerate their own. The accusation is significant because distillation—training a smaller, cheaper model on the outputs of a larger one—is not illegal in most jurisdictions, but it sits in a legal and ethical gray zone that could reshape how frontier AI outputs are licensed and protected. Chatham House (2025) has observed that the practice “blurs the line between legitimate benchmarking and intellectual property extraction at scale.”
UBS Picks Its Winners
Not all Chinese models are created equal, and sophisticated institutional actors are drawing distinctions. Analysts at UBS, in a widely circulated note from early 2026, indicated a preference for several Chinese models—specifically Alibaba’s Qwen and ByteDance’s Doubao—over DeepSeek for enterprise deployments, citing more consistent performance on structured reasoning tasks and better compliance tooling for regulated industries. The note was striking precisely because it came from a global financial institution with every incentive to avoid geopolitical controversy. The risks of dependence on Chinese AI platforms, apparently, are acceptable to some of the world’s most sophisticated institutional investors when the price differential is this large.
Key Strategic Insights
- China’s cost advantage is structural, not temporary. Priced 10 to 20 times cheaper per API call, the gap reflects architectural innovation, lower energy costs, and in some cases state subsidy—making it durable over time.
- Emerging markets are the primary battleground. In Indonesia, Nigeria, Brazil, and Vietnam, Chinese AI tools have penetrated developer ecosystems faster than US equivalents because local startups and governments simply cannot afford American pricing.
- Open-sourcing is a deliberate geopolitical instrument. By releasing models under permissive licenses, Chinese developers seed global ecosystems with their architectures, creating dependency on Chinese tooling, Chinese fine-tuning expertise, and Chinese cloud infrastructure.
- The distillation controversy signals a new phase. As US labs tighten access and output monitoring, the cat-and-mouse dynamics of knowledge extraction will intensify, potentially reshaping how AI models are licensed globally.
- Hardware self-reliance is advancing faster than anticipated. Cambricon’s revenue surged over 200% in 2025 as domestic chip demand spiked, while Baidu’s Kunlun AI chips are now deployed across major Chinese data centers at scale.
The Comparison Table: US vs. Chinese AI
| Model | Origin | Relative API Cost | Global Reach Strategy | Open Source? | Hardware Dependency |
|---|---|---|---|---|---|
| OpenAI GPT-4o | 🇺🇸 US | Baseline (1×) | Enterprise, developer API; premium pricing | No | Nvidia (Azure) |
| Anthropic Claude 3.5 | 🇺🇸 US | ~0.9× | Safety-focused enterprise; selective access | No | Nvidia (AWS, GCP) |
| Google Gemini Ultra | 🇺🇸 US | ~0.85× | Google ecosystem integration; enterprise cloud | Partial (Gemma) | Google TPUs |
| DeepSeek R1 | 🇨🇳 CN | ~0.05–0.10× | Global open-source seeding; developer ecosystems | Yes | Nvidia H800 / domestic chips |
| Alibaba Qwen 2.5 | 🇨🇳 CN | ~0.07× | Emerging markets via Alibaba Cloud; multilingual | Yes | Alibaba custom silicon |
| ByteDance Doubao / Seedance | 🇨🇳 CN | ~0.06× | Consumer apps; TikTok ecosystem integration | Partial | Mixed (domestic + Nvidia) |
| Baidu ERNIE 4.0 | 🇨🇳 CN | ~0.08× | Government contracts; domestic enterprise | No | Baidu Kunlun chips |
Winning the Hardware War From Behind
No analysis of how China’s cheap AI is creating global tech dependence is complete without confronting the chip question. The Biden and Trump administrations’ export controls—restricting Nvidia’s H100, A100, and subsequent architectures from reaching Chinese buyers—were designed to create a permanent computational ceiling. The assumption was that frontier AI requires frontier silicon, and frontier silicon would remain American. That assumption is under sustained pressure.
Huawei’s Atlas 950 AI training cluster, unveiled in late 2025, represents the most credible challenge yet to Nvidia’s dominance in the Chinese market. Built around Huawei’s Ascend 910C processor, the cluster offers training performance that analysts at the Financial Times (2025) described as “approaching, though not yet matching, Nvidia’s H100 at scale.” More telling is the trajectory. Cambricon Technologies, China’s leading AI chip specialist, reported revenue growth exceeding 200% in fiscal 2025 as domestic AI developers pivoted aggressively to domestic silicon under regulatory pressure and patriotic procurement directives.
Baidu’s Kunlun chip line, meanwhile, is now powering a significant share of the company’s own inference workloads—reducing dependence on imported hardware at the exact moment when US export restrictions are tightening. China’s AI strategy for becoming an economic superpower is not predicated on surpassing American chip technology in the near term. It is predicated on becoming self-sufficient enough to sustain its cost advantage while US competitors remain anchored to expensive, constrained silicon supply chains. Brookings (2025) has noted that “China’s domestic chip ecosystem has advanced by at least two to three years relative to projections made in 2022.”
The Emerging Market Gambit
Silicon Valley’s pricing model was always implicitly designed for Silicon Valley’s clients: well-capitalized Western enterprises with robust cloud budgets and tolerance for compliance complexity. The rest of the world—which is to say, most of the world—was an afterthought. Chinese AI developers recognized this gap and moved into it with precision.
In Vietnam, government agencies have begun piloting Alibaba’s Qwen models for document processing and citizen services, drawn by price points that make comparable US offerings economically untenable for a developing-economy public sector. In Nigeria, startup accelerators report that the majority of AI-native companies in their cohorts are building on Chinese model APIs—not out of ideological preference but because the economics are simply not comparable. Indonesian developers have contributed tens of thousands of fine-tuned model variants to open-source repositories built on DeepSeek and Qwen foundations, creating exactly the kind of community lock-in that platform companies spend billions trying to manufacture.
The implications for tech sovereignty are profound and troubling. As Chatham House (2025) argues, when a country’s critical AI infrastructure is built on a foreign model’s weights, architecture, and increasingly its cloud services, the notion of digital sovereignty becomes largely theoretical. Data flows toward Chinese servers. Fine-tuning expertise clusters around Chinese tooling ecosystems. Regulatory leverage accrues to Beijing.
“Ubiquity is more powerful than superiority. The question is not which AI is best—it is which AI is everywhere.”
Alibaba’s $53 Billion Signal
If there was any residual doubt about the strategic ambition behind China’s AI push, Alibaba’s announcement of a $53 billion AI investment commitment through 2027 should have resolved it. The scale dwarfs most national AI strategies and rivals the combined R&D budgets of several major US technology companies. Critically, the investment is not concentrated in a single prestige project. It is spread across cloud infrastructure, model development, developer tooling, international data centers, and—pointedly—subsidized access programs for emerging-market customers.
This is the architecture of dependency, built deliberately. Offer cheap access. Embed your tools in critical workflows. Build the developer community on your frameworks. Then, when the switching costs are high enough and the alternatives have atrophied from neglect, the pricing conversation changes. It is the playbook that Amazon ran with AWS, that Google ran with Search, and that Microsoft ran with Office—now being executed at geopolitical scale by a state-aligned corporate champion with essentially unlimited political backing. Forbes (2025) characterized the investment as “less a corporate bet than a national infrastructure program wearing a corporate uniform.”
Is China Winning the AI Race?
The question is, in one sense, the wrong question. “Winning” implies a finish line, a moment when one competitor’s supremacy is declared and ratified. Technological competition does not work that way, and the AI race least of all. What China is doing is more subtle and, in the long run, potentially more consequential: it is restructuring the terms of global AI participation in ways that favor Chinese platforms, Chinese architectures, and Chinese geopolitical interests.
On pure technical capability, American frontier labs retain meaningful advantages at the absolute cutting edge. OpenAI’s reasoning models, Google’s multimodal systems, and Anthropic’s safety-focused architectures represent genuine innovations that Chinese competitors are still working to match. The New York Times (2025) noted that US models continue to lead on complex multi-step reasoning and long-context tasks by measurable margins. But capability at the frontier matters far less than capability at the median—at the price point, integration depth, and ecosystem richness that determine what the world actually uses.
China is winning that race. Not through theft or brute force, though allegations of distillation practices suggest the competitive lines are not always clean, but through a coherent, patient, and strategically sophisticated campaign to make Chinese AI the default choice for a world that cannot afford American alternatives. The risks of dependence on Chinese AI platforms—data sovereignty concerns, potential for access interruption under geopolitical pressure, embedded architectural assumptions that may encode specific values—are real and documented. They are also, increasingly, being accepted as the price of access by a world that Western AI pricing has effectively priced out.
History suggests that the technology that becomes ubiquitous becomes infrastructure, and infrastructure becomes power. China’s AI developers have understood this clearly. The rest of the world is just beginning to reckon with what it means.
Discover more from The Economy
Subscribe to get the latest posts sent to your email.
Analysis
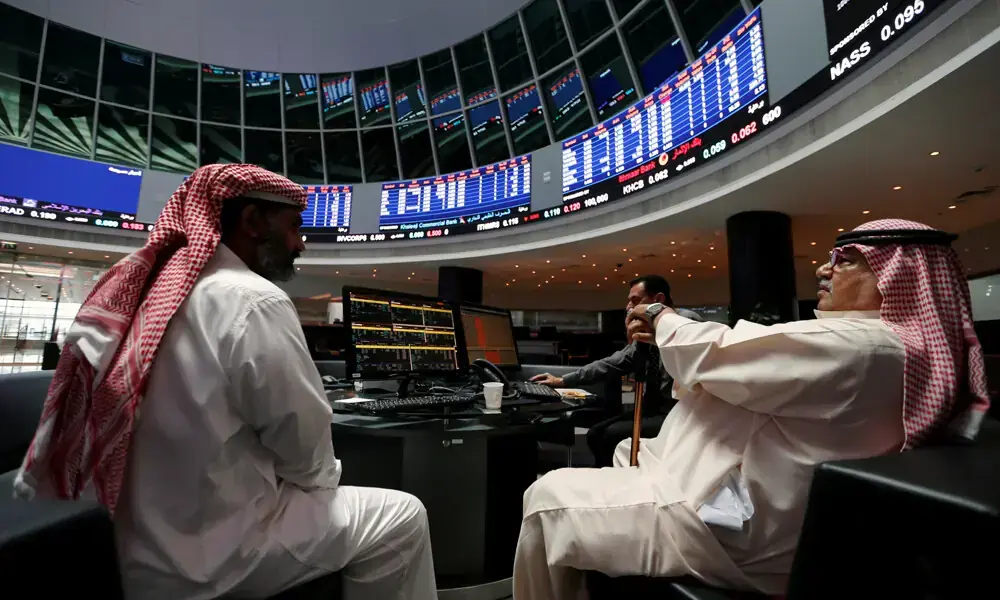
Qatari Stocks Plunge Amid Iran Retaliation: UAE Markets Shuttered as Middle East Tensions Escalate Gulf Economic Fallout
Gulf stock markets reeled on March 2–3, 2026, as Qatar’s QE Index dropped 3.3–3.7%, UAE bourses shut for two days, and Brent crude surged past $82 a barrel—the sharpest regional market shock since the 2003 Iraq War—after Iran’s retaliatory strikes targeted cities across the Gulf following the killing of Supreme Leader Ali Khamenei.
On the morning of March 2, 2026, the trading floors of Doha fell silent under the weight of something that felt less like economics and more like history. Smoke was still rising over parts of Dubai. Reports of explosions above Doha had persisted for a second consecutive day. Major airports across the Gulf—Abu Dhabi, Dubai, Doha—were either shuttered or operating at drastically curtailed capacity. And when Qatar’s benchmark stock index opened for the first time since the weekend’s cataclysm, it fell with a velocity that told its own grim story.
The trigger was unambiguous: a coordinated U.S.–Israeli military campaign, code-named Operation Epic Fury, had killed Iranian Supreme Leader Ayatollah Ali Khamenei and struck Iran’s nuclear and military infrastructure. Tehran’s response was swift, sweeping, and historic—hundreds of missiles and drone barrages aimed at U.S. military installations and civilian infrastructure across every major Gulf state. The region that had spent three decades marketing itself as the world’s most reliable crossroads of commerce was, overnight, a theatre of war.
The economic consequences have been immediate, measurable, and—depending on how the next seventy-two hours unfold—potentially generational. This is the story of what happened to Gulf markets, why it matters to the world, and what comes next.
The Events That Shook a Region
The strikes began on Saturday, February 28. By Sunday, March 1, as Reuters reported (DA 94), Iran had launched retaliatory attacks not just against Israel but across a remarkable geographic arc—Kuwait, Bahrain, Jordan, Saudi Arabia, Iraq, Oman, Qatar, and crucially, the UAE. Three people were killed in the UAE alone; hundreds of missiles and drones were intercepted, but many penetrated defenses, hitting near Zayed Port in Abu Dhabi and triggering alarm across residential districts in Dubai.
Israel launched fresh strikes on Tehran on Sunday, prompting yet another wave of Iranian barrages—a cycle of action and retaliation that President Donald Trump indicated on Truth Social would continue, in his words, “uninterrupted throughout the week or as long as necessary.” Iran, for its part, had IRGC (Islamic Revolutionary Guard Corps) forces broadcasting VHF warnings to vessels in the Strait of Hormuz: “No ship is allowed to pass.”
“Iran’s continuing missile and drone strikes on GCC countries have pushed markets into uncharted territory.” — Iridium Advisors, March 1, 2026
The Strait of Hormuz—a 33-kilometre-wide chokepoint through which, according to the U.S. Energy Information Administration, roughly 20 million barrels of oil transit daily—had effectively ceased to function. Tankers were idling on both sides of the strait. One oil tanker was struck off the coast of Oman. Insurance underwriters pulled coverage. Bloomberg (DA 94) confirmed that tanker traffic through the world’s most critical energy corridor had “largely halted.”
Gulf Market Reactions: A Market in Freefall
The financial verdict was swift and brutal. As reported by Zawya, Qatar’s QE Index—which had been closed for a public holiday on Sunday—opened Monday morning and dropped between 3.3% and 3.7%, with every single constituent falling. The country’s biggest bank, Qatar National Bank, declined 3.7%. Qatar Islamic Bank plunged 5.2%—on course for its worst single session since August 2023—after HSBC cut its price target. Maritime and logistics firm Qatar Navigation tumbled 6.2%, and LNG shipping company Qatar Gas Transport retreated 4.1%.
Qatar’s exposure is not merely symbolic. It is home to the largest U.S. military base in the region—Al Udeid Air Base—making it simultaneously a target and a linchpin of Western strategic positioning. Its LNG infrastructure, among the world’s most productive, is precisely the kind of asset that makes markets nervous when missile trajectories are being plotted nearby.
The UAE’s response was more radical, and in some ways more revealing. Bloomberg (DA 94) confirmed that the UAE Capital Markets Authority directed both the Abu Dhabi Securities Exchange (ADX) and the Dubai Financial Market (DFM) to remain closed on March 2 and March 3. The regulator cited its “supervisory and regulatory role” and committed to monitoring the situation on an “ongoing basis.” The unspoken reason was starker: a market reopening amid missile strikes against a city whose entire economic identity is built on stability would have risked a rout.
Dubai’s modern identity—built from a fishing village into a $500 billion economy through ports, aviation, real estate, and financial services—now faced an existential stress test. “The UAE relies on the frictionless movement of people and goods,” Stephen Fallon, founder of DBM Consulting, told The National (DA 76). “This is really bad for states like the UAE, because this is sort of the necessary oxygen to their economic model.”
Elsewhere, Saudi Arabia’s Tadawul All-Shares Index opened Sunday down 4.8%, recovering to close 2.2% lower. Kuwait suspended trading entirely—citing “exceptional circumstances”—while Bahrain fell 1%, Oman declined 1.4%, and Egypt’s blue-chip index, after plunging 5.5% in early trade, settled 2.5% down.
Oil Prices Surge: The Energy Shock Beneath the Headlines
The deeper and more globally consequential dimension of this crisis is oil. When futures markets opened Sunday evening, they moved with the kind of speed that suggests not just fear, but structural alarm. CNBC (DA 93) reported that Global benchmark Brent crude jumped approximately 9%, or $6.54, to $79.41 a barrel. Earlier in the session, Brent briefly spiked to $82.37—its highest level since January 2025—before settling back.
Barclays analysts revised their Brent crude forecast to $100 per barrel from an earlier estimate of $80, while UBS warned that a material disruption to Strait of Hormuz flows could push prices above $120 per barrel. CNBC (DA 93) noted that Amrita Sen of Energy Aspects expects prices to hold around the $80 level, absent a complete Hormuz closure. But the critical caveat is the qualifier: absent.
“Roughly one-fifth of global oil supply passes through the Strait of Hormuz… markets are more concerned with whether barrels can move than with spare capacity on paper.” — Jorge León, Rystad Energy
The Strait of Hormuz handles approximately 30% of the world’s seaborne crude oil, nearly 20% of global jet fuel, and about 16% of gasoline and naphtha, Al Jazeera (DA 92) reported. Some 84% of crude transiting the strait is bound for Asian markets—China, India, Japan, and South Korea accounting for 69% of all flows. A prolonged disruption does not merely rattle Gulf economies; it structurally threatens Asian manufacturing supply chains, inflationary dynamics in import-dependent economies, and the broader trajectory of global growth.
OPEC+ moved to boost production by 206,000 barrels per day in April—more than analysts expected—but energy analysts were circumspect. “Additional production will provide limited immediate relief, making access to export routes far more important than headline output targets,” said Jorge León of Rystad Energy. Saudi Arabia does have contingency infrastructure—an East-West pipeline connecting its Gulf terminals to Red Sea export facilities—which could partially compensate. But Iraq, Kuwait, and UAE have no such alternative.
Geopolitical Stakeholders: A Fractured Calculus
Every party in this escalation carries competing imperatives that make resolution as complex as the conflict itself.
The United States launched the strikes with stated objectives around Iran’s nuclear program. President Trump described Operation Epic Fury as an “overwhelming military offensive” that would continue until its objectives are achieved, framing economic disruption as a manageable secondary variable. The Atlantic Council offered a sober counterweight: during U.S. operations in Iraq between 2003 and 2011, crude averaged roughly $72 per barrel in nominal terms—well above the pre-crisis baseline of this conflict. The global economy adapted then; analysts argue it can adapt again. The strategic dilemma, however, is that prolonged price pressure may force a premature exit before nuclear objectives are secured.
Gulf States occupy an uncomfortable middle ground—dependent on American security guarantees, deeply intertwined with Iran economically and through sectarian politics, and now literally in the crosshairs. UAE officials sought to project normalcy: Abu Dhabi National Oil Company (ADNOC) announced its operations were continuing without interruption, a signal to international markets that core energy infrastructure remained intact. But Dubai International Airport’s suspension of operations—affecting one of the world’s busiest aviation hubs—was a visible and visceral disruption that no press release could fully offset.
Iran under post-Khamenei leadership faces an existential reckoning. The killing of the Supreme Leader creates not just a power vacuum but potentially a legitimacy crisis for the entire theocratic architecture of the Islamic Republic. Whether hardliners consolidate control and intensify strikes, or pragmatists seek off-ramps through negotiation, is the single most important variable in the coming days.
Israel continues fresh strike waves even as Iran retaliates—a posture that suggests a willingness to see the conflict expand rather than stabilize. Israeli officials have long argued that a nuclear-armed Iran represents an existential threat; this military action reflects a strategic judgment that the window to prevent that outcome is narrowing.
The Broader Economic Ripple: Supply Chains, Inflation, and Investor Sentiment
Beyond the immediate market shock, Reuters (DA 94) characterized Iran’s retaliatory strikes as triggering “the most widespread business disruption in the region since the pandemic.” The UAE federal labor authority advised companies to implement remote working through March 3. Major international firms with regional headquarters in Dubai and Abu Dhabi began activating business continuity protocols. Shipping insurance premiums—even for routes not directly through Hormuz—began climbing as underwriters repriced geopolitical risk across the entire region.
Khaled El Khatib, chief market analyst at easyMarkets, identified Dubai and Saudi Arabia as the most exposed to fast, volatile market reactions given their integration into international capital flows. “The foreign participation in the Saudi market, and the ‘safe haven’ title for the UAE market will make them more exposed to short-term volatility,” he said. This observation carries structural weight: the very attributes that made these markets attractive to international capital—openness, liquidity, integration—have made them more vulnerable to crisis-driven outflows.
For oil-producing states—particularly Saudi Arabia and Qatar—elevated crude prices deliver a fiscal windfall even as they absorb geopolitical risk. “Elevated oil prices provide a fiscal cushion for producers such as Saudi Arabia and Qatar,” Reuters noted, “strengthening revenues and liquidity.” Saudi Aramco shares, paradoxically, rose 1.5% on Monday as investors priced in the revenue upside. This fiscal duality—crisis as both threat and unexpected beneficiary—is one of the more counterintuitive dynamics of Gulf economics.
The Outlook: Duration Is Everything
The dominant variable in every projection—market, energy, geopolitical—is duration. A short, sharp conflict with a swift diplomatic resolution would likely see Gulf markets recover within weeks, oil prices ease, and aviation and shipping resume. History offers precedent: Israel’s 12-day conflict with Iran in 2025 produced oil spikes that reversed sharply upon ceasefire.
A protracted conflict is a categorically different scenario. CNN (DA 95) cited oil analyst Ellen Wald warning that if vessels avoid the Strait for weeks, “we will probably have some serious problems, particularly in Asia, for availability of crude oil and oil products”—potentially producing “serious price hikes and potentially even shortages.” Mohammed Ali Yasin, CEO of Ghaf Benefits, was blunt: “Markets will continue to be fragile and volatile as long as the military actions are active.”
Three scenarios present themselves. In the most benign, a U.S.–Iran ceasefire emerges within days—perhaps brokered through Omani or Swiss intermediaries—and markets rally sharply on relief. In a moderate scenario, weeks of limited strikes continue but Hormuz flows partially resume; oil stabilizes around $80–85 and Gulf markets discount a prolonged but bounded disruption. In the most severe scenario, sustained attacks on energy infrastructure or a complete Hormuz closure pushes Brent toward $120, triggers inflation surges in Asian economies, and imposes lasting reputational damage on the UAE’s status as a global business hub.
Conclusion: The Price of Proximity
There is a profound irony embedded in this crisis. The Gulf states spent forty years transforming themselves from oil-dependent backwaters into diversified, internationally integrated economies precisely to insulate themselves from the region’s endemic volatility. Dubai built the world’s busiest airport. Abu Dhabi listed its sovereign companies on international exchanges. Doha hosted world cups and peace negotiations. All of it was predicated on the implicit promise of stability—that geography could be decoupled from geopolitics.
That premise is now under its most direct challenge in decades. The Strait of Hormuz drop—so narrow a vessel barely fits—has always been the region’s economic Achilles heel. The events of this week have made that vulnerability undeniable to every institutional investor, every shipping insurer, every airline, and every global supply chain manager with Asian exposure.
And yet the region’s resilience should not be underestimated. Gulf sovereign wealth funds hold trillions in diversified global assets. Oil revenues—however they came to spike—will flow into reserves that underpin long-term economic planning. The fundamental commodity that the Gulf sits atop remains the most strategically important on earth. These are not economies that collapse under pressure; they absorb it, adapt to it, and—in the best historical cases—emerge stronger.
The question is not whether the Gulf will survive this crisis. It is what form of survival awaits—and at what cost, measured not just in basis points and barrel prices, but in the confidence that made this corner of the world worth watching in the first place.
Discover more from The Economy
Subscribe to get the latest posts sent to your email.
-

 Markets & Finance2 months ago
Top 15 Stocks for Investment in 2026 in PSX: Your Complete Guide to Pakistan’s Best Investment Opportunities
-

 Analysis3 weeks ago
Brazil’s Rare Earth Race: US, EU, and China Compete for Critical Minerals as Tensions Rise
-

 Investment2 months ago
Top 10 Mutual Fund Managers in Pakistan for Investment in 2026: A Comprehensive Guide for Optimal Returns
-

 Banks1 month ago
Best Investments in Pakistan 2026: Top 10 Low-Price Shares and Long-Term Picks for the PSX
-

 Asia2 months ago
China’s 50% Domestic Equipment Rule: The Semiconductor Mandate Reshaping Global Tech
-

 Global Economy2 months ago
What the U.S. Attack on Venezuela Could Mean for Oil and Canadian Crude Exports: The Economic Impact
-

 Global Economy2 months ago
Pakistan’s Export Goldmine: 10 Game-Changing Markets Where Pakistani Businesses Are Winning Big in 2025
-

 Global Economy2 months ago
15 Most Lucrative Sectors for Investment in Pakistan: A 2025 Data-Driven Analysis