
Analysis
Oil Prices Set to Skyrocket as Iran Closes Strait of Hormuz Following US-Israel Strikes

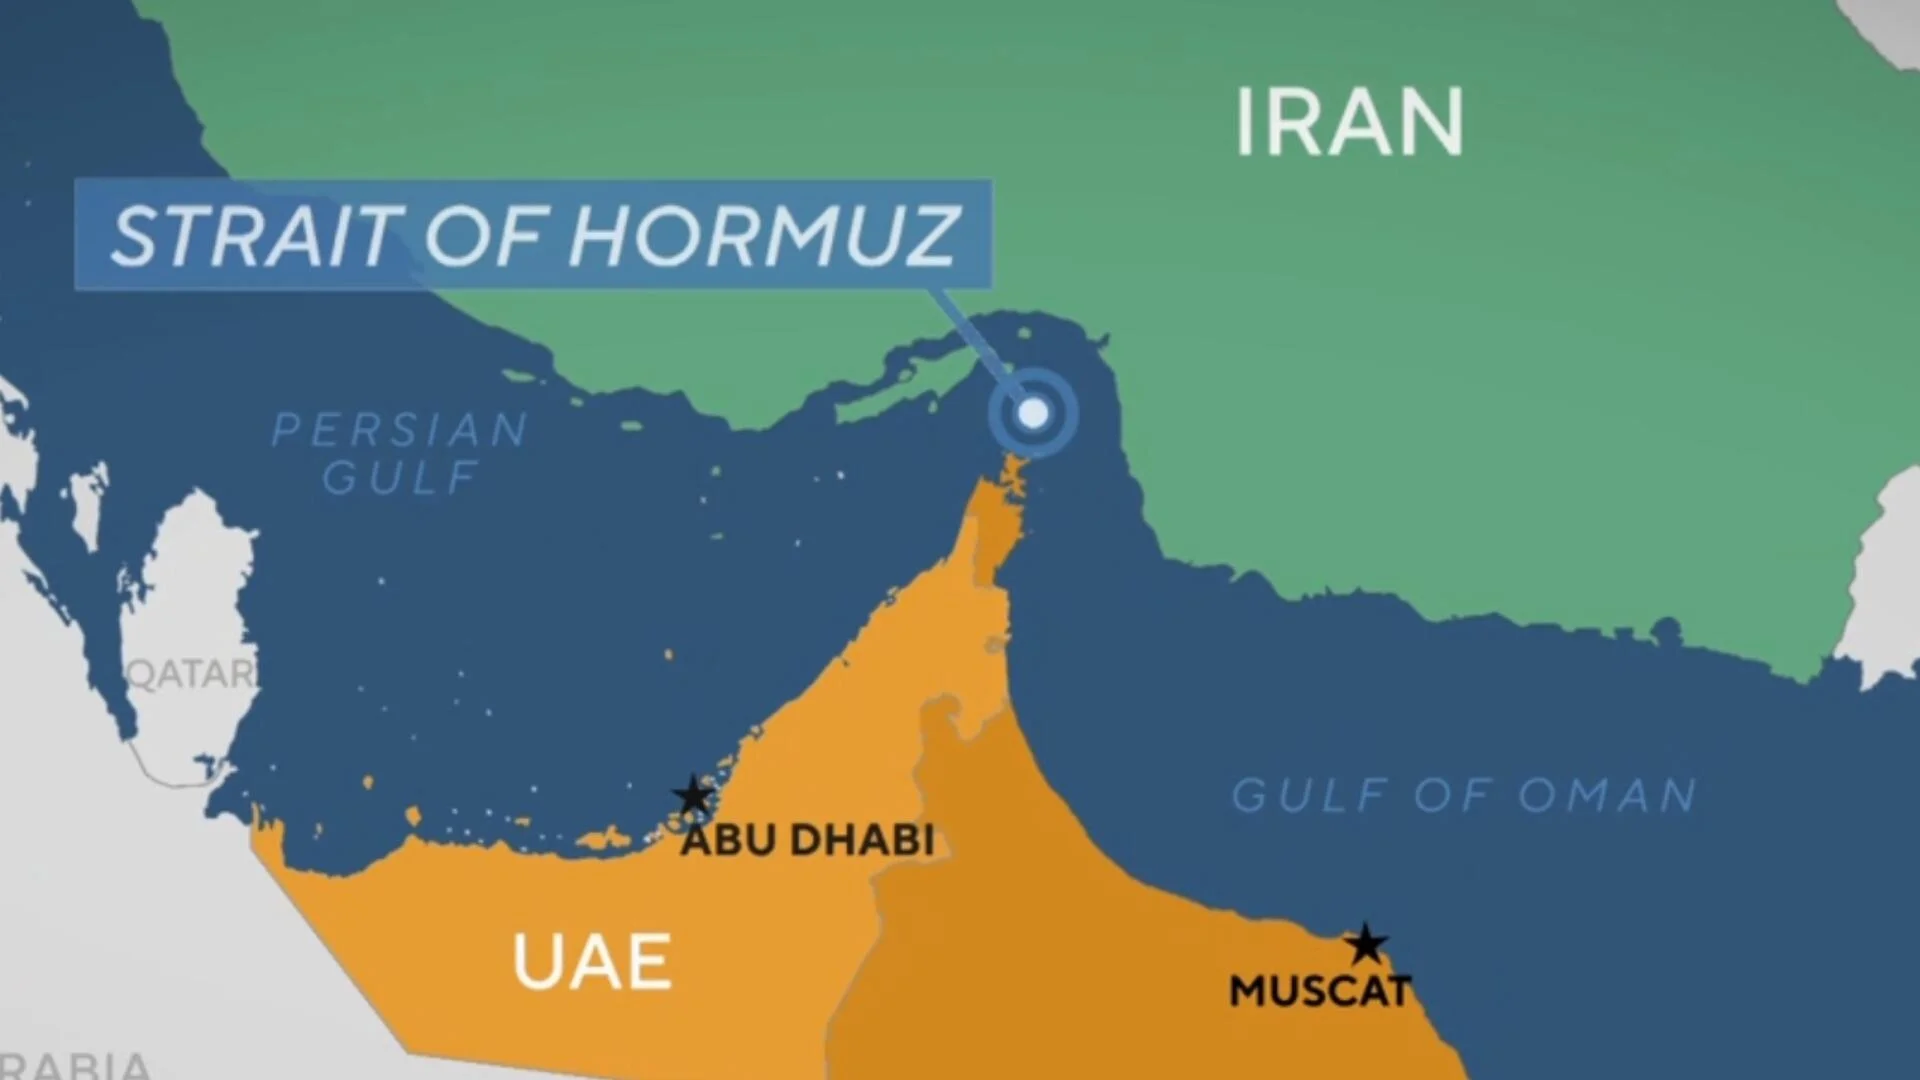
Iran has closed the Strait of Hormuz after US-Israel strikes on February 28, 2026. With 20% of global oil supply at risk, Brent crude—trading at $72.87 before markets close—could surge to $100–$140. Here’s what it means for the global economy.
On the morning of February 28, 2026, smoke was still rising above Tehran when the world’s most consequential maritime chokepoint fell silent to commercial tankers. Iran’s state-run Tasnim News Agency confirmed what oil traders had dreaded for decades: the Strait of Hormuz, a narrow 21-mile-wide waterway through which roughly 20 percent of the world’s entire oil supply flows daily, has been closed in the wake of coordinated US-Israel strikes on Iranian military and governmental targets. Markets are not yet open — they will be on Monday — but the tremors are already being felt across futures exchanges, commodities desks, and the corridors of OPEC ministries from Riyadh to Abu Dhabi.
This is not merely a geopolitical crisis. It is a potential structural rupture in the architecture of global energy supply.
What Happened: The Strikes That Changed Everything
Shortly before dawn on Saturday, US President Donald Trump announced what he called “major combat operations” in Iran, saying the US military, acting in coordination with Israel, was targeting Iran’s missile industry, leadership infrastructure, and defense installations. Multiple cities, including Tehran, Shiraz, and Isfahan, reported explosions. Iran’s foreign minister, Seyed Abbas Araghchi, denounced the assault as “wholly unprovoked, illegal, and illegitimate,” and confirmed that Iran’s supreme leader Ayatollah Ali Khamenei and the president remained alive. Iran swiftly launched retaliatory missiles toward Israeli territory.
The strikes came after diplomatic talks in Geneva — mediated by Oman’s Foreign Minister — failed to produce a nuclear agreement. Reuters reported that some of the world’s largest oil majors and trading houses had already suspended crude shipments through the strait within hours of the attacks, citing four trading sources. Iran’s Tasnim News Agency subsequently confirmed the Strait of Hormuz had been closed, invoking what analysts call the “Hormuz card” — a threat Tehran has held, and never previously played in full, for nearly four decades.
President Trump’s own video address that morning had specifically called for neutralizing Iran’s navy, a signal, analysts note, that Washington anticipated Tehran would reach for its most powerful economic weapon.
The Strait of Hormuz: Why This Chokepoint Has No Equal
To understand the magnitude of what is unfolding, it is worth stepping back from the headlines and examining the geography of global energy.
The Strait of Hormuz sits between Iran to the north and Oman to the south, connecting the Persian Gulf to the Gulf of Oman and, ultimately, to the Indian Ocean and global markets. According to the US Energy Information Administration (EIA), approximately 20 million barrels of oil and petroleum products transited the strait daily in 2024, representing close to 20 percent of global liquid oil consumption. Bloomberg notes the strait handles roughly a quarter of the world’s entire seaborne oil trade. Market intelligence firm Kpler puts seaborne crude flows alone at around 13 million barrels per day in 2025, accounting for roughly 31 percent of global seaborne crude.
The strait also carries 22 percent of global LNG trade, making it uniquely critical for both oil-importing nations in Asia and gas-dependent economies in Europe.
Unlike the Suez Canal or even the Red Sea — where Houthi disruptions over the past year prompted painful but ultimately navigable rerouting — the Strait of Hormuz has no viable alternative. Existing pipeline capacity can divert only a fraction of these flows. ING Group’s commodities strategy team calculates that even accounting for all available pipeline diversions, approximately 9 million barrels per day of crude oil and 6 million barrels per day of refined products remain fully exposed to disruption if the strait is compromised.
As one Foreign Policy analysis put it bluntly: “Unlike the Red Sea and the Suez Canal, Hormuz does not have any real alternatives.”
Oil Price Forecasts: From $72 to $140 — What Analysts Say
| Scenario | Brent Crude Forecast | Source |
|---|---|---|
| Pre-strike baseline (Feb 28 close) | $72.87/bbl | Market data |
| Partial disruption / tanker harassment | $80–$100/bbl | ING Group, Lombard Odier |
| Iranian export infrastructure damaged | ~$90/bbl peak, then retreat | Goldman Sachs |
| Full Hormuz blockade (sustained) | $120–$140/bbl | J.P. Morgan, ING Group |
| Worst-case: regime collapse scenario | $110+/bbl sustained | Nomura, Business Standard |
Brent crude closed 2.87 percent higher at $72.87 per barrel on Friday, and West Texas Intermediate (WTI) ended at $67.02, both reflecting mounting risk premiums even before the strikes were confirmed, according to The National. On decentralized exchange Hyperliquid, oil-linked perpetual futures had already surged more than 5 percent in overnight trading, with one contract advancing above $86, per CoinDesk.
Vandana Hari, chief executive of Singapore-based Vanda Insights, told The National she expected prices to jump to $80 per barrel in a “knee-jerk reaction” if the war continues into Monday’s open. Swiss bank Lombard Odier estimated that a prolonged disruption to the Strait of Hormuz could produce a temporary spike to $100 per barrel or beyond. J.P. Morgan’s analysis, cited by TheStreet, warned that a full blockade could push prices to $120–$130 per barrel.
ING Group’s Warren Patterson, head of commodities strategy, is starker still: a successful sustained blockade would push Brent to $140 per barrel, at which point “higher prices would be needed to ensure demand destruction” — the brutal market mechanism where consumption collapses because it becomes unaffordable.
The current geopolitical risk premium already embedded in the oil price is estimated at $10 per barrel by ING and Goldman Sachs, meaning that in a scenario where tensions de-escalate rapidly — if, say, a ceasefire is announced — a pullback of $10 or more is equally possible.
Cause and Consequence: What Triggered This and Who Moved First
The strikes of February 28 did not emerge from a vacuum. Diplomatic talks between the US and Iran had been ongoing through February, mediated by Oman in Geneva, with both sides reportedly making “significant progress” on nuclear issues as recently as Thursday. But Trump had set an aggressive deadline — one the Iranian side was either unable or unwilling to meet in full. Washington’s core demands included a complete cessation of uranium enrichment, the handover of enriched stockpiles, limits on ballistic missile development, and an end to support for regional proxies. Tehran, which insists its nuclear program is civilian in nature, sought to retain limited enrichment rights and the lifting of crippling economic sanctions.
When those talks adjourned without a deal, US and Israeli forces moved.
Critically, Trump stated in his video address that the objective was to “eliminate imminent threats from the Iranian regime” and called on the Iranian military to stand down — language that many analysts interpreted as signaling a potential regime-change goal rather than a limited deterrent strike. That distinction matters enormously for the oil market. A regime-change campaign would imply a prolonged conflict, greater Iranian desperation, and a far higher probability that Tehran actually uses the Hormuz card, rather than merely threatening it.
Ripple Effects: Inflation, Shipping, and the Global Consumer
The economic consequences of a prolonged Hormuz disruption would radiate far beyond the pump price.
Inflation: Rising oil prices feed directly into consumer price indices through transportation, manufacturing, and energy costs. CNBC noted that higher energy costs would make it harder for central banks to cut borrowing costs or support growth — particularly painful for economies already navigating elevated debt loads. In the United States, which heads into mid-term elections later in 2026, the political sensitivity of energy price spikes adds a layer of domestic constraint on the administration’s options.
Shipping: Very Large Crude Carrier (VLCC) rates on Middle East-to-China routes had already tripled since the start of 2026, exceeding $150,000 per day — the highest since 2020. A Hormuz closure would send these rates into uncharted territory. Iran’s “shadow fleet,” which accounts for roughly 18 percent of global tanker capacity, has already seen 86 percent of its vessels targeted by US sanctions, further tightening the available shipping pool.
LNG markets: If Hormuz is disrupted, global LNG prices could retest the record highs of 2022, according to analysts cited by Reuters. For European nations that spent 2022–2023 rewiring their gas import infrastructure away from Russia, this would be a second consecutive energy shock within four years.
Insurance premiums: Maritime war risk insurance costs are expected to spike by 200–400 percent in a sustained disruption scenario, per Mirae Asset Sharekhan analysts, adding further cost to every barrel that does manage to move through alternative routes.
The Global Stakes: China, India, and Europe in the Crosshairs
No economy faces a more direct exposure to Hormuz disruption than China. Over 80 percent of Iran’s oil exports are bound for Chinese refineries, and China’s total Gulf crude imports — from Saudi Arabia, Iraq, the UAE, and Kuwait combined — transit the strait entirely. Beijing has spent the past two years quietly building strategic oil stockpiles at roughly 1 million barrels per day, a buffer that provides some cushion, but nothing close to absorbing months of disruption. More broadly, China views Iran as a critical node in its Belt and Road trade architecture, meaning Beijing has both economic and strategic incentives to push for de-escalation — but limited direct leverage over either Washington or Tehran in this crisis.
India, which has substantially grown its dependence on discounted Russian and Gulf crude, faces comparable vulnerability. The country’s refinery infrastructure is calibrated for Middle Eastern crude grades that flow exclusively through Hormuz. A disruption at this scale would force emergency diversions and likely compel India to draw on strategic reserves while its economy absorbs a significant inflation shock.
Europe, largely dependent on pipeline gas and LNG from Gulf and US sources, faces the twin pressure of rising energy import costs and the inflationary knock-on effects of a global oil spike. The region had already navigated extraordinary energy disruptions following Russia’s invasion of Ukraine in 2022; a second major supply shock within four years would test the resilience of consumer confidence and industrial competitiveness across the continent.
Can the Strait Actually Be Closed? The Military Calculus
Experts are divided on Iran’s practical ability to sustain a Hormuz closure. The Congress Research Service has noted that a full closure has never occurred in history — even during the Iran-Iraq War of the 1980s, when Iran mined the strait and attacked tankers, traffic continued. The US Fifth Fleet is permanently stationed in Bahrain, with carrier strike groups and mine countermeasure vessels specifically designed and drilled for a Hormuz contingency. Trump’s own video address specifically called for neutralizing Iran’s navy as a war objective, suggesting US planners were pre-emptively targeting the capability Iran would need to sustain any blockade.
Analysts at Foreign Policy caution that while “Iran can degrade enough that it cannot sustain a closure of the strait,” it remains “less likely to completely remove the threat of one-off attacks or harassment of vessels.” The practical reality, in other words, is likely to be not a binary open-or-closed scenario, but a sustained period of elevated risk, intermittent attacks, and dramatically inflated shipping and insurance costs — all of which have substantial economic effects even without a full closure.
Critically, Saudi Arabia and the UAE have already positioned themselves to absorb some of the supply gap. Amro Zakaria, global financial markets strategist at Kyoto Network, confirmed that Gulf producers were ramping up output before the conflict erupted. “Saudi, the UAE, etc., were already boosting production to cover for any disruptions. They can more than replace Iranian exports — of course, as long as there are no Gulf disruptions,” Robin Mills, CEO of Qamar Energy, told The National.
OPEC+ producers are also holding an emergency meeting on Sunday to evaluate whether to increase output quotas beyond the planned 137,000 barrels per day increment — potentially a significant stabilizing signal for markets heading into Monday’s open.
The Road Ahead: De-escalation or Prolonged Crisis?
The central question now facing energy markets, governments, and consumers is duration. Quantum Strategy’s David Roche framed it to CNBC as a simple fork: if the conflict is short and contained, the oil spike and risk-off market move will be sharp but brief, reverting once the strait reopens and Iranian supply stabilizes. If it becomes a three-to-five-week campaign aimed at regime change, markets would price in prolonged supply disruption — and the global economy would face something analysts are already calling potentially “three times the severity of the Arab oil embargo and the Iranian Revolution combined.”
Three pathways are now in view. The first is a rapid ceasefire or diplomatic intervention — perhaps through China, Oman, or the UN Security Council, which has called an emergency meeting — that halts the strikes and reopens the strait quickly. The second is a targeted, time-limited campaign that degrades Iran’s military capabilities without toppling the regime, followed by a negotiated re-engagement. The third — and most disruptive — is a full regime-change war lasting weeks or months, during which the Hormuz threat becomes a persistent structural feature of oil markets rather than a tail risk.
Nomura’s analysts note that a longer war, paradoxically, might ultimately be bearish for oil prices — as history from the Russia-Ukraine conflict suggests that markets adapt over time, alternative supplies fill gaps, and the initial war premium gradually fades. The short-term shock, however, would be severe.
For now, the world waits for Monday’s market open. The numbers will tell their own story — but the human and economic stakes behind them are already clear.
Key Data Summary
| Metric | Figure | Source |
|---|---|---|
| Daily oil flow through Hormuz | ~20 million barrels | EIA, 2024 |
| Share of global oil supply | ~20% | EIA / NPR |
| Share of global LNG trade | ~22% | Congress Research Service |
| Brent crude close, Feb 28 (pre-open) | $72.87/bbl | Market data |
| WTI close, Feb 28 (pre-open) | $67.02/bbl | Market data |
| Current geopolitical risk premium | ~$10/bbl | ING Group, Goldman Sachs |
| Partial disruption price estimate | $80–$100/bbl | Lombard Odier, ING |
| Full blockade price estimate | $120–$140/bbl | J.P. Morgan, ING Group |
| VLCC tanker rate (Middle East–China) | $150,000+/day | Mirae Asset Sharekhan |
| Iran daily oil exports | ~1.9–3.1 million bbl/day | IEA, OPEC |
Discover more from The Economy
Subscribe to get the latest posts sent to your email.



Navigating Mortgage and Loan Refinancing in a High-Yield Environment
Global public debt crossing critical thresholds has kept central bank policies volatile, resulting in fluctuating US Treasury yields throughout 2026. For homeowners and commercial property holders burdened by previous high-interest borrowing cycles, finding optimal refinance windows has become a high-stakes financial puzzle. Stalled disinflation and stubborn employment numbers mean rate cuts are incremental, requiring borrowers to act with precision.
Timing your mortgage or commercial loan refinance in this environment requires a deep understanding of yield curve movements and lender risk appetites.
Decoding 2026 Refinance Dynamics
The 10-Year Treasury Yield Benchmark
Mortgage rates continue to track closely with the 10-year US Treasury yield. When macroeconomic anxiety spikes debt issuance, yields rise, tightening consumer borrowing capacity. Savvy borrowers monitor weekly Treasury auctions to lock in rates during brief dip windows.
Hybrid ARMs and Alternative Structures
With fixed rates remaining elevated, 7/1 and 10/1 adjustable-rate mortgages (ARMs) have surged in popularity. These products offer lower initial monthly payments, giving borrowers breathing room until central bank easing cycles fully materialize.
| Loan Product | Current Rate Range | Best For | Key Risk Factor |
| 30-Year Fixed Mortgage | 6.2% – 6.8% | Long-term predictability | Higher initial monthly outlay |
| 7/1 Hybrid ARM | 5.5% – 5.9% | Short-term ownership / flipping | Rate reset risk after year 7 |
| Commercial Refinance | 7.0% – 8.2% | Corporate asset restructuring | Strict DSCR lender covenants |
Actionable Steps for Successful Refinancing
To maximize your chances of securing favorable refinance terms in a volatile market, follow a disciplined preparation strategy.
Boost Your Credit Score Immediately: Lenders in 2026 are applying stringent credit tiering; a 20-point increase can drop your APR by a crucial quarter-point.
Shop Regional Credit Unions: Smaller financial institutions often offer portfolio loans with more flexible underwriting than major national banks.
Calculate the Break-Even Point: Ensure your total closing costs are recouped through monthly savings within 24 months of closing.
“Market Strategist View: Refinancing in 2026 is an exercise in opportunistic timing. Borrowers must maintain immaculate financial profiles ready to strike the moment Treasury yields dip.”
Mastering the complexities of today’s debt environment ensures you can successfully lower your debt service costs and protect your long-term financial stability.
Discover more from The Economy
Subscribe to get the latest posts sent to your email.

The days of pulling generic auto insurance quotes based purely on your zip code and age are officially over. In 2026, insurance comparison engines are powered entirely by generative AI and real-time telematics. These platforms digest thousands of live data points—ranging from your driving smoothness via connected vehicle sensors to real-time traffic congestion patterns—to generate hyper-personalized premiums instantly.
For consumers, this evolution represents both a massive opportunity for savings and a hidden trap for penalty pricing. Understanding how AI algorithms evaluate risk is essential for anyone looking to lower their monthly auto insurance premiums.
How AI Comparison Engines Evaluate Your Risk Profile
Behavioral Telematics and Connected Cars
Modern cars stream performance data directly to insurance aggregators. Generative AI models analyze braking sharpness, acceleration curves, cornering G-forces, and phone distraction metrics. Drivers who maintain smooth, defensive habits are rewarded with dynamic rate cuts of up to 40% compared to traditional rating tiers.
Predictive Traffic and Weather Modeling
AI tools now cross-reference your daily commute route with predictive weather and accident probability models. If your standard parking location or driving corridor has a statistically higher incidence of uninsured motorist claims, your quotes will reflect that hyper-local risk assessment.
| Comparison Factor | Traditional Rating Model | 2026 Generative AI Model | Impact on Premium |
| Mileage & Usage | Annual estimated odometer reading | GPS tracking & live trip duration | High (up to 35% savings) |
| Driving Behavior | MVR driving record & accidents | Real-time braking, speed, & G-force | Critical (determines tier) |
| Vehicle Tech | Make, model, and safety rating | ADAS calibration & repair cost data | Moderate |
Strategies to Lower Your AI-Driven Insurance Quote
To outsmart the algorithm and secure the lowest possible premium in 2026, drivers must proactively manage their digital footprint on insurance platforms.
Opt-In for Telematics Trial Periods: Many insurers offer immediate 15% discounts just for installing their driving app; let it track safe habits for 30 days to lock in permanent savings.
Scrub Unverified Public Records: Ensure your motor vehicle report is free of clerical errors that AI risk models misinterpret as reckless behavior.
Compare AI Aggregators: Use platforms that integrate multi-carrier API feeds rather than single-brand comparison sites to find the best risk-adjusted rate.
“Industry Note: AI-driven pricing rewards transparency and precision. Drivers who actively manage their telematics data consistently out-save those relying on legacy quote calculators.”
Embracing AI comparison tools allows savvy policyholders to customize coverage limits precisely to their driving habits, eliminating wasted premium spend while ensuring robust protection.
Discover more from The Economy
Subscribe to get the latest posts sent to your email.

Despite decades of bans and strict handling mandates, asbestos remains a silent killer across legacy manufacturing plants, shipyards, and modern green-energy infrastructure retrofits. In 2026, regulatory changes by the EPA and tightened occupational health standards have triggered a fresh wave of mesothelioma litigation. Manufacturers attempting to fast-track industrial transitions are encountering catastrophic oversight, exposing workers to legacy toxins and opening corporate parent companies to unprecedented liability.
Navigating a mesothelioma claim in 2026 requires understanding how modern industrial supply chains intersect with historical exposure. Trusts established decades ago are being audited under stricter transparency laws, altering payout ratios and accelerating fast-track settlements for terminally ill plaintiffs.
Modern Industrial Exposure Hotspots
Green Retrofitting and Renewable Energy Infrastructure
A primary source of 2026 asbestos exposure occurs during the decommissioning and retrofitting of older industrial facilities for renewable energy production. Workers insulating electrical grids, modernizing HVAC systems, or upgrading manufacturing floors frequently disturb encapsulated asbestos materials that were improperly documented or ignored during facility audits.
Automotive and Aerospace Supply Chains
With advanced manufacturing booming, workers handling specialized friction materials, gaskets, and heat shields face ongoing risks. Supply chain tracing has become more sophisticated, allowing legal teams to pinpoint exact corporate entities responsible for raw material distribution across multinational borders.
| Industry Sector | Primary Exposure Risk | Legal Venue / Trust | Avg. Claim Value Range |
| Green Energy Retrofit | Disturbed insulation, pipe lagging | Federal Tort / Manufacturer Trust | $1.2M – $3.5M |
| Shipbuilding & Marine | Boiler insulation, structural seals | Asbestos Bankruptcy Trusts | $800K – $2.4M |
| Automotive Manufacturing | Brake components, high-heat gaskets | Third-Party Product Liability | $600K – $1.8M |
Securing Maximum Compensation: Steps for Plaintiffs
Time is of the essence in mesothelioma cases. Plaintiffs and their families must act decisively to secure financial recovery before statutes of limitations expire.
Retain Specialized Counsel: Work exclusively with national mesothelioma law firms possessing deep historical databases of asbestos-containing products.
Audit Employment History: Document every job site, supervisor name, and equipment brand encountered throughout your career.
Expedite Medical Filings: Secure a formal pathological diagnosis quickly to qualify for expedited trust fund distribution and priority trial settings.
“Expert Insight: Modern asbestos litigation is no longer just about historical tracking; it is about holding modern corporations accountable for failing to conduct rigorous environmental safety audits before initiating industrial retrofits.”
By combining meticulous work history reconstruction with aggressive multi-trust filings, victims can secure substantial financial relief to cover specialized immunotherapy and family support.
Discover more from The Economy
Subscribe to get the latest posts sent to your email.

Balance of Payments (BOP)

The Falkland Islands Dispute: Sovereign Wealth, Offshore Drilling, and Market Impacts

Gross Domestic Product (GDP): Nominal vs. Real

What is Inflation and the Consumer Price Index (CPI)?

US-China Trade Competition 2026: Supply Chain Relocation Guide

Oil Prices Break $100 in 2026: Middle East Conflict & Energy Markets

South-South Trade Expansion: Digital Integration and Emerging Market Growth

$166B Tariff Refund Tapering Fast: Is Your Business Missing Out?

Stock Market Today: Dow Climbs 500 Points as Markets Shake Off Inflation Jitters

14th WTO Conference 2026: Tariffs & Global Supply Chain Impact

Swish Secures $24M Funding to Disrupt India’s $100B Food Market

Physical AI and Driverless Tech: The Next Trillion-Dollar Industrial Revolution

Enterprise AI Platforms Disrupting B2B SaaS in 2026: Full Analysis

Crypto vs. Safe Haven Assets 2026: Where Institutions Are Hedging

State Farm’s $5B Dividend 2026: Who Qualifies & Payout Dates

US-China Relations in Q3 2026: Trade Tariffs and Supply Chain Risks

Gold’s Wild 2026: From a Record $5,600 Peak to a 24% Crash and Back Toward $4,500

Oil Surges as Strait of Hormuz Traffic Collapses Again

The Rocket That Won’t Quit: Inside SpaceX’s Falcon 9 Launch Machine

Bank of England Set to Hold Rates Through Year-End, Reuters Poll Shows

SpaceX Starship Flight 14: First Orbital Attempt & Starlink V3 Launch Explained

The 2026 Crypto Regulatory Shift: What It Means for Institutional Investors

AI Chip Stocks 2026: The Best Semiconductor Investments Beyond Marvell

Retail Earnings Week: What Home Depot, Target & Walmart Reveal

AI-Powered Training: The Next Multi-Billion Dollar Ecosystem in Fitness

Russia’s Black Sea Oil Exports Fall for a Fifth Straight Week

Top 30 Stocks for Investment in PSX for Massive ROI in 2026

Tween Back-to-School Trends 2026: What’s Driving the $85B Season
-

 Markets & Finance8 months ago
Top 15 Stocks for Investment in 2026 in PSX: Your Complete Guide to Pakistan’s Best Investment Opportunities
-

 Analysis7 months ago
Johor’s Investment Boom: The Hidden Costs Behind Malaysia’s Most Ambitious Economic Surge
-

 Analysis7 months ago
Top 10 Stocks for Investment in PSX for Quick Returns in 2026
-

 Analysis7 months ago
Brazil’s Rare Earth Race: US, EU, and China Compete for Critical Minerals as Tensions Rise
-

 Banks8 months ago
Best Investments in Pakistan 2026: Top 10 Low-Price Shares and Long-Term Picks for the PSX
-

 Investment8 months ago
Top 10 Mutual Fund Managers in Pakistan for Investment in 2026: A Comprehensive Guide for Optimal Returns
-

 Global Economy9 months ago
15 Most Lucrative Sectors for Investment in Pakistan: A 2025 Data-Driven Analysis
-

 Global Economy9 months ago
Pakistan’s Export Goldmine: 10 Game-Changing Markets Where Pakistani Businesses Are Winning Big in 2025