
Policy
Warsh’s Fed Kills the Rate-Cut Trade:Inflation, and Your Money

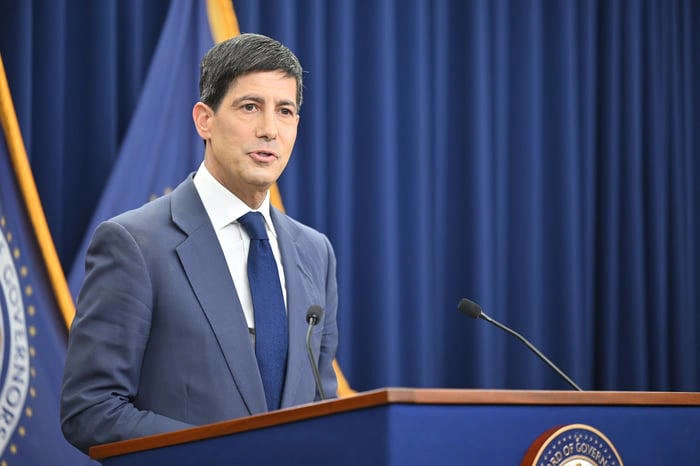
New Fed Chairman Kevin Warsh’s first FOMC meeting has flipped the dot plot from projected cuts to projected hikes, eliminated forward guidance, and sent markets reeling. Here is the complete breakdown of what happened and what comes next.
The Rate-Cut Trade Is Dead
On June 17, 2026, Kevin Warsh chaired his first Federal Open Market Committee meeting as the new Chairman of the Federal Reserve. What followed was one of the most consequential shifts in US monetary policy communication in years.
The rate hold was widely anticipated. What was not anticipated was the magnitude of the hawkish signal embedded in the updated economic projections — and the fundamental change in how the Fed communicates with markets.
The Dot Plot Stunner: From Cuts to Hikes in One Quarter
The Fed’s “dot plot” — a chart showing where each FOMC member expects interest rates to be in coming years — delivered a stunning reversal. Nine of the 18 voting members now project an interest rate hike before end of 2026, with six projecting two 25-basis-point hikes. The dot plot median jumped from a projected year-end rate of 3.4% to 3.8% in a single quarter.
To appreciate the full significance of this shift, consider where markets were at the start of 2026: pricing in three rate cuts by December. That expectation has now been completely reversed. CME FedWatch data now shows virtually no probability of rate cuts in 2026, with a 60%+ chance of at least one hike by October.
Warsh’s Communication Revolution: Killing Forward Guidance
Perhaps more significant than the dot plot shift was Warsh’s deliberate dismantling of the Fed’s forward guidance regime — the practice of pre-signaling future rate moves that Jerome Powell had used throughout his tenure.
Warsh’s rationale was explicit: “I think financial markets perform best when they react to incoming data.” That is a structural change with profound implications. Markets that have spent 15 years pricing assets based on Fed forward guidance now face a fundamentally different environment — one where every data release carries maximum uncertainty.
The immediate market reaction was sharp. The S&P 500 dropped, the Nasdaq fell, the Dow lost over 500 points in afternoon trading. The 2-year Treasury yield surged 16 basis points to 4.21%.
Why Warsh Did Not Submit His Own Dot
One of the most unusual and closely watched aspects of the June meeting was Warsh’s decision to withhold his own rate projection from the dot plot — an unprecedented step for a sitting Fed Chairman.
The dot plot confirmed that even one rate cut in 2026 is not the base case. Warsh announced five task forces to review the Fed’s monetary policy operations, communications, data sources, productivity and the labor market. The task force review suggests Warsh may also be questioning the dot plot tool itself — potentially with plans to restructure or eliminate it as part of a broader overhaul of Fed communications.
His silence spoke loudest of all. Markets interpreted the missing dot as Warsh reserving maximum flexibility — unwilling to commit to a path before his task forces have completed their assessment.
What This Means for Investors and Borrowers
The hawkish pivot reshapes the financial landscape across multiple dimensions:
Equities: Elevated rates for longer compress valuations on growth stocks. Technology and AI companies — which have led the market higher on expectations of rate cuts — face increased pressure as the discount rate for future earnings rises.
Fixed Income: Treasury yields rising means existing bond holders face mark-to-market losses. However, new buyers lock in attractive yields. The 2-year Treasury note is now offering yields not seen since early 2025.
Mortgages and Housing: Higher-for-longer rates keep mortgage rates elevated, suppressing housing affordability and transaction volumes — a continued drag on construction and related industries.
The Dollar: A more hawkish Fed relative to other central banks (the Bank of England held at 3.75%, the Swiss National Bank at 0%) supports dollar strength — which in turn creates headwinds for emerging market economies with dollar-denominated debts.
FAQs
Q: Who is Kevin Warsh? Kevin Warsh is a former Federal Reserve Governor (2006–2011) and private sector financier who was nominated by President Trump and confirmed by the Senate as Fed Chair on May 13, 2026. He succeeded Jerome Powell, who remains a voting member of the FOMC.
Q: Will the Fed actually raise rates in 2026? As of June 2026, nine of 18 FOMC members project at least one hike before year-end, and CME FedWatch shows greater than 60% probability of a hike by October. Whether this materializes depends heavily on incoming inflation data, particularly whether oil price declines translate into lower core PCE readings.
Q: What is the dot plot? The “dot plot” is a chart released quarterly by the Fed showing each FOMC member’s projection for where the federal funds rate will be at the end of each year and in the longer run. It is used by markets to gauge the central bank’s collective rate outlook.
Q: Why did Warsh eliminate forward guidance? Warsh believes that pre-committing to rate paths can distort market pricing and reduce the Fed’s flexibility to respond to incoming data. By removing forward guidance, he is returning to a more traditional model of responding to economic conditions rather than managing expectations about future policy.
Discover more from The Economy
Subscribe to get the latest posts sent to your email.


Global Economy
Battle for the Farm Belt: How Tariff Pressures and Fuel Costs Are Reshaping Iowa’s 2026 Midterms
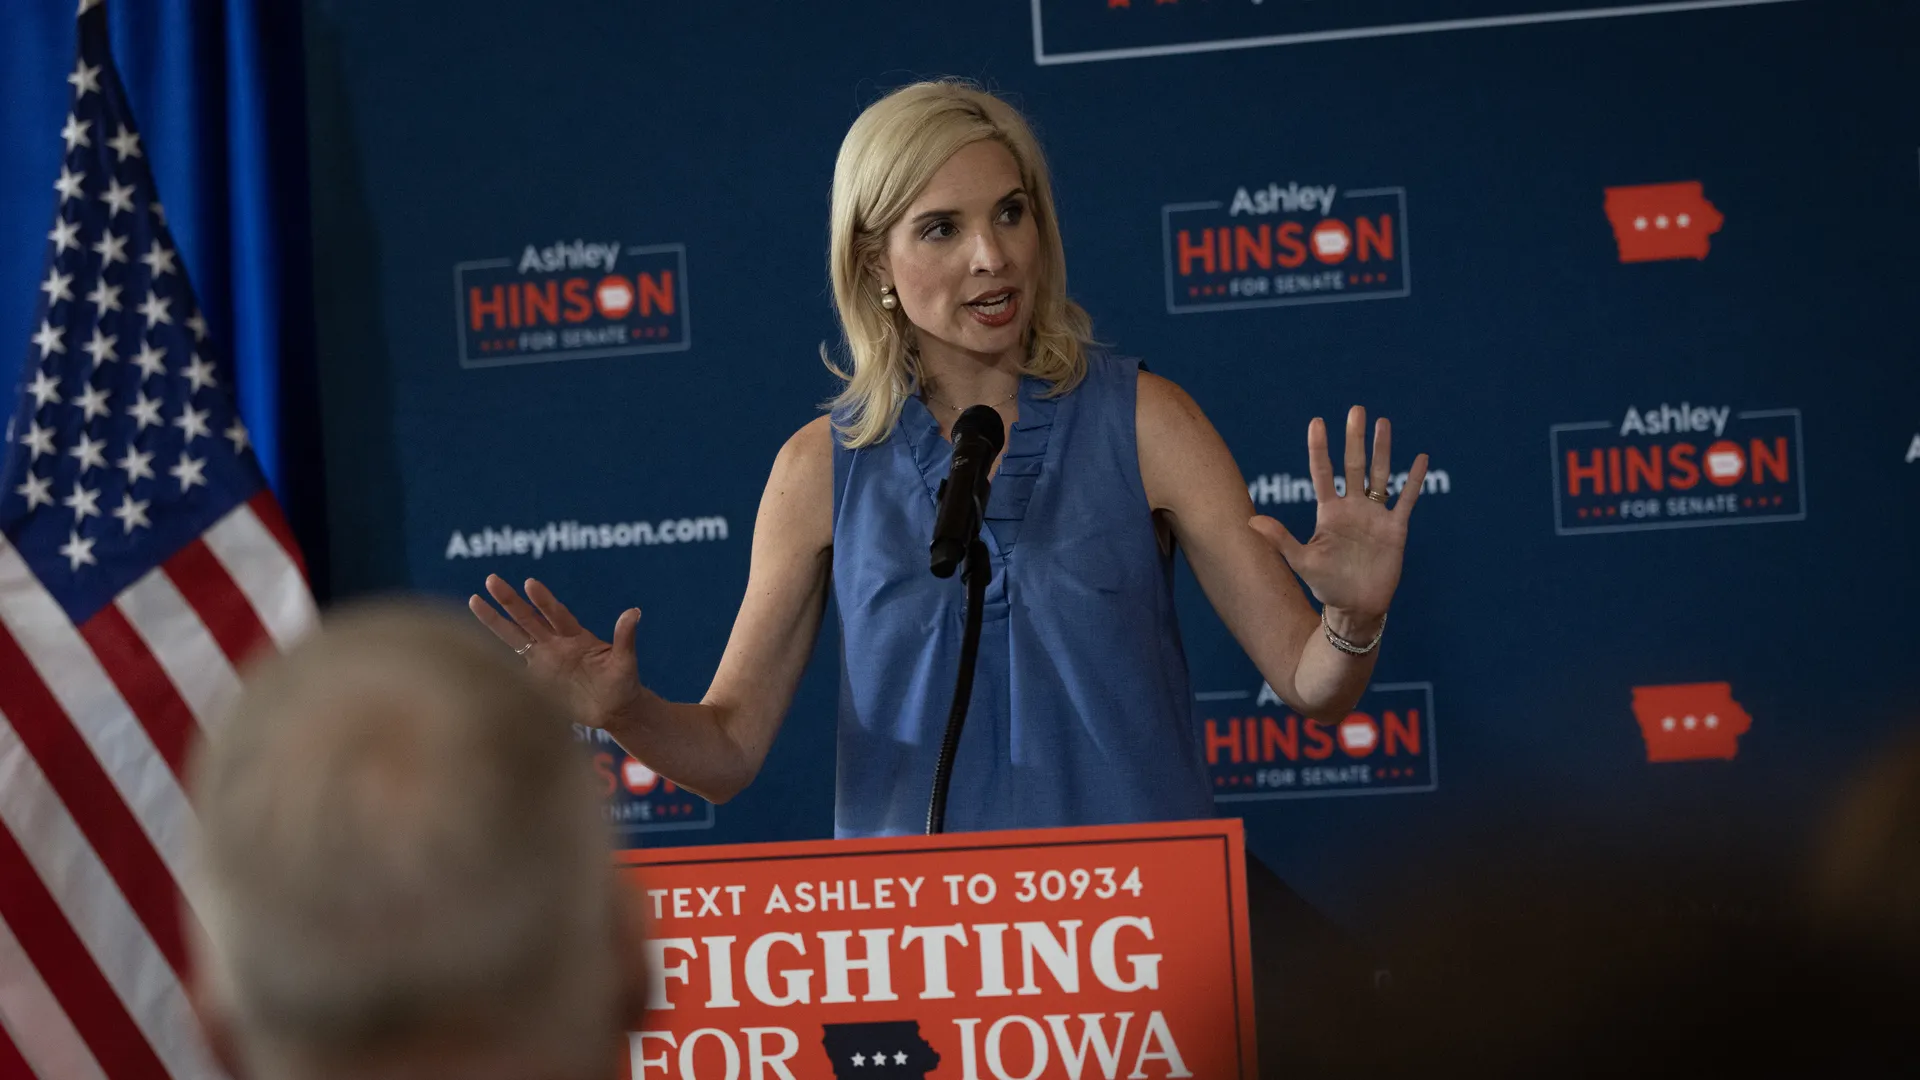
DES MOINES, Iowa — In America’s agricultural heartland, the political landscape heading into the 2026 midterm elections is undergoing its most significant realignment in a decade. Surging fuel overhead, escalating global trade frictions, and rising input costs are convergence points putting traditional Republican strongholds in Iowa under intense electoral pressure.
1. The Economic Squeeze in Rural Iowa
At the center of Iowa’s political shift is a dual economic pressure hitting family farms and agricultural enterprises:
- Energy and Transportation Overhead: Following energy market disruptions, diesel prices across the Midwest surged past $6.50 per gallon, representing a nearly 76% increase year-over-year. For producers managing heavy machinery, grain haulage, and supply chain logistics, fuel overhead has eroded operational margins.
- Trade and Commodity Price Suppression: Retaliatory tariffs on major American exports—specifically soybeans and corn—have created volatility in key foreign markets. Soybean prices have faced downward pressure, directly reducing farm incomes across 95% of Iowa’s primary crop-producing counties.
- Compound Input Inflation: Higher costs for nitrogen-based fertilizers, commercial seeds, and equipment financing have compounded household financial strain.
According to financial impact studies published in the Associated Press Midterm Report, agricultural producers across the Midwest are facing a sharp pinch between fixed operational costs and suppressed market yields, turning economic survival into a core campaign issue.
2. Polling Breakdown: Marist Survey Highlights Key Shifts
Political dynamics in Iowa—long viewed as a stable red baseline—have tightened dramatically across statewide contests.
Data compiled in the Marist Poll September 2026 Survey highlights significant headwinds for incumbent political alignments:
| Electoral Measure | Current Polling Metric | Key Demographic / Breakdown |
| U.S. Senate Race | Josh Turek (D): 50% Ashley Hinson (R): 42% | Independent voters favoring Turek; cost-of-living cited as primary issue. |
| Gubernatorial Race | Rob Sand (D): 54% Zach Lahn (R): 42% | Sand holding a 57%–33% advantage among independent statewide voters. |
| Generic Congressional Ballot | Democrat: 50% Republican: 45% | Shift in suburban and mixed rural-suburban congressional districts. |
| Presidential Job Approval | Disapprove: 58% Approve: 41% | Plurality of voters (43%) report their ballot is a vote against current federal policies. |
| Household Financial Sentiment | Worse Off: 46% Unchanged: 39% / Better: 15% | High fuel prices and grocery inflation drive negative financial sentiment. |
3. The Re-Alignment of the Rural Swing Vote
In previous election cycles, agricultural state voters historically prioritized regulatory relief and federal tax incentives. However, the 2026 midterm cycle demonstrates that affordability and cost containment have superseded traditional party loyalties.
Analysis from the Brookings Institution Midterm Governance Report indicates that when Presidential approval ratings dip among agricultural constituents, down-ballot candidates face immediate fallout:
- The Independent Pivot: Independent voters in Iowa, who previously split evenly or favored conservative candidates, are breaking toward candidates offering specific cost-relief and trade stabilization policies.
- The Tariff Dilemma: While agricultural subsidies offer temporary liquidity, farm leaders increasingly advocate for open export markets over government bailouts, citing long-term market access as vital for generational farms.
- Turnout Dynamics: High-dollar national ad spending from both political parties is pouring into Iowa’s media markets, reflecting the strategic importance of the state in deciding national control of the U.S. Senate.
What to Watch Next
- Farm Bill & Subsidy Appropriations: How federal agricultural relief programs are structured prior to November will directly influence late-deciding agricultural voters.
- Energy Overhead & Diesel Spot Prices: Any stabilization or further spike in harvest-season fuel costs will serve as an economic bellwether for rural voter sentiment.
- Turnout in All 99 Counties: Ground mobilization efforts across Iowa’s rural townships will determine whether the polling shift translates into turnout at the ballot box.
Discover more from The Economy
Subscribe to get the latest posts sent to your email.
Mortgage
How the Trump-Xi White House Summit Is Reshaping Mortgage Rates Today for Real Estate Investors
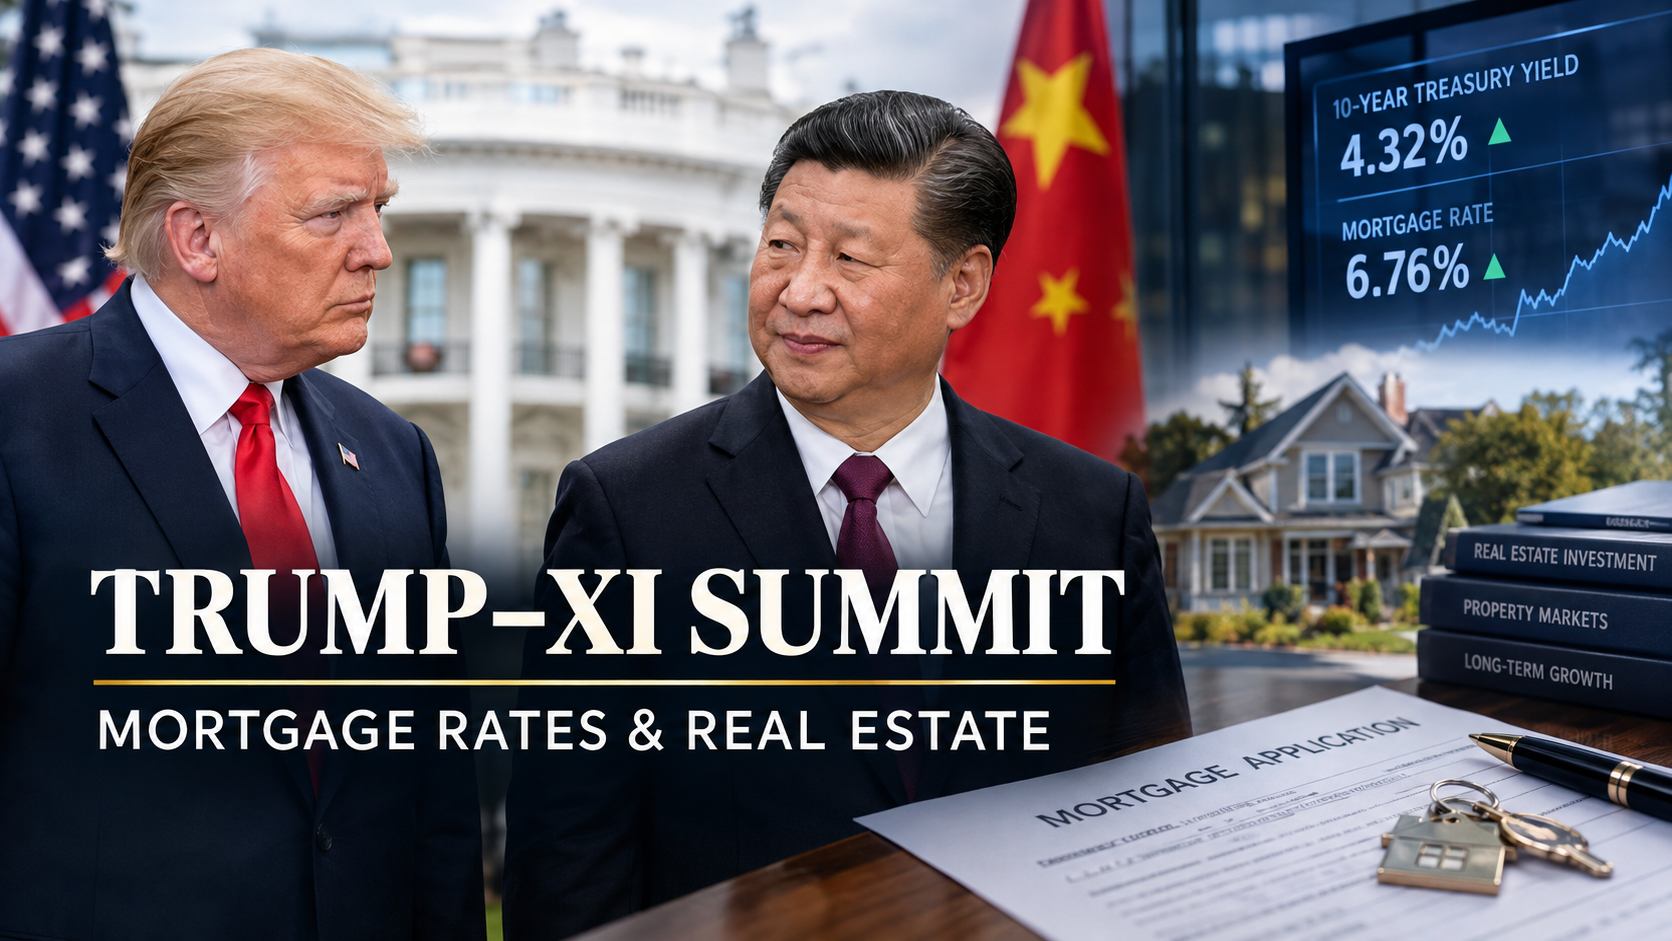
The September 24 Trump-Xi summit produced a two-month trade-truce extension rather than a durable deal — and that ambiguity, not a headline breakthrough, is what’s now keeping the 10-year Treasury yield elevated and mortgage rates parked near 7% heading into the fourth quarter.
Mortgage Rates Today: The Q4 2026 Baseline
Freddie Mac’s benchmark survey put the 30-year fixed-rate mortgage at 6.95% for the week of September 17, 2026 — the fourth consecutive weekly increase and the highest reading since January 2025. The 15-year fixed climbed in tandem to 6.26%. A year earlier, the 30-year average sat more than half a point lower, near 6.26%.
| Loan Type | Rate (week of Sept. 17, 2026) | Rate (1 year prior) |
|---|---|---|
| 30-year fixed | 6.95% | 6.26% |
| 15-year fixed | 6.26% | 5.41% |
| 5/1 ARM | ~6.8%–7.0% | — |
| 30-year VA | ~6.2%–6.3% | — |
Source: Freddie Mac Primary Mortgage Market Survey; Zillow daily rate tracker.
The proximate driver is the bond market, not the housing market. Mortgage pricing tracks the 10-year Treasury yield, and that yield has been climbing toward the high-4% range through September on a combination of heavy government issuance and a Federal Reserve that has signaled it is in no hurry to cut. Layer geopolitical risk on top — oil above $90 a barrel amid Middle East disruption, plus unresolved US-China friction — and lenders are pricing in a wider risk premium.
Why the Summit Matters to Your Rate Lock
Real estate investors tend to treat foreign policy as background noise. That’s a mistake in Q4 2026. The Trump-Xi relationship is now the single largest swing factor in how bond markets price forward risk, because it touches three things that feed directly into Treasury yields: tariff policy, rare-earth and technology export controls, and the credibility of the disinflation narrative the Fed needs to justify future rate cuts.
What Actually Happened at the September 24 Summit
Xi Jinping’s September 24 visit to the White House was the second Trump-Xi meeting of 2026, following a May 14–15 state visit to Beijing where the two sides agreed to pursue what they termed a “constructive, strategically stable relationship.” The Washington leg was shorter on ceremony and shorter on breakthroughs. According to Reuters’ pool reporting, Treasury Secretary Scott Bessent confirmed the two sides extended their trade truce — originally due to lapse in November — by roughly two months, buying time rather than locking in a structural agreement.
That is the detail markets are trading on. An extension without resolution leaves tariff rates, Chinese purchasing commitments, rare-earth export licenses, and technology restrictions all still in play heading into the new year. For bond investors, unresolved trade risk is inflationary risk: tariffs raise input costs, and rare-earth bottlenecks squeeze manufacturers that feed into consumer prices. Both push against the case for near-term Fed easing, and Fed policy is the single biggest lever on where mortgage rates land.
Three Summit Threads With Direct Rate Impact
- The 60-day trade truce clock. With the new deadline now sometime in early 2026’s first quarter, expect renewed rate volatility as that date approaches — mortgage desks should treat any lock decision inside that window as elevated-risk.
- AI and export-control friction. Both sides used the September summit to air disagreements over AI development and chip/technology export controls, an area CSIS analysts have flagged as the least-resolved dimension of the relationship. Unresolved tech friction keeps a geopolitical risk premium baked into yields.
- No durable tariff resolution. Core tariff and purchasing questions were pushed into the next round of talks, meaning the inflation uncertainty that has kept the Fed cautious remains unresolved.
Featured Snippet: What Is the Average Mortgage Rate Today?
As of mid-to-late September 2026, the average 30-year fixed mortgage rate in the US is running just under 7%, per Freddie Mac’s weekly survey — the highest level since January 2025, driven by rising Treasury yields tied to heavy government borrowing and unresolved US-China trade risk following the September 24 Trump-Xi summit.
Asian Growth and the Global Rate Picture
The mortgage story doesn’t stop at the US border. The Asian Development Bank’s September 2026 outlook nudged developing Asia’s 2026 growth forecast up slightly to 5.0%, even as regional inflation stays elevated near 4.2%. Stronger Asian growth alongside sticky inflation is broadly consistent with the “higher for longer” global rate environment that’s keeping US mortgage rates elevated — it’s not just a domestic story.
Q4 2026 Predictive Outlook
- Base case: 30-year fixed rates hold in the 6.7%–7.1% band through year-end, with volatility clustering around the new US-China truce deadline and the next two Fed meetings.
- Upside risk (higher rates): A breakdown in the truce, renewed tariff escalation, or a hawkish surprise from the Fed pushes the 30-year toward 7.25%–7.5%.
- Downside risk (lower rates): A durable trade framework or a faster-than-expected inflation cooldown could pull rates back toward the low 6% range, though nothing in current Fed communication points to that in Q4.
FAQ
Will mortgage rates go down before the end of 2026?
Most forecasters, including those tracked by Freddie Mac and major bank research desks, see rates holding near current levels through Q4 2026 absent a clear resolution to US-China trade tensions or a faster Fed pivot.
How does the Xi-Trump summit affect US mortgage rates?
It affects rates indirectly, through Treasury yields. Unresolved trade and tech-export issues keep an inflation and geopolitical-risk premium in bond markets, which raises the yields that mortgage-backed securities are priced against.
What is a good mortgage rate right now?
Relative to the current national average near 6.9%–7.0%, well-qualified borrowers securing rates half a point or more below the weekly Freddie Mac average are getting a comparatively strong deal in today’s market.
Discover more from The Economy
Subscribe to get the latest posts sent to your email.
Executive Summary
- Trade Truce Extension: Washington and Beijing extended the Busan economic truce by two months to January 10, 2027, establishing a bilateral Board of Trade mechanism with a $30 billion cap on tariff reductions for non-sensitive goods.
- Taiwan Policy Stance: President Xi Jinping pressed the U.S. administration to shift from “not supporting” to explicitly “opposing” Taiwan independence, while a U.S. $14 billion arms package to Taipei remains on hold.
- AI & Governance Divergence: Trump advocated for minimal federal AI regulation relying on existing legal channels, whereas Xi emphasized international norm-setting and human-controlled AI governance.
- Conflict Prevention: Both leaders highlighted shared WWII historical ties, but underlying systemic friction over technology controls and critical supply chains remains unhedged.
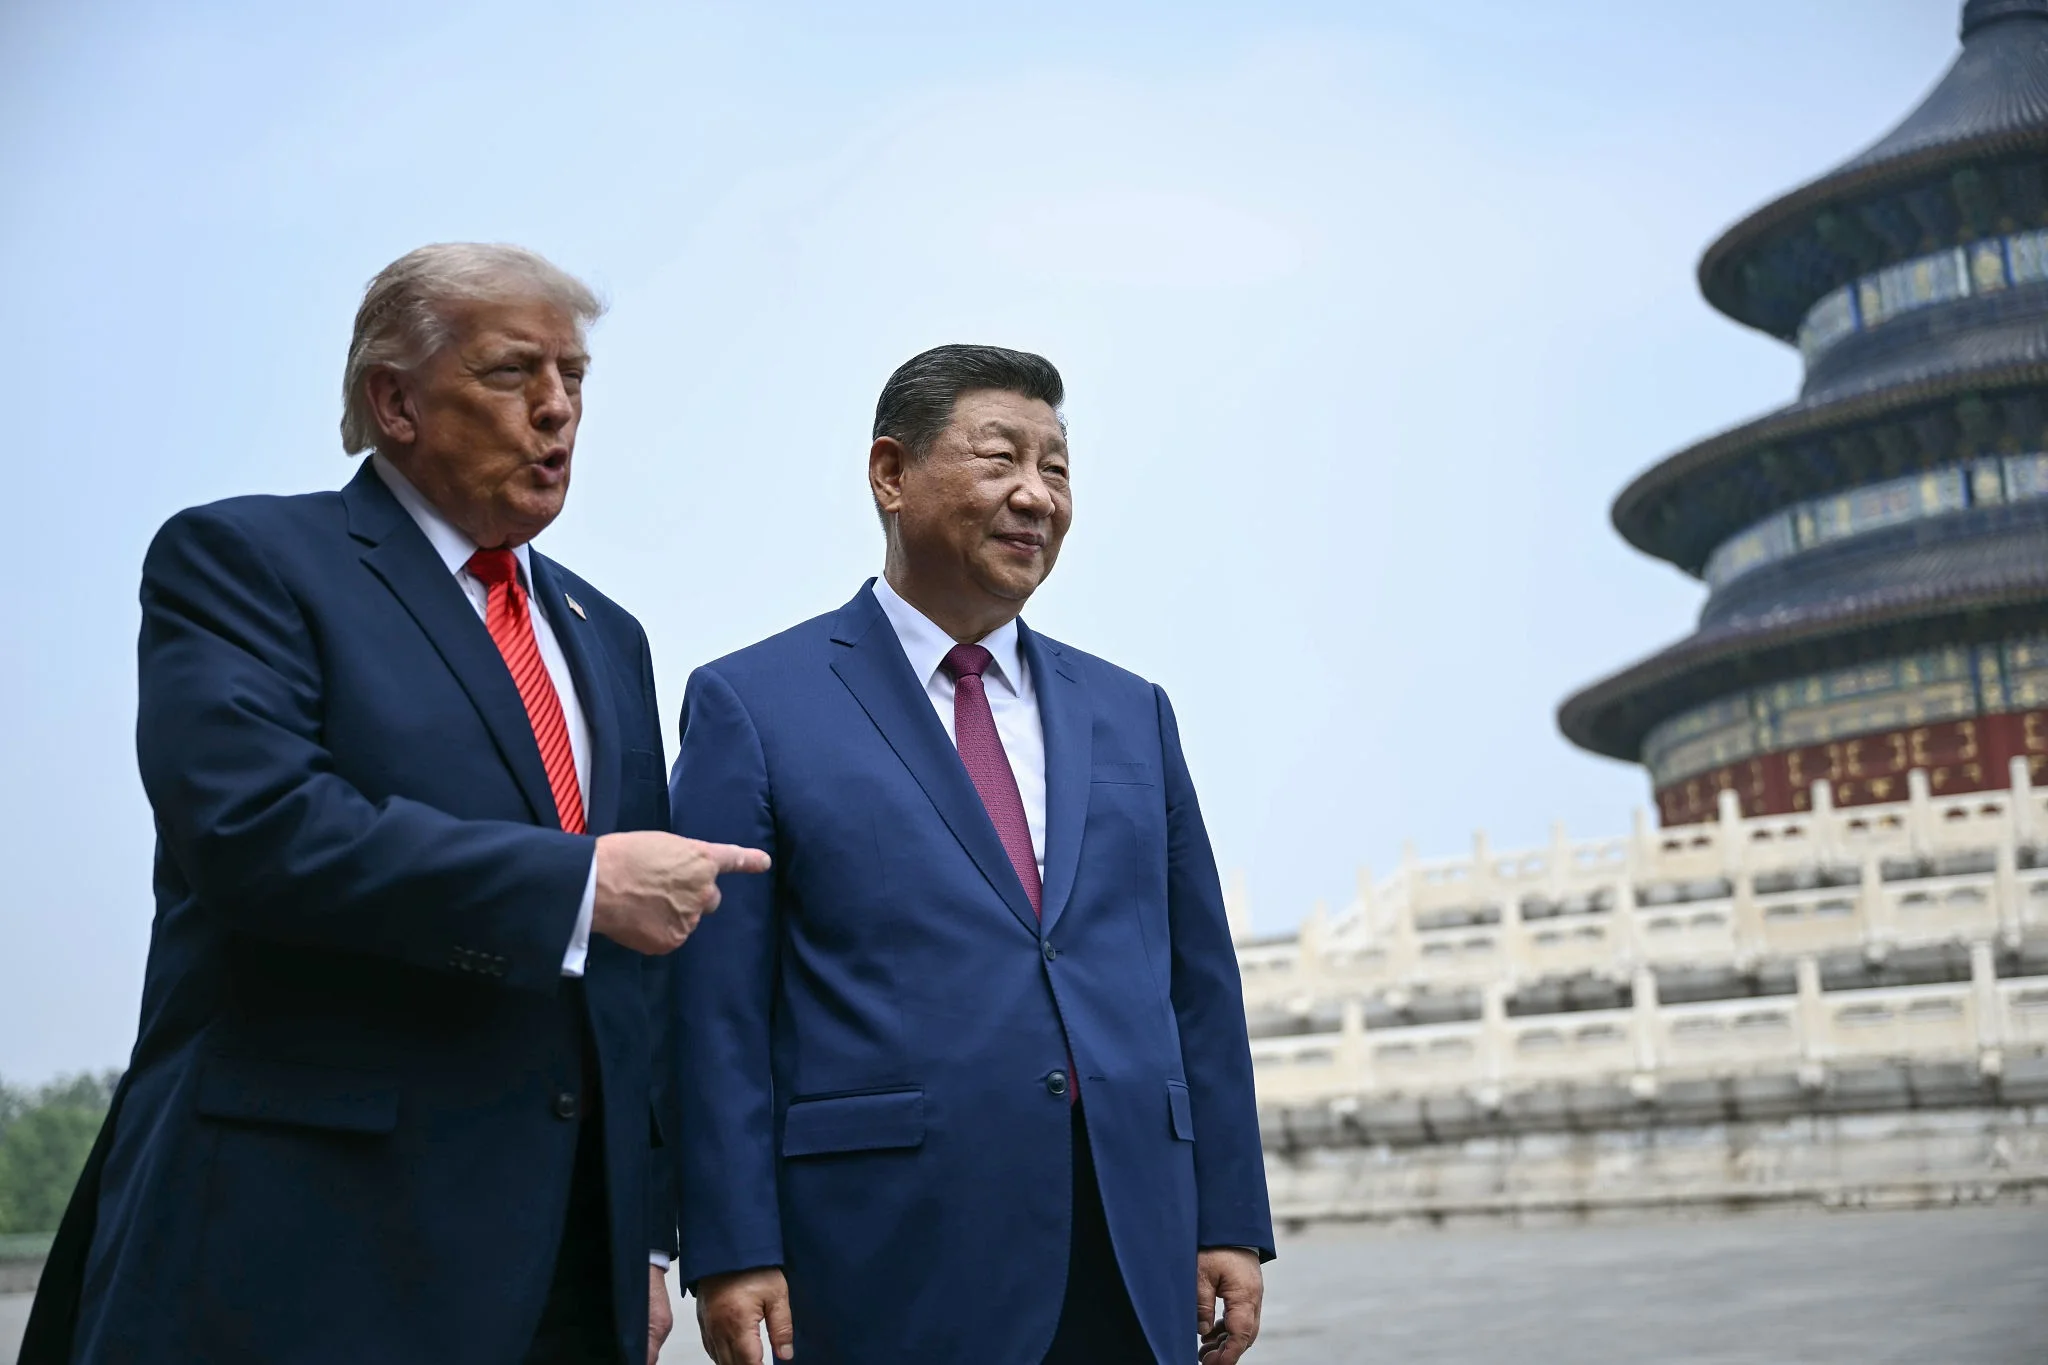
Presidents Xi Jinping and Donald Trump met in Washington, D.C., marking President Xi’s first official state visit to the United States in over a decade. The 43-hour diplomatic engagement combined high-profile ceremonial gestures with intense negotiations over economic policy, regional security, and emerging technologies.
1. Trade Deliverables & Managed Economic Detente
The core economic outcome of the summit was a mutual decision to extend the trade truce originating from the Busan agreements by an additional two months, pushing the negotiation window to January 10, 2027. According to analysis published by The Business Times, this temporal buffer buys critical space for both economies to formalize structured frameworks before political shifts take hold following the U.S. midterm elections.
Key Economic Components:
- Board of Trade Framework: Establishing a structured mechanism to oversee managed bilateral commerce.
- Tariff Cap Reductions: A planned mutual tariff reduction capped at US$30 billion per side, targeting non-sensitive consumer and industrial goods.
- Agricultural Commitments: China continues to meet its baseline commitments for purchasing 25 million metric tons of U.S. soybeans.
However, friction points persist below the surface. U.S. trade officials noted that Beijing remains behind on its broader pledge to purchase $17 billion in other U.S. agricultural exports. Furthermore, delivery quotas for critical rare-earth elements—essential for high-tech manufacturing—have fallen short of target allocations. As detailed by the Chicago Council on Global Affairs, reliance on personalistic leader-to-leader negotiations creates short-term pauses but leaves structural trade imbalances and supply chain dependencies unaddressed.
2. The Taiwan Question & Strategic Security
Diplomatic maneuvering over Taiwan represented the most sensitive geopolitical dynamic of the summit. President Xi reiterated Beijing’s core stance, urging Washington to handle the Taiwan issue with “extreme prudence” and asking the U.S. to actively oppose Taiwan independence rather than maintaining its traditional diplomatic posture of simply “not supporting” it.
Strategic assessments from the Institute for the Study of War indicate that Beijing views the current economic detente as a key window to influence U.S. security commitments in the Indo-Pacific. A planned U.S. $14 billion arms transfer package to Taiwan remains paused, delivering a tactical diplomatic win for Beijing ahead of upcoming multilateral regional gatherings.
3. Divergent Visions on AI Governance & High-Tech Competition
The summit exposed contrasting philosophies regarding the regulation of Artificial Intelligence and advanced computing capabilities. While both leaders acknowledged AI’s transformative influence on global power balances, their proposed paths forward reflect fundamental governance differences.
| Dimension | United States Stance | China Stance |
| Regulatory Model | Market-driven with minimal federal intervention; oversight through existing DOJ frameworks. | State-directed guardrails emphasizing central oversight and alignment with national strategy. |
| Global Governance | Defense of competitive edge and strict export controls on advanced hardware. | Multilateral norm-setting under international organizations (“AI for Good”). |
| Core Objective | Commercial freedom, innovation velocity, and technological superiority. | Human control, risk mitigation, and preventing technological decoupling. |
Reporting from The Federal highlighted that while Xi urged joint international responsibility to ensure AI remains under human control, the U.S. side favored preserving flexibility for domestic technological developers without introducing international regulatory mechanisms.
4. “Thucydides Trap” Avoidance & Strategic Guardrails
Throughout the summit, President Xi repeatedly warned against falling into the “Thucydides Trap”—the historical tendency toward conflict when a rising power challenges an established power. Calling for “constructive strategic stability,” Xi emphasized that global competition should resemble a “race of catching up with one another, not a wrestle in which one wins and the other loses.”
Institutional Takeaways:
- Regular Military Communications: Reaffirming bilateral crisis-prevention channels to prevent miscalculations in air and maritime corridors.
- Historical Commemoration: Leveraging shared World War II history during visits to national monuments to emphasize foundational ties.
- Corporate Engagement: Hosting state dinners with executive leadership to reinforce commercial interdependencies as a stabilizing buffer.
Strategic Outlook
While the 43-hour Washington summit succeeded in projecting stability and securing short-term economic extensions, fundamental strategic competition remains unresolved. The coming months will test whether temporary trade truces and managed tariff caps can withstand broader geopolitical rivalries in technology supply chains, semiconductor export policies, and Pacific security dynamics.
Discover more from The Economy
Subscribe to get the latest posts sent to your email.

US 10-Year Yield Hits 5.24%: What the Historic Bond Market Sell off Means for Mortgages and Investors

Battle for the Farm Belt: How Tariff Pressures and Fuel Costs Are Reshaping Iowa’s 2026 Midterms

Southeast Asia’s Critical Minerals Power Play: Can ASEAN Avoid Choosing Between China and the US?

MAS Allocates S$1.45 Billion to Five Asset Managers in Third EQDP Batch: Total Deployment Reaches S$5.4 Billion

Beyond Singapore’s Borders: How Squeezed SMEs Can Unlock High-Yield Growth Across ASEAN

Bank Jago’s Wealth Management Push:Indonesia’s 31.1 Million Investors boom

Beyond the Four-Year Degree: The $100K+ Trade Careers Young Americans Are Overlooking

SpaceX Starship Achieves First Full Orbit on Historic 10-Hour Test Flight 14

Google’s $15B Finland AI Investment: Data Centers, Nuclear Power & Jobs

Fast Invoice Factoring: Rates, APR Math & Contract Traps

SOC 2 Type II Guide: Cost, Timeline & Compliance Companies

Hong Kong Wages Surge 3.4% in June: Sector Data & Analysis

Silver Price Today: Why the Xi-Trump AI Standoff Is Fueling a Safe-Haven Rally

Citibank & Dólar Estadounidense: Forex Playbook After the Xi-Trump Truce

Top 30 Stocks for Investment in PSX for Massive ROI in 2026

Oil Prices Break $100 in 2026: Middle East Conflict & Energy Markets

BRICS+ Cross-Border Payments 2026: Interoperability Explained

Fidelity Investments Review 2026: SPAXX Yields & Zero-Fee Funds

10-Year Treasury Yield Hits 4.80%: What It Means for Rates & Portfolios

Shein Clothes Quality & Safety in 2026: What Lab Tests Show

IMF & World Bank 2026 Global Economic Outlook: Growth, Inflation, Debt

China’s US$10.8 Billion Trade Shortcut: Why the Pinglu Canal Matters

High-CPM Finance Niches 2026: Publisher Monetization Blueprint

Middle East War Economics 2026: Oil Prices & Energy Markets

China Stocks Today: Are Big Economies in Asia Nearing a Market Bottom?

Social Security Trust Fund 2032: OASI Depletion Timeline Explained

Global Pension Systems Ranked: The World’s Best and Worst Retirement Frameworks

Gavin Baker AI Outlook: Why the Compute Shortage Persists Through 2028
-

 Markets & Finance9 months ago
Top 15 Stocks for Investment in 2026 in PSX: Your Complete Guide to Pakistan’s Best Investment Opportunities
-

 Analysis7 months ago
Johor’s Investment Boom: The Hidden Costs Behind Malaysia’s Most Ambitious Economic Surge
-

 Analysis7 months ago
Top 10 Stocks for Investment in PSX for Quick Returns in 2026
-

 Banks8 months ago
Best Investments in Pakistan 2026: Top 10 Low-Price Shares and Long-Term Picks for the PSX
-

 Analysis8 months ago
Brazil’s Rare Earth Race: US, EU, and China Compete for Critical Minerals as Tensions Rise
-

 Investment9 months ago
Top 10 Mutual Fund Managers in Pakistan for Investment in 2026: A Comprehensive Guide for Optimal Returns
-

 Global Economy9 months ago
15 Most Lucrative Sectors for Investment in Pakistan: A 2025 Data-Driven Analysis
-

 Global Economy9 months ago
Pakistan’s Export Goldmine: 10 Game-Changing Markets Where Pakistani Businesses Are Winning Big in 2025