
Labour
US Forced-Labour Tariffs on 60 Countries: The Hidden Trade Shock of 2026


The US is imposing 10–12.5% tariffs on 60 countries over forced-labour enforcement gaps. Here’s what it means for Canada, Pakistan, and global sourcing.
Most tariff coverage in 2026 has focused on headline-grabbing bilateral fights — Section 232 metals duties, the US-Canada CUSMA review, reciprocal tariff threats. But a quieter measure moving through the USTR process may end up touching more of global trade than any single country-specific tariff: a forced-labour enforcement tariff applied not to a handful of adversaries, but to 60 economies accounting for 99% of US imports.
In mid-2026, the US Trade Representative proposed tariffs of 10% to 12.5% on imports from 60 economies — covering roughly 99% of US imports — after finding these countries had not adequately enforced bans on forced-labour goods. Countries with partial enforcement commitments face the lower 10% rate; the rest face 12.5%, with a special mechanism for apparel and textiles.
What the rule actually does
The USTR’s findings state that these 60 economies have failed to adequately prohibit or enforce bans on goods made with forced labour, which the agency frames as a source of unfair competition against countries that do enforce such bans. The proposed structure is two-tiered: a 10% tariff for countries that already have some form of forced-labour import prohibition or have committed to implementing one, and a 12.5% tariff for the remaining countries. A separate mechanism would allow limited apparel and textile imports at reduced rates, softening the blow for garment-dependent exporters.
Canada is on the list despite being a treaty partner under CUSMA — a reminder that forced-labour enforcement gaps are being treated as a distinct trade-policy lever, separate from tariff and quota negotiations under existing free-trade agreements.
Why this is the underreported story
Coverage so far has treated this as a compliance footnote inside broader tariff news. It deserves more attention for three reasons:
- Scale: unlike sector tariffs on steel or autos, this rule touches nearly the entire US import base at once, which means the aggregate cost pass-through to US consumers could exceed any single sector-specific measure.
- Enforcement burden shifts downstream: exporting countries — including major garment and electronics suppliers in Asia — will need to demonstrate active supply-chain auditing, not just legal prohibitions on paper, to qualify for the lower rate.
- Leverage point beyond trade: it gives Washington a tool to press human-rights and labour-standards issues inside what looks, on the surface, like a routine tariff schedule.
What exporters and sourcing teams should watch
- Whether their country lands in the 10% or 12.5% tier once USTR finalises findings after the July 2026 comment period
- Documentation requirements for the textile/apparel carve-out
- Whether affected governments respond with formal labour-enforcement commitments to shift tiers before the rule takes effect.
Discover more from The Economy
Subscribe to get the latest posts sent to your email.


Human Resourcs
America’s Workers Are Vanishing From the Labor Force — And It’s Not the Usual Reasons

The US labor force participation rate has fallen to its lowest level in 50 years outside of the Covid-19 pandemic period, a decline that is reshaping how economists read every other US labor market indicator, according to CNBC’s ongoing coverage of the trend.
Why a Falling Unemployment Rate Can Be Misleading
A shrinking labor force participation rate means fewer working-age Americans are actively employed or looking for work — a dynamic that can mechanically push the headline unemployment rate lower even when underlying labor-market health is deteriorating, since people who stop searching for jobs are no longer counted as unemployed. That distinction matters enormously for how policymakers, including the Federal Reserve under new chair Kevin Warsh, interpret incoming jobs data at a moment when the central bank has explicitly moved away from forward guidance and toward a purely data-driven policy stance.
The AI Overlay on an Already Complex Picture
The participation decline is unfolding against the backdrop of intensifying debate over AI’s labor-market impact. A National Bureau of Economic Research study published in February 2026 found that despite widespread adoption, 90% of firms reported no measurable impact of AI on workplace productivity or employment levels, a finding that has been widely cited by critics of the AI investment boom as evidence that current valuations have outrun genuine productivity gains, according to Wikipedia’s tracking of the AI bubble debate. That gap between AI investment intensity and measured labor-market effects complicates the task of isolating how much of the participation decline, if any, is attributable to automation versus other structural and demographic factors.
A Global Pattern of Labor Market Caution
The US is not alone in exhibiting unusual labor-market dynamics. Canada’s labor market has settled into what Indeed Canada economist Brendon Bernard describes as a “low-hire, low-fire” pattern, where weak hiring and weak layoffs combine to keep the unemployment rate stable even as underlying momentum stays soft, according to Yahoo Finance Canada’s economist survey. The UK has shown a similar caution pattern, with businesses reporting weakened operating conditions and falling revenue expectations even as headline employment figures remain comparatively stable, according to CPA’s coverage of the Institute of Directors’ June sentiment survey.
The Grid and Heat Stress Layer
Compounding the labor-market picture, an extreme heat wave is straining power grids across the eastern United States heading into the July 4 holiday travel period, with the largest US power grid operator, PJM, escalating emergency actions to avoid blackouts, according to CNBC’s reporting on the grid strain. The combination of extreme weather events and elevated electricity demand tied partly to AI data-center growth adds a further layer of complexity for businesses managing both workforce planning and operational continuity through the summer months.
What Economists Are Watching Next
With the Federal Reserve no longer providing forward guidance on its policy path, incoming labor-market data — including the closely watched participation rate — will carry outsized weight in shaping market expectations for the remainder of 2026. Economists caution that a genuinely healthy labor market requires participation, hiring, and wage growth to move together; a scenario in which unemployment appears low purely because discouraged workers have exited the labor force altogether would represent a materially weaker underlying picture than the headline rate suggests, with direct implications for consumer spending forecasts across the US retail, housing, and services sectors heading into the back half of 2026.
Discover more from The Economy
Subscribe to get the latest posts sent to your email.
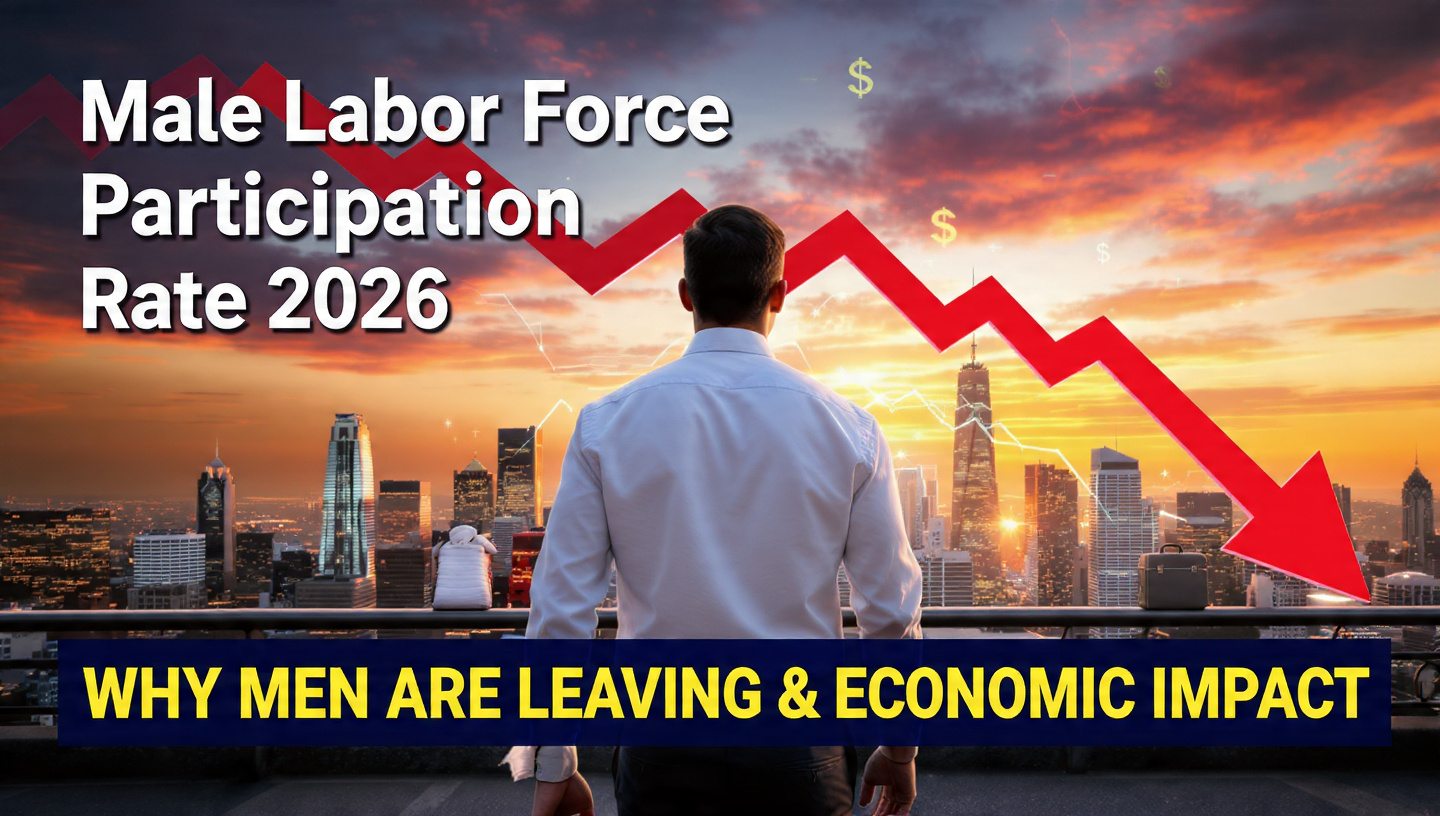
US male labor force participation has fallen to 69.5%—from 86.4% in 1950. New research finds the cause starts in childhood. Here’s what this crisis means for GDP, wages, and US competitiveness.The male labor force participation rate in the United States fell to 69.5% in May 2026—the latest reading in a generational decline that economists have struggled for decades to fully explain and policymakers have largely failed to address.
The number is stark in historical perspective. The male participation rate peaked at 86.4% in 1950. It had already slipped to 76% by May 2006. It now stands nearly seven percentage points lower than it did twenty years ago, and the research suggests the forces driving it are not cyclical but structural—embedded in the childhood experiences of men who grew up watching the labor market fail the males around them.
The New Research: Childhood Shapes Lifetime Expectations
A paper published by University of Connecticut economists Remy Levin and Daniela Vidart in June 2026 advances what may be the most empirically rigorous explanation yet offered for the male participation decline. Their finding: men’s beliefs about the benefits of working are shaped significantly by the labor market conditions they observed during childhood—particularly the wages and employment rates of men in their immediate environment.
When boys grow up surrounded by men who face weak wages and chronic unemployment, they form pessimistic expectations about their own prospects. Those expectations, Levin and Vidart found, become self-fulfilling: men with pessimistic priors are less likely to seek employment, invest in skills, or remain attached to the labor force when discouraged.
“Our findings suggest that experience effects can turn short-run declines in labor demand into long-run declines in labor supply,” they wrote. Their model found that generational childhood exposure to poor male labor market outcomes explained nearly all of the participation dynamics—not macroeconomic conditions in real time, but the lagged echo of conditions that shaped expectations years or decades earlier.
This has a sobering implication: the communities hardest hit by deindustrialization in the 1980s and 1990s are now producing the next generation of non-participants. The experience effect propagates across cohorts. It cannot be solved by a single strong jobs report.

The Theories That Preceded This One
The new research lands in a field dense with competing explanations, each capturing part of the picture. When the housing bubble popped and triggered the Great Recession, the sudden collapse of construction employment—a heavily male sector—pulled hundreds of thousands of men out of the labor force at a moment of acute vulnerability. Many did not return.
The San Francisco Fed identified two channels at work in prior research: men being pulled out of the workforce by caregiving and educational enrollment, and pushed out by disability and skill mismatch. Meredith Whitney, who predicted the Great Financial Crisis, pointed to a “crisis of the American male” rooted in young single men living at home and disengaging from both employment and civic life. The introduction of more sophisticated video games has been cited by economists as a partial substitute for work, particularly among men in their twenties.
Each theory has supporting evidence. None is complete on its own. The University of Connecticut paper’s contribution is to provide a unified mechanism—childhood experience shaping adult expectations—that can account for the persistence and geographic concentration of the decline.
The Economic Cost
The GDP cost of chronically low male participation is difficult to overstate. Labor force participation is one of the two components of labor supply (the other being hours worked). When men leave the workforce permanently, the economy loses not just their current output but the compounding returns on the human capital they would have accumulated over careers.
Researchers estimate the participation gap—the difference between current male participation and what it would be if it had held at 2000 levels—represents millions of missing workers. At an average productivity contribution aligned with current wages, the annual output cost runs into the hundreds of billions of dollars. This is not a cyclical drag that disappears with the next expansion. It is structural loss that compounds each year.
The distribution of that loss is not uniform. States and communities that experienced the heaviest deindustrialization have the lowest male participation rates. Those communities also tend to have lower educational attainment, higher rates of opioid addiction, and weaker social infrastructure. The labor market crisis and the social crisis reinforce each other.
What Follows
If the Levin-Vidart finding is correct, the policy implications are uncomfortable. Short-term demand management—stimulus, job training, even wage subsidies—does not address the expectation formation mechanism that the paper identifies. What changes childhood experience of the labor market is decades of sustained improvement in wages and employment for working-class men, coupled with community-level investment in visible male economic success.
That is a long time horizon for a political system that operates on two- and four-year cycles. The more immediate policy levers—expanding apprenticeship programs, reforming occupational licensing that makes it harder to enter trade careers, addressing the child support enforcement systems that can make formal employment economically punishing for non-custodial fathers—exist but require sustained commitment.
Consumer sentiment at a near-historic low of 48.9% in late June 2026 reflects, in part, the lived experience of the communities where male participation has declined most sharply. An economy where the richest 20% are the primary engines of consumer spending—and where that spending is itself dependent on elevated asset prices that could correct—is structurally fragile in ways that the employment rate headline does not capture.
Discover more from The Economy
Subscribe to get the latest posts sent to your email.

Canada Trade Diversification 2026: China, Indonesia, UAE Deals Explained

US Forced-Labour Tariffs on 60 Countries: The Hidden Trade Shock of 2026

Global Central Banks 2026: Fed, BoE and BoJ Decisions Could Reshape Markets

Gulf Capital Retreat From Pakistan 2026: UAE Loan Freeze & What It Means

Pakistan’s Most Reliable Export Is Its People: Remittances Hit $41.6 Billion, Overtaking Total Exports

Indonesia’s Confidence Problem: Record Investment, a Sinking Rupiah, and a Widening Credibility Gap

Down But Not Out: Inside the Slow Sinking of Russia’s War Economy

China’s Growth Slips to a Four-Year Low: Why Beijing Still Won’t Pull the Stimulus Trigger

The Johor-Singapore Corridor: How Malaysia Became Southeast Asia’s AI Infrastructure Powerhouse

Canada’s Economy ‘On Pause’: Inside the CUSMA Deadline That Passed Without a Deal

Dubai’s Millionaire Magnet: How the UAE Turned Middle East Turmoil Into a Capital Safe-Haven Boom

Britain’s Sixth Prime Minister in a Decade: What Starmer’s Exit Means for Gilts, Sterling and Your Portfolio

Anthropic Offers Up to $600,000 Salary for Critical IPO Role as AI Giant Prepares for Wall Street Debut

EU Readies Crisis Team for Potential China Rare Earths Stand-Off as Supply Chain Risks Mount

Carry Trade Unwind 2026: How the Yen’s Snapback Triggered a Global Margin Call

AI Bubble Warning 2026: Why BIS, IMF and Bank of England Fear a Market Crash

BRICS De‑Dollarization Strategy Takes Shape with $15 Billion Local‑Currency Push

The AI Super Bubble Is Ready to Burst

Russia Bans Diesel Exports 2026: Global Fuel Market Impact Explained

Strait of Hormuz Blockade 2026: Oil Prices Surge 9% as US-Iran Conflict Reignites

Private Credit Warning: Most BDCs Turn Unprofitable in 2026, Reuters Finds

IMF Cuts Pakistan Growth Forecast, Raises Inflation to 8.4%

Bitcoin $150k Milestone Achieved as US Sovereign Crypto Pivot Looms
Gulf Capital Retreat From Pakistan 2026: UAE Loan Freeze & What It Means

India Economic Rise 2026: How the Subcontinent Toppled Japan

Strait of Hormuz 2026: Why Markets Still Don’t Trust It’s Open

Argentina Economy 2026: Milei’s Fiscal Surplus, Inflation Drop to 29%, and What Comes Next

China Housing Market Turnaround: White‑List Model Stabilises Prices
-

 Markets & Finance7 months ago
Top 15 Stocks for Investment in 2026 in PSX: Your Complete Guide to Pakistan’s Best Investment Opportunities
-

 Analysis5 months ago
Johor’s Investment Boom: The Hidden Costs Behind Malaysia’s Most Ambitious Economic Surge
-

 Analysis5 months ago
Top 10 Stocks for Investment in PSX for Quick Returns in 2026
-

 Analysis6 months ago
Brazil’s Rare Earth Race: US, EU, and China Compete for Critical Minerals as Tensions Rise
-

 Banks6 months ago
Best Investments in Pakistan 2026: Top 10 Low-Price Shares and Long-Term Picks for the PSX
-

 Investment7 months ago
Top 10 Mutual Fund Managers in Pakistan for Investment in 2026: A Comprehensive Guide for Optimal Returns
-

 Global Economy7 months ago
15 Most Lucrative Sectors for Investment in Pakistan: A 2025 Data-Driven Analysis
-

 Global Economy7 months ago
Pakistan’s Export Goldmine: 10 Game-Changing Markets Where Pakistani Businesses Are Winning Big in 2025