
Business
Trump’s Greenland Tariffs Trigger Sharp Stock Market Slide as Fear Gauge Spikes
Trump’s Greenland tariff threats sparked a 2% market plunge, pushing the VIX above 20 as investors flee U.S. assets. Analysis of the transatlantic crisis reshaping global markets.
Market Carnage as Geopolitical Gambit Rattles Investors
The trading floor of the New York Stock Exchange descended into controlled chaos on Tuesday, January 20, 2026, as President Donald Trump’s ultimatum over Greenland sent tremors through global financial markets. By the closing bell, the S&P 500 had hemorrhaged 143.15 points—a brutal 2.1% decline to 6,796.86—marking the benchmark index’s steepest single-day drop since October and erasing all gains accumulated in the young year.
“The fear trade is absolutely on right now,” observed Krishna Guha, head of global policy and central banking strategy at Evercore ISI, capturing the sentiment that gripped Wall Street as investors confronted an unprecedented scenario: the world’s most powerful economy threatening trade war against its closest military allies over territorial ambitions in the Arctic.
The Nasdaq Composite fared worse, plummeting 561.07 points or 2.4% to 22,954.32, while the Dow Jones Industrial Average shed 870 points—a 1.7% decline that wiped more than $1.2 trillion in market capitalization from the S&P 500 alone. The CBOE Volatility Index, Wall Street’s closely watched “fear gauge,” surged past the psychologically significant 20 threshold, reaching an intraday high of 20.99—levels not witnessed since mid-November when markets grappled with Federal Reserve policy uncertainty.
European markets mirrored the distress. Germany’s DAX plunged 1.0% to close at 24,703, while Britain’s FTSE 100 declined 0.7% and the pan-European STOXX 600 tumbled 0.7%, with the selloff intensifying throughout Tuesday’s session as the magnitude of the transatlantic rupture became apparent.
This was no ordinary market correction driven by earnings disappointments or macroeconomic data. This was a fundamental reassessment of geopolitical risk premiums, a repricing of American exceptionalism, and the emergence of what strategists termed the “Sell America” trade—a phenomenon not seen with such intensity since April 2025’s “Liberation Day” tariff tumult.
The convergence of Trump’s Greenland gambit with the annual World Economic Forum gathering in Davos created a surreal juxtaposition: global business leaders convening to discuss cooperation and prosperity even as the U.S. president threatened economic coercion against NATO allies. For investors navigating an already precarious landscape of elevated valuations, persistent inflation concerns, and approaching Federal Reserve leadership transitions, Trump’s Saturday announcement proved the catalyst for a long-anticipated reckoning.
The Greenland Escalation: From Sideshow to Systemic Crisis
President Trump’s interest in Greenland—the vast, ice-covered autonomous territory of Denmark—first surfaced during his initial term in 2019, when he privately floated the idea of purchasing the strategically located island. Danish officials dismissed the proposal as “absurd,” and the episode quickly faded from headlines, relegated to the category of Trumpian provocations that generated brief controversy before evaporating.
But what began as a seemingly quixotic fascination has metastasized into a full-blown diplomatic crisis with profound market implications. On Saturday, January 17, Trump announced via Truth Social that he would impose 10% tariffs on “any and all goods” from eight European nations—Denmark, Norway, Sweden, France, Germany, the United Kingdom, the Netherlands, and Finland—effective February 1, 2026. These levies would escalate to 25% on June 1 unless an agreement was reached for “the Complete and Total purchase of Greenland.”
Trump’s rationale combined national security imperatives with sweeping claims about Arctic geopolitics. “China and Russia want Greenland, and there is not a thing that Denmark can do about it,” Trump wrote, characterizing the joint military exercises recently conducted by European forces in Greenland as “a very dangerous situation for the Safety, Security, and Survival of our Planet.”
The timing of these military deployments—specifically by Danish, German, Norwegian, and French forces—was not coincidental. NATO allies had dispatched small contingents to Greenland in a calculated show of support for Denmark and a signal that they took Arctic security seriously, precisely the concern Trump claimed motivated his acquisition push. Yet Trump interpreted this allied solidarity as a “dangerous game” warranting punitive tariffs.
The targeted European nations represent some of America’s oldest and most strategically vital allies. Combined, these eight countries accounted for approximately $750 billion in bilateral trade with the United States in 2024, with Germany alone responsible for $236 billion, the United Kingdom $147.7 billion, and the Netherlands $122.3 billion, according to U.S. Census Bureau data. Imposing across-the-board tariffs on this volume of trade would constitute the largest unilateral trade action against allies in modern American history.
European leaders responded with unusual unity and force. In a joint statement released Sunday, leaders from the eight targeted nations warned that the tariff threats “undermine transatlantic relations and risk a dangerous downward spiral,” pledging to “stand united and coordinated in our response.” European Commission President Ursula von der Leyen and European Council President António Costa declared that “Europe will remain united, coordinated, and committed to upholding its sovereignty.”
French President Emmanuel Macron, attending the Davos forum, spoke of preferring “respect to bullies,” while Swedish Prime Minister Ulf Kristersson stated bluntly: “We will not let ourselves be blackmailed. Only Denmark and Greenland decide on issues concerning Denmark and Greenland.”
By Monday evening, the situation had further deteriorated when Trump threatened 200% tariffs on French wine after reports emerged that Macron had declined to join Trump’s proposed “Board of Peace” for Gaza. The escalation suggested a pattern of impulsive retaliation that heightened market anxiety about policy unpredictability.
Perhaps most revealing of the administration’s approach came during Tuesday’s White House briefing, when Trump was asked how far he would be willing to go to secure control of Greenland. His two-word response—”You’ll find out”—sent chills through diplomatic channels and trading desks alike. The president had declined to rule out military action in previous statements, and his cryptic answer did nothing to dispel concerns that the Greenland pursuit represented more than mere negotiating posture.
Anatomy of Tuesday’s Market Meltdown
The selloff that engulfed global markets on January 20 bore the hallmarks of a classic risk-off rotation, but with troubling undertones that distinguished it from routine volatility spikes. Investors weren’t merely seeking shelter from a passing squall; they were fundamentally reassessing the United States’ role as a stable anchor for global capital.
Equity Markets Under Siege
The carnage was broadly distributed across sectors, with only defensive consumer staples holding ground. Colgate-Palmolive gained 1.1% and Campbell’s rose 1.5% as investors sought refuge in recession-resistant names. But for cyclical and growth-oriented equities, Tuesday delivered punishing losses.
Technology stocks, which had led the market’s ascent through 2025, bore the brunt. The Nasdaq’s 2.4% decline reflected heightened concern that tariff-induced economic disruption would crimp corporate earnings precisely when valuations remained stretched. European technology shares fared no better, with the region’s tech-heavy sectors declining sharply.
Industrial conglomerate 3M plummeted 7% after reporting mixed quarterly results and CEO William Brown warned that proposed European tariffs could slice $60-70 million from 2026 earnings—a concrete example of how Trump’s Greenland strategy was already flowing through to corporate guidance. Automotive manufacturers, facing the prospect of severely disrupted transatlantic supply chains, suffered disproportionate losses. BMW, Volkswagen, Daimler Truck, Porsche, and Mercedes-Benz each declined between 3% and 3.7%, reflecting Germany’s particular vulnerability as an export-oriented economy.
European luxury goods makers, sensitive to both consumer confidence and currency movements, also stumbled. Shares of LVMH—owner of Moët & Chandon, Dom Pérignon, and Veuve Clicquot—fell 2.1% on concerns about Trump’s 200% wine tariff threat, while Rémy Cointreau declined modestly.
The breadth of the decline was striking: on the New York Stock Exchange, decliners outnumbered advancers by a 1.19-to-1 ratio, while the Nasdaq saw a 1.34-to-1 ratio favoring declining issues. A total of 18.77 billion shares changed hands, well above the recent 20-session average of 16.85 billion—a sign of forced repositioning rather than measured profit-taking.
The VIX Surge: Fear Reclaims 20
The CBOE Volatility Index’s breach of 20 represented more than a statistical milestone. The VIX had spent much of late 2025 oscillating between 12 and 16, reflecting market complacency despite elevated absolute valuations. Its jump to an intraday high of 20.99 on Tuesday—closing at approximately 20.71—signaled that the “honeymoon period” with Trump’s second-term economic policies had decisively ended.
Historically, VIX readings above 20 indicate heightened investor anxiety and often presage periods of sustained turbulence. The index’s surge reflected surging demand for portfolio insurance through S&P 500 options, with traders paying premiums to protect against further downside. Notably, VIX futures curves inverted slightly, suggesting near-term volatility concerns outweighed long-term fears—a pattern consistent with event-driven spikes rather than structural bear markets.
“The VIX reclaiming the 20 level is more than just a statistical milestone; it is a clear signal that the market’s ‘honeymoon period’ with the current administration’s economic policies has ended,” noted analysts at FinancialContent, emphasizing that the convergence of the Greenland tariff threat with earnings uncertainty and lingering effects of the 43-day government shutdown had created a “visibility gap” making every headline a potential market-mover.
Safe-Haven Flows: Gold, Silver, and Treasury Dynamics
The flight to safety manifested most dramatically in precious metals markets. Gold surged to new all-time highs, trading near $4,600 per ounce—a gain of approximately 6% year-to-date. Silver outperformed even gold’s impressive advance, soaring above $95 per ounce, representing a remarkable 16% gain since January 1 and more than 200% appreciation from year-ago levels.
The precious metals rally reflected multiple anxieties: inflation hedging, currency debasement concerns, and pure geopolitical risk aversion. Analysts at Bank of America noted that gold was serving as “the primary hedge and performance driver in 2026,” with some forecasts suggesting silver could reach as high as $135-$309 per ounce if industrial demand for green energy applications continued accelerating alongside safe-haven buying.
Paradoxically, U.S. Treasury prices fell sharply Tuesday despite their traditional safe-haven status, sending yields spiking. The 10-year Treasury yield jumped approximately 6 basis points to 4.29%, while 20- and 30-year yields also climbed—making it more expensive for the U.S. government to service its $36 trillion debt burden. This atypical behavior signaled something more troubling than routine risk rotation: international investors were actively selling American sovereign debt, questioning the reliability of U.S. policy commitments.
Denmark’s announcement that pension fund Akademikerpension would sell $100 million in U.S. Treasuries—citing “poor U.S. government finances” but clearly motivated by the Greenland dispute—provided a concrete example of the “Sell America” dynamic. While Treasury Secretary Scott Bessent dismissed the move as “irrelevant” given its modest size, the symbolic importance was unmistakable: even small, wealthy U.S. allies were beginning to weaponize their dollar holdings.
Currency Markets Signal Confidence Crisis
The U.S. Dollar Index, which measures the greenback against a basket of six major currencies, tumbled nearly 1%—its sharpest single-day decline since April 2025. The euro gained 0.6% against the dollar, reflecting not European economic strength but rather a repricing of American political risk.
“This is ‘sell America’ again within a much broader global risk off,” wrote Krishna Guha of Evercore ISI, noting that the dollar’s weakness and euro’s strength suggested global investors were “looking to reduce or hedge their exposure to a volatile and unreliable” United States. The currency movements were particularly significant given that international capital had flooded into dollar-denominated assets throughout 2024 and 2025, drawn by American growth outperformance and the AI investment boom.
Guha warned that if Trump failed to walk back his Greenland plans—a trade known colloquially as “TACO” (Trump Always Chickens Out)—or find a diplomatic compromise, the impacts on the dollar and other U.S. assets “could be severe and long-term.”
The Geopolitical Stakes: Why Greenland Matters
To understand why markets reacted with such alarm to Trump’s Greenland gambit requires examining the island’s unique strategic significance and the broader Arctic competition reshaping 21st-century geopolitics.
Geographic Imperative: The GIUK Gap and Arctic Chokepoints
Greenland occupies a position of extraordinary strategic importance, sitting astride the GIUK Gap—the maritime corridor between Greenland, Iceland, and the United Kingdom. During the Cold War, this choke point was crucial for monitoring Soviet submarine movements between the Arctic and the Atlantic. Today, as Russia rebuilds its Northern Fleet and increases Arctic military activity, the GIUK Gap has regained salience as a surveillance and potential interdiction zone.
The United States maintains Pituffik Space Base (formerly Thule Air Base) in northwestern Greenland—a critical installation for missile early warning, space surveillance, and satellite tracking. Established in 1951 under a defense agreement with Denmark, Pituffik provides coverage of potential ballistic missile launches from Russia and gives the U.S. strategic depth for Arctic operations.
Climate change has dramatically elevated Greenland’s importance. Melting Arctic ice is opening new shipping routes—the Northwest Passage along North America’s northern coast and the Transpolar Sea Route through the central Arctic Ocean—that could slash transit times between Asia, Europe, and North America. These emerging corridors will require infrastructure, maritime governance, and security frameworks. Greenland’s geographical position makes it central to managing this transformation.
The Rare Earth Dimension: Critical Minerals and Supply Chain Vulnerability
Beyond military geography, Greenland harbors substantial deposits of rare earth elements and other critical minerals essential for modern technology, renewable energy systems, and defense applications. The island’s mineral wealth includes rare earths, uranium, iron ore, and potentially significant oil and gas reserves.
Rare earth elements—comprising 17 minerals crucial for high-performance magnets, electronics, and precision guidance systems—represent a particular vulnerability for Western economies. China currently dominates the global rare earth supply chain, controlling approximately 60% of mining and more than 90% of processing capacity. This monopoly position grants Beijing potential leverage over industries ranging from electric vehicles to wind turbines to advanced weaponry.
Greenland’s Tanbreez and Kvanefjeld deposits contain substantial heavy rare earth reserves that could diversify supply chains away from Chinese dominance. In June 2025, the U.S. Export-Import Bank expressed interest in providing a $120 million loan to fund Tanbreez mining development—signaling the Trump administration’s recognition of Greenland’s resource value.
However, exploiting these resources faces daunting obstacles: extreme climate conditions, mountainous terrain, virtually non-existent infrastructure, and stringent environmental regulations championed by Greenland’s largely Indigenous Inuit population. Mining development remains aspirational rather than imminent, and any projects would require sustained multi-billion-dollar investments over decades.
The China Factor: Arctic Ambitions and the Polar Silk Road
China declared itself a “near-Arctic state” in 2018—a geographically questionable designation given China’s distance from the Arctic Circle—and announced its “Polar Silk Road” strategy as an extension of the Belt and Road Initiative. Beijing has pursued scientific research stations, infrastructure investments, and resource acquisition throughout the Arctic, though with limited success in Greenland specifically.
Chinese attempts to invest in Greenlandic airports were blocked in 2018 after Danish and U.S. pressure, and other mining ventures involving Chinese partners have stalled or failed. Nevertheless, China’s Arctic ambitions remain a persistent concern for Washington, particularly as Beijing deepens its relationship with Russia and expands its ice-capable naval fleet.
Trump administration officials have framed Greenland acquisition as essential to countering Chinese influence. Former national security adviser Mike Waltz stated explicitly that the focus was “about critical minerals” and “natural resources,” while Trump himself has alternately emphasized national security and economic imperatives.
Russia’s Arctic Militarization: The Northern Fleet Resurgence
Russia has systematically rebuilt its Arctic military capabilities since 2014, reopening Cold War-era bases, constructing new facilities, and expanding its Northern Fleet—the world’s largest ice-capable naval force. Moscow views the Arctic as central to its strategic deterrent, with nuclear-armed submarines operating from Arctic ports and new hypersonic missile systems deployed in the region.
Russian President Vladimir Putin, speaking at the March 2025 International Arctic Forum in Murmansk, acknowledged Trump’s Greenland ambitions and warned that “Russia has never threatened anyone in the Arctic, but we will closely follow the developments and mount an appropriate response by increasing our military capability and modernising military infrastructure.”
European leaders’ Arctic concerns intensified following Russia’s 2022 invasion of Ukraine, which shattered assumptions about post-Cold War cooperation. The recent deployment of small European military contingents to Greenland—the very exercises Trump characterized as “dangerous”—reflected NATO’s growing focus on Arctic security in an era of renewed great-power competition.
Market Implications: Unpacking the “Fear Trade”
The question confronting investors as markets opened Wednesday was whether Tuesday’s selloff represented a one-day event-driven correction or the opening chapter of a more sustained revaluation of American asset attractiveness.
The “Sell America” Trade: Structural or Cyclical?
The “Sell America” phenomenon—simultaneous selling of U.S. stocks, bonds, and currency—first emerged during April 2025’s “Liberation Day” tariff announcement, when Trump unveiled sweeping global tariffs. That episode proved temporary as administration officials walked back some of the more extreme measures and markets recovered.
The Greenland situation differs in crucial respects. First, it involves military allies rather than economic competitors, raising fundamental questions about alliance cohesion and American reliability. Second, Trump’s willingness to risk NATO unity over territorial acquisition suggests a foreign policy approach less constrained by traditional diplomatic considerations. Third, the convergence with approaching Supreme Court rulings on presidential tariff authority creates legal uncertainty layered atop policy volatility.
Citi strategist Beata Manthey captured the shift in market dynamics: “The latest step-up in transatlantic tensions and tariff uncertainty dents the near-term investment case for European equities, casting doubt on broad-based EPS inflection in 2026.” Manthey downgraded Continental Europe to Neutral for the first time in over a year and specifically downgraded “internationally exposed” sectors including autos and chemicals.
JPMorgan strategist Greg Fuzesi warned that if the Greenland issue “triggers a larger sentiment effect by generating more profound uncertainty, its economic implications could be larger” than the direct trade impact. This observation highlights the distinction between calculable first-order effects (tariff costs) and incalculable second-order effects (confidence collapse, investment paralysis, alliance dissolution).
Sector Vulnerabilities: From Industrials to Luxury Goods
Specific sectors face disproportionate exposure to transatlantic trade disruption. Automotive supply chains, highly integrated across the Atlantic, would suffer severe dislocation from 25% tariffs. German manufacturers, already grappling with transition to electric vehicles and Chinese competition, could see European production become economically unviable for U.S. export.
Aerospace and defense contractors paradoxically face both risks and opportunities. Deteriorating transatlantic relations could jeopardize collaborative programs like the F-35 fighter jet, which involves components from multiple European suppliers. Conversely, increased European defense spending in response to perceived American unreliability could boost European defense stocks at the expense of American contractors.
Luxury goods makers face demand destruction from weakened consumer confidence alongside currency headwinds. The dollar’s decline makes European luxury items less affordable for American consumers, while tariff costs would force either price increases (dampening demand) or margin compression (reducing profitability).
Financial services firms confront operational complexity from fragmented regulatory landscapes and heightened compliance costs if transatlantic economic coordination breaks down. The prospect of the European Union deploying its “anti-coercion instrument”—the so-called “trade bazooka” permitting restrictions on U.S. firms’ access to European markets—represents an existential threat for American financial institutions with significant European operations.
Valuation Multiples in a Higher-Risk Environment
Perhaps most consequential for long-term investors: elevated equity valuations predicated on assumptions of policy stability, earnings growth, and dollar dominance suddenly appear vulnerable. The S&P 500’s cyclically adjusted price-to-earnings (CAPE) ratio hovers near 40—historically associated with subsequent decade-long underperformance. Such valuations presume sustained corporate profitability and investor confidence.
If geopolitical risk premiums permanently expand due to American foreign policy unpredictability, equity valuations must compress to compensate investors for increased uncertainty. A modest 10% valuation haircut would imply S&P 500 levels around 6,100—roughly 10% below Tuesday’s close—without any change to underlying earnings prospects.
“Markets may already be pricing in full the concept of American exceptionalism, at least barring an epic, crack-up economic boom,” observed strategist Mould. “It may therefore not take too much to persuade investors to hedge their bets and diversify.”
European Response: The Anti-Coercion Instrument and Retaliation Scenarios
European leaders convened emergency consultations immediately following Trump’s Saturday announcement, with EU ambassadors holding Sunday meetings and further discussions scheduled throughout the week at the Davos forum. The range of potential responses spans from diplomatic protest to economic warfare.
The “Trade Bazooka”: Europe’s Nuclear Option
The European Union’s anti-coercion instrument (ACI), adopted in 2023 and colloquially termed the “trade bazooka,” provides Brussels with sweeping retaliatory powers against economic coercion by non-EU countries. French President Emmanuel Macron reportedly requested ACI activation during emergency meetings, with German MEP Bernd Lange, who chairs the European Parliament’s trade committee, explicitly calling for immediate deployment.
The ACI permits the EU to:
- Restrict U.S. businesses’ access to Europe’s single market
- Exclude American suppliers from EU public procurement tenders
- Impose export and import restrictions on U.S. goods and services
- Limit foreign direct investment from American firms
- Suspend preferential trade agreements
These measures would represent the most significant transatlantic economic rupture since World War II, dwarfing trade disputes of the 1970s and 1980s. European officials have indicated that a package exceeding $100 billion in counter-tariffs is already prepared, targeting American products from bourbon to Harley-Davidson motorcycles to agricultural commodities—classic retaliatory items designed to inflict political pain in swing states.
Legal and Institutional Constraints
European leaders face delicate calibration challenges. Overreacting to Trump’s threats risks accelerating a downward spiral and potentially playing into narratives of European aggression that could fracture transatlantic unity. Underreacting invites further coercion and signals weakness that could embolden not only the Trump administration but also authoritarian powers watching to gauge Western resolve.
Moreover, Trump’s tariffs target individual member states rather than the EU collectively, creating a technical complexity: does Brussels possess authority to retaliate on behalf of sovereign nations for bilateral disputes? This loophole—whether intentional or accidental—could provide a face-saving mechanism for de-escalation but also creates enforcement ambiguity.
The Supreme Court’s pending ruling on whether Trump can use the International Emergency Economic Powers Act (IEEPA) to impose tariffs adds another layer of uncertainty. If the Court curtails presidential tariff authority, Trump’s Greenland leverage evaporates—but the damage to alliance trust may prove lasting. If the Court upholds broad executive discretion, European leaders must contemplate a permanent shift in the transatlantic economic architecture.
Congressional Pushback and Partisan Divisions
Notably, Trump faces significant opposition from within his own party regarding the Greenland strategy. Republican Senators Lisa Murkowski, Thom Tillis, and Representative Don Bacon have sharply criticized the tariff threats and territorial ambitions.
“This is appalling. Greenland is a NATO ally. Denmark is one of our best friends… so the way we’re treating them is really demeaning and it has no upside,” stated Rep. Bacon. Senator Murkowski, who represents Alaska and possesses deep Arctic expertise, warned that pressuring allies “plays directly into Putin’s hands” and urged Congress to “reassert our Constitutional authority over tariffs so that they are not weaponized in ways that harm our alliances.”
Senate Minority Leader Chuck Schumer announced plans to introduce legislation blocking tariffs against countries opposing Greenland acquisition, though passage faces long odds in the narrowly divided Congress. Nevertheless, the bipartisan congressional delegation that visited Copenhagen and Greenland during the tariff announcement sent a powerful message that Trump lacks unified domestic support for his approach.
Forward Scenarios: From Davos Diplomacy to Constitutional Crisis
As Trump arrived in Davos on Wednesday for meetings with European leaders and CEOs, market participants confronted multiple potential outcomes, each carrying distinct implications for asset prices.
Scenario 1: De-escalation and Strategic Ambiguity
In this optimistic case, face-to-face meetings in Davos yield tacit understandings that allow both sides to step back from the brink. Trump might secure enhanced U.S. military access to Greenland, expanded cooperation on Arctic security, and European commitments to facilitate American rare earth mining investments—while formally abandoning acquisition demands.
Denmark and Greenland could frame such concessions as pragmatic security cooperation consistent with existing defense agreements rather than capitulation to coercion. The tariff threats would be postponed or quietly shelved, allowing markets to rebound as immediate crisis dissipates.
This scenario presumes Trump values deal-making optics over ideological commitment to territorial expansion and that European leaders possess sufficient domestic political capital to make concessions without appearing weak. Market probability: 35-40%.
Scenario 2: Legal Resolution through Supreme Court Ruling
If the Supreme Court rules against the administration’s use of IEEPA for tariff imposition—a decision potentially imminent—Trump’s Greenland leverage collapses absent alternative legal authorities. The Court appeared skeptical during oral arguments about executive branch claims that emergency economic powers implicitly include tariff authority.
A favorable ruling for plaintiffs challenging presidential tariff powers would trigger market relief, with possible 3-5% equity rallies erasing Tuesday’s losses. However, Trump’s pursuit of Greenland through other means (diplomatic pressure, military posturing, congressional legislation) would remain possible, sustaining elevated uncertainty even as immediate tariff risks recede.
This scenario hinges entirely on Supreme Court jurisprudence regarding executive power scope and statutory interpretation. Market probability: 25-30%.
Scenario 3: Escalation and Transatlantic Economic Warfare
In this bleakest scenario, Trump implements the threatened tariffs on February 1, Europe retaliates with its prepared counter-tariff package and potentially activates the ACI, and the situation cascades into full-scale trade war. Corporate supply chains fracture, cross-border investment collapses, and NATO cohesion erodes as economic conflict spills into security cooperation.
Extended market volatility would likely see the VIX sustained above 25, equity indexes declining an additional 10-15% from Tuesday’s levels, and recession risks spiking as business confidence evaporates. Gold could surge toward $5,000 per ounce while the dollar enters a protracted decline as foreign central banks diversify reserves away from Treasury securities.
This scenario assumes both sides misjudge the other’s resolve, domestic political pressures prevent compromise, and institutional guardrails prove insufficient to arrest the deterioration. Market probability: 15-20%.
Scenario 4: Chronic Uncertainty and Range-Bound Markets
Perhaps most likely: an extended period of elevated uncertainty without definitive resolution. Trump neither abandons Greenland ambitions nor implements maximum tariffs, while Europeans maintain retaliatory threats without activation. The situation becomes a persistent background risk factor that elevates volatility premiums and depresses valuations without triggering acute crisis.
In this scenario, markets trade in choppy ranges with frequent volatility spikes on headline developments. The VIX remains structurally elevated in the 18-22 range rather than reverting to sub-15 complacency. Investors demand higher risk premiums for holding equities, particularly those with international exposure, while defensive sectors and dividend aristocrats outperform growth stocks.
This outcome reflects the broader challenge of valuing assets in an environment of perpetual policy uncertainty, where traditional forecasting models break down and political risk becomes a dominant variable. Market probability: 25-30%.
Investment Implications: Navigating the New Volatility Regime
For investors seeking to position portfolios amid this geopolitical maelstrom, several considerations merit attention.
Geographic Diversification Beyond U.S. Exposure
The Greenland crisis reinforces the case for geographic diversification away from excessive U.S. concentration. While American equities have delivered extraordinary returns over the past decade, the combination of peak valuations and heightened policy risk argues for rebalancing toward European, Asian, and emerging market exposures.
Paradoxically, European equities may offer relative value if the Greenland situation resolves without full-scale trade war. Depressed valuations following Tuesday’s selloff create entry points for patient investors willing to accept elevated near-term volatility. German industrials and French luxury goods, trading at depressed multiples, could deliver substantial returns if transatlantic tensions ease.
Sector Rotation Toward Defensives and Quality
Within U.S. equity portfolios, shifting toward defensive sectors with stable cash flows and limited international exposure offers some protection. Utilities, consumer staples, healthcare, and telecommunications historically outperform during periods of geopolitical stress and elevated volatility.
The concept of “quality” investing—emphasizing strong balance sheets, consistent profitability, and robust competitive advantages—gains relevance when macro uncertainty dominates. Companies with pricing power, low debt levels, and diversified revenue streams possess superior resilience during extended periods of turbulence.
Precious Metals as Portfolio Insurance
Gold and silver’s Tuesday surge underscores their continuing relevance as portfolio diversifiers and inflation hedges. While precious metals generate no income and can experience extended periods of underperformance, they provide non-correlated returns during equity market stress.
Analysts at Bank of America and other institutions suggest allocating 5-10% of portfolios to precious metals exposure through physical holdings, ETFs, or mining equities. Silver’s industrial applications in solar panels, electric vehicles, and electronics create dual support from both safe-haven demand and green energy transition tailwinds.
Fixed Income Complexity: Duration Risk and Credit Selection
The Treasury market’s Tuesday behavior—declining prices despite equity selloff—illustrates the challenges facing bond investors. Traditional stock-bond diversification benefits may prove less reliable if foreign creditors reduce U.S. sovereign debt holdings or inflation concerns resurface.
Shorter-duration bonds and floating-rate instruments provide some protection against rising yields, while investment-grade corporate bonds from companies with minimal international exposure offer alternatives to government securities. Municipal bonds, insulated from federal trade policy, represent another consideration for taxable accounts.
Volatility as an Asset Class
Sophisticated investors might consider volatility-linked products that benefit from elevated VIX levels. VIX futures, options, and structured notes allow tactical positioning around volatility spikes, though these instruments carry complexity and risks unsuitable for retail portfolios.
For those comfortable with options strategies, purchasing protective puts on equity positions or implementing collar strategies (selling upside calls while buying downside puts) can limit losses during extended volatility regimes, albeit at the cost of capping gains.
The Davos Reckoning: Policy Uncertainty as Permanent Condition
As global leaders gathered in the Swiss Alps for the World Economic Forum’s annual meeting, the cognitive dissonance was palpable. CEOs and heads of state convening to discuss cooperation, innovation, and sustainable development found themselves confronting an American president threatening territorial conquest and economic warfare against democratic allies.
Treasury Secretary Scott Bessent, attempting to calm nerves at Davos, drew distinctions between the Greenland situation and routine trade negotiations: “What President Trump is threatening on Greenland is very different than the other trade deals. So I would urge all countries to stick with their trade deals, we have agreed on them, and it does provide great certainty.” The message—that Greenland represents a unique national security imperative rather than a template for future coercive tactics—offered limited reassurance given the administration’s track record.
Bank CEOs, including Goldman Sachs International co-CEO Anthony Gutman, acknowledged the new reality: “This is the new normal,” he told CNBC, noting that volatility from policy uncertainty now represented a persistent feature of the investment landscape rather than an aberration. ING Group CEO Steven Van Rijswijk characterized Europe’s experience with Trump’s first-term “Liberation Day” tariffs as “a wake-up call” regarding the weaponization of trade policy.
The broader question confronting the Davos elite: whether Trump’s Greenland pursuit represents an isolated fixation or harbingers a fundamental reordering of American foreign policy priorities, where territorial ambition, unilateral coercion, and transactional alliance relationships supersede post-World War II norms of multilateral cooperation and institutional restraint.
Conclusion: When Geopolitics Trumps Economics
The market carnage of January 20, 2026, delivered an uncomfortable lesson about the limits of economic modeling in an age of resurgent great-power competition and nationalist foreign policy. Investors accustomed to parsing Federal Reserve communications, analyzing corporate earnings, and projecting growth trajectories suddenly confronted a different calculus: the political risk of an American president threatening force and economic coercion to acquire allied territory.
The fear that gripped markets Tuesday extended beyond tariff arithmetic or trade flow disruptions. It reflected deeper anxieties about American reliability, alliance cohesion, and the potential unraveling of the rules-based international order that has underpinned globalization and cross-border capital flows for eight decades.
For Europe, the Greenland crisis forces a reckoning postponed since Trump’s first term: whether the continent can continue relying on American security guarantees and economic partnership, or must chart a more autonomous path with all the costs and complexities that entails. For Asian and Middle Eastern allies observing from afar, the spectacle of the United States threatening NATO partners over territorial desires raises uncomfortable questions about Washington’s commitment to longstanding alliance frameworks.
For investors, the imperative becomes managing portfolios in an environment where geopolitical shocks can materialize with minimal warning and political risk dominates traditional financial analysis. The comfortable assumption that American assets represent a safe harbor in troubled times—a presumption dating to the Bretton Woods era—faces its most serious challenge since the 1970s stagflation.
As dawn broke over Asian markets Wednesday morning, with traders in Tokyo, Hong Kong, and Shanghai watching European close figures and awaiting Trump’s Davos appearances, the question dominating investor consciousness was elegantly simple yet profoundly difficult to answer: Is this the beginning of a new regime of persistent policy uncertainty and elevated volatility, or merely another tempest that will pass as quickly as it arrived?
The market will deliver its verdict in the days ahead. What remains certain is that Tuesday, January 20, 2026, marked a inflection point—the day when Wall Street’s fear gauge spiked, global equity markets hemorrhaged value, and investors began seriously contemplating a world where American exceptionalism could no longer be taken for granted.
The fear trade, as one analyst observed, is absolutely on. And it may be on for considerably longer than anyone anticipated.
Sources Referenced
- Market Data: Real-time financial data from major exchanges (NYSE, Nasdaq, European bourses)
- CBOE Global Markets: VIX index levels and volatility metrics
- Trump Statements: Truth Social posts and White House briefing transcripts
- European Response: Joint statements from EU leaders, European Commission, European Council
- Analyst Commentary: Evercore ISI (Krishna Guha), Citi (Beata Manthey), JPMorgan, Bank of America
- Corporate Guidance: 3M earnings report and tariff impact projections
- Congressional Response: Statements from Senators Murkowski, Tillis, Rep. Bacon, Sen. Schumer
- Davos Coverage: World Economic Forum proceedings, Treasury Secretary Bessent remarks
- Precious Metals Markets: Gold and silver spot prices, analyst forecasts
- Currency Markets: U.S. Dollar Index, euro-dollar exchange rates
- Geopolitical Analysis: Arctic security assessments, rare earth supply chain reports
- Historical Context: Previous Trump tariff episodes, transatlantic trade history
Discover more from The Economy
Subscribe to get the latest posts sent to your email.


AI
Apple’s Next Chief Ternus Faces Defining AI Moment: Tim Cook’s Replacement Must Lead iPhone-Maker Through Industry Shift
The tectonic plates of Silicon Valley shifted unequivocally on April 20, 2026. After a historic 15-year tenure that propelled the iPhone maker to an unprecedented $4 trillion valuation, Tim Cook announced he will step down on September 1, transitioning to the role of Executive Chairman. The keys to the kingdom now pass to John Ternus, the 51-year-old hardware engineering savant who has spent a quarter-century architecting the physical foundation of Apple’s most iconic modern devices.
Yet, as the dust settles on this long-anticipated Apple CEO succession plan, a stark reality emerges. Ternus is inheriting a radically different landscape than the one Cook received from Steve Jobs in 2011. Cook was tasked with scaling an undisputed hardware monopoly; Ternus is tasked with defending it against an existential software threat.
As Tim Cook’s replacement, Ternus assumes the mantle at the exact moment the technology sector pivots from the mobile era to the generative artificial intelligence epoch. His success will not be measured by supply chain efficiencies or incremental hardware upgrades, but by his ability to define and execute a winning Apple Intelligence strategy in an increasingly hostile, hyper-competitive market.
The Dawn of the Ternus Era: From Operations Titan to Hardware Visionary
To understand the trajectory of the John Ternus Apple CEO era, one must examine the fundamental differences in leadership DNA between the outgoing and incoming chief executives. Tim Cook is, at his core, an operational genius. His legacy is defined by mastery of global supply chains, geopolitical diplomacy, and the methodical extraction of maximum margin from the iPhone ecosystem.
Ternus, conversely, is an engineer’s engineer. Having overseen the iPad, the AirPods, and the monumental transition of the Mac to Apple Silicon, he deeply understands the intersection of silicon and user experience. Insiders report that Ternus brings a decisively different management style to the C-suite. Where Cook historically preferred a Socratic, hands-off approach to product development—acting as a consensus-builder among top brass—Ternus is known for making swift, definitive product choices.
This decisive edge is precisely what the company requires as it navigates its most pressing vulnerability: its artificial intelligence deficit. A recent Reuters report on Apple’s corporate governance and succession highlights that Ternus’s mandate is to aggressively reinvent the product lineup to meet modern consumer expectations. However, being a hardware visionary is no longer sufficient. The modern device is merely an empty vessel without a pervasive, context-aware intelligence layer running beneath the glass.
The Intelligence Deficit: Combating the Decline in Apple AI Market Share
Apple’s entry into the artificial intelligence arms race has been characterized by uncharacteristic hesitation and strategic missteps. While Microsoft, Google, and Meta sprinted ahead with large language models (LLMs) and advanced neural architectures, Apple opted for a walled-garden, on-device approach that has struggled to keep pace with cloud-based capabilities.
The Apple AI market share currently lags behind its chief rivals, largely due to a fragmented rollout and technological bottlenecks. The initial deployment of Apple Intelligence was marred by delayed features and an overly cautious integration of third-party tools. Most notably, in late March 2026, a botched, accidental rollout of Apple Intelligence in China—a market where Apple lacks the requisite regulatory approvals and relies heavily on local partners to bypass restrictions—highlighted the immense logistical hurdles the company faces.
As highlighted by Bloomberg’s recent analysis on Apple’s AI deployments, Apple’s decision to integrate Google’s Gemini model to power a revamped Siri underscores a painful truth: the company cannot win the AI war in isolation. Ternus must immediately stabilize these partnerships while simultaneously accelerating Apple’s in-house foundational models. He inherits an AI division that saw the departure of key leadership in late 2025, leaving a strategic vacuum that the new CEO must fill with undeniable urgency.
Recalibrating the Apple Intelligence Strategy
The challenge for Ternus is twofold: he must merge his innate understanding of hardware architecture with an aggressive software and cloud strategy. According to a Gartner report on AI adoption and edge computing, the future of enterprise and consumer tech lies in a hybrid model—balancing the privacy and speed of edge computing (processing on the device) with the raw, expansive power of cloud-based LLMs.
Ternus’s immediate priority will be launching iOS 27 and the anticipated overhaul of Siri. It is no longer enough for Siri to be a reactive voice assistant; it must evolve into a proactive, system-wide autonomous agent capable of reasoning, executing complex in-app tasks, and seamlessly analyzing user data without compromising Apple’s rigid privacy standards.
This is where Ternus’s decisive nature will be tested. He must be willing to cannibalize legacy software structures and perhaps even open the iOS ecosystem to deeper third-party AI integrations than Apple is historically comfortable with. The Apple Intelligence strategy must pivot from being a defensive moat to an offensive spear.
The Future of Apple Hardware: AI-First Architecture
Because Ternus is rooted in hardware, his most significant leverage lies in reimagining the physical devices that will house these new AI models. The future of Apple hardware is inextricably linked to the evolution of neural processing units (NPUs).
In tandem with Ternus’s promotion, Apple elevated its silicon architect, Johny Srouji, to Chief Hardware Officer. This alignment is not coincidental. It signals a unified front where hardware and silicon are co-developed exclusively to run massive AI workloads. We can expect future iterations of the iPhone and Mac to feature a radical redesign of thermal management and memory bandwidth, specifically tailored to support on-device inference for generative AI.
Furthermore, Ternus—who reportedly expressed caution regarding the high-risk development of the Vision Pro and the now-cancelled Apple Car—will likely ruthlessly prioritize form factors that deliver immediate AI value. We are likely to see a convergence of wearables and AI, where devices like AirPods and the Apple Watch act as persistent, ambient interfaces for Apple Intelligence, rather than relying solely on the iPhone screen.
Silicon Valley Geopolitics: The Burden of the $4 Trillion Crown
Beyond the silicon and software, Ternus faces a daunting geopolitical landscape. Tim Cook was a master statesman, successfully navigating the treacherous waters of the US-China trade wars, negotiating with consecutive presidential administrations, and maintaining a fragile equilibrium with international regulators. As The Wall Street Journal’s ongoing coverage of tech monopolies points out, global regulatory bodies are increasingly hostile toward Big Tech’s walled gardens.
With Cook serving as Executive Chairman and managing international policy, Ternus has a temporary shield. However, the ultimate responsibility for antitrust compliance, App Store regulations, and navigating the complex AI compliance laws of the European Union and China will soon rest entirely on his shoulders.
Conclusion: The Decisive Leadership Required for Apple’s Next Decade
As September 1 approaches, the global markets are watching with bated breath. John Ternus is not stepping into a role that requires a steady hand to maintain the status quo; he is stepping into a crucible that requires a wartime CEO mentality.
The transition from Tim Cook to John Ternus marks the end of Apple’s era of operational perfectionism and the beginning of its most critical existential challenge since the brink of bankruptcy in the late 1990s. To justify its $4 trillion valuation, the future of Apple hardware must become the undisputed premier vessel for consumer artificial intelligence.
Ternus possesses the engineering pedigree, the institutional respect, and the decisive operational mindset required for the job. Now, he must prove he possesses the visionary foresight to lead the iPhone maker through the most disruptive industry shift in a generation. The hardware is set; the intelligence is pending.
Discover more from The Economy
Subscribe to get the latest posts sent to your email.
The Nominee to Lead the World’s Most Powerful Central Bank Wants Big Changes. But There’s Risk of Confrontation with the President Over Interest Rates.
Tomorrow morning, at 10 a.m. in Washington, a 55-year-old former investment banker turned Hoover Institution fellow will sit before the Senate Banking Committee and attempt the most perilous balancing act in contemporary economic governance. Kevin Warsh, President Donald Trump’s nominee to chair the Federal Reserve, must simultaneously convince senators that he will pursue price stability with independence, assure markets that he won’t torch the institutional credibility it took decades to build, and somehow avoid telegraphing to his future boss in the White House that he does not, in fact, intend to slash interest rates to 1 percent on demand.
This is not merely a confirmation hearing. It is the opening act of what may become the defining institutional drama of Trump’s second term — and the outcome will reverberate from Frankfurt to Jakarta, from London gilt markets to South Asian currency floors.
The Nomination Nobody Saw Coming — and Everyone Did
Trump announced Warsh’s nomination on January 30, 2026, formally submitting it to the Senate on March 4. On its surface, the choice was bold: Warsh is a Republican economist with genuine monetary policy experience, having served as the youngest-ever Fed governor from 2006 to 2011, navigating the white-water rapids of the global financial crisis alongside Ben Bernanke. He is credentialed (Stanford undergraduate, Harvard Law), well-connected (Morgan Stanley investment banker before his Fed tenure, advisory work for Stanley Druckenmiller’s family office thereafter), and politically aligned.
But Warsh’s financial disclosures, filed this week in a dense 69-page document, reveal a wealth profile that sets him apart from every Fed chair in modern history. His personal holdings range between $135 million and $226 million — the imprecision owing to Senate disclosure rules that allow assets to be reported in open-ended ranges, with two positions in the “Juggernaut Fund” listed simply as “over $50 million each.” His wife, Jane Lauder, granddaughter of cosmetics legend Estée Lauder, carries an estimated net worth of $1.9 billion according to Forbes. Combined, the Warsh-Lauder household may represent the wealthiest family ever to occupy the Fed’s Eccles Building.
Senator Elizabeth Warren, never one to miss a theatre cue, was already scrutinizing the fund disclosures Thursday, pointing to the opacity of the Juggernaut holdings as a potential conflict-of-interest issue. Warsh has pledged to divest if confirmed — a commitment his legal team will need to execute with considerable speed, given that Powell’s term expires May 15 and the White House has made clear it wants its man in the chair by then.
That timeline is under pressure from an unexpected quarter. Senator Thom Tillis of North Carolina, a senior Republican on the Banking Committee, has declared he will block Warsh’s final confirmation vote unless the Justice Department drops its criminal investigation into Powell — a probe many believe was manufactured specifically to bully the current chair into rate cuts. Republicans hold a razor-thin Senate majority, meaning Tillis’s objection alone can derail the entire nomination. As of this writing, the DOJ investigation remains open. Jeanine Pirro, U.S. Attorney for the District of Columbia, has pledged to press forward despite setbacks. The confirmation math is deeply uncomfortable for everyone involved.
From Hawk to Hawkish Dove: The Policy Evolution That Made Him Palatable to Trump
If you had asked financial markets in 2011 whether Kevin Warsh would ever be seen as a rate-cut ally, the response would have been laughter. During his tenure as Fed governor, Warsh was among the most vocal critics of quantitative easing, warning presciently that the Fed’s expanding balance sheet would create long-term distortions in capital markets. He dissented against what he viewed as mission creep — a central bank that had metastasised from lender of last resort into a structural participant in government bond markets.
That hawkishness has not vanished. It has been refashioned. In the years since leaving the Fed, Warsh has constructed an intellectual framework that allows him to advocate for lower short-term interest rates while simultaneously demanding dramatic reductions in the Fed’s $6.7 trillion balance sheet. The argumentative keystone is artificial intelligence. Warsh contends that an AI-driven productivity surge — already visible in frontier sectors, he argues — creates the conditions under which rate cuts need not be inflationary. If AI meaningfully expands productive capacity, the neutral interest rate falls, and current policy rates are, in this framing, de facto restrictive even without any acceleration in prices.
It is a seductive thesis. It also has its serious critics. Chicago Fed President Austan Goolsbee told journalists in February that the Fed should emphatically not bank on AI-driven productivity gains to pre-emptively justify looser policy. “You can overheat the economy easily,” Goolsbee cautioned, urging “circumspection.” The concern is not merely theoretical. Futures markets, even before the U.S. military struck Iranian nuclear and oil infrastructure, had priced in only 50 basis points of cuts through the entirety of 2026 — a signal that institutional investors simply do not believe Warsh can deliver the rate environment Trump envisions.
The Iran Shock and the Inflation Trap
This is where the geopolitical and the monetary collide with particular force. The U.S. attack on Iran — the energy shock reverberating through global commodity markets — has sent oil prices surging toward and beyond $100 a barrel. Inflation forecasts, which had been drifting downward through early 2026, are now trending back up. Remarkably, futures markets have begun pricing a non-trivial probability of a rate hike from the Federal Reserve before year’s end, not a cut.
Into this environment steps a nominee whose central economic argument — AI productivity as a disinflationary force — now must compete with the hard, immediate reality of petrol price pass-through, supply chain disruptions from Middle Eastern instability, and consumer expectations growing unmoored. The irony is almost Shakespearean: Trump nominated Warsh partly because he seemed willing to cut rates; now Warsh may be confirmed into a situation where the economically responsible course is to hold rates steady or tighten.
This is the fall-guy scenario, and it deserves to be named plainly. If Warsh takes the chair in May, inherits an economy facing renewed inflation from energy shocks, and then declines to cut rates aggressively — as economic prudence would likely demand — Trump will have a perfect target. The president who demanded 1 percent interest rates will face a Fed chair who is not delivering them. The chair will be blamed, publicly and loudly, for economic pain that originated in geopolitical decisions made in the White House’s own Situation Room.
Warsh will not be the first economist to occupy that chair under those circumstances. He would, however, be the first to have sought it in the full knowledge of the trap being laid.
The Structural Agenda: Balance Sheet, Regime Change, and the “Family Fight” Model
Strip away the rate-cut politics and what remains is genuinely interesting. Warsh envisions a Fed that is leaner, less communicative in public, and more disciplined in its market interventions. His critique of forward guidance — the practice of telegraphing future policy moves to markets in granular detail — is substantive: he argues it has made the Fed a prisoner of its own communications, forced to delay necessary adjustments because it has over-committed in its messaging.
In a 2023 interview, Warsh outlined what he calls the “family fight” model of policymaking: robust, unconstrained debate behind closed doors, followed by institutional unity in public. This represents a deliberate departure from the era of dissent-as-performance, where individual FOMC members have used public speeches to pre-negotiate policy in the open, fragmenting the institution’s voice and market credibility simultaneously.
The balance-sheet agenda is where Warsh’s structural convictions are most consequential for global markets. He has argued consistently that the Fed’s multi-trillion-dollar holdings of Treasuries and mortgage-backed securities represent a distortion of capital markets — one that has, paradoxically, suppressed long-term yields while subsidizing federal borrowing and inflating asset prices. A Warsh-led Fed pursuing aggressive quantitative tightening would push long-term rates higher even as short-term rates are cut, a “hawkish dove” configuration that has almost no historical precedent. The closest analogy is perhaps the late 1990s Greenspan era, when exceptional productivity growth (from the early internet buildout) allowed the economy to absorb tighter financial conditions without triggering recession. Warsh is betting the AI moment is analogous. It may be. It may not be.
The Independence Question: Does He Mean It?
The central question hanging over the April 21 hearing is one no senator will frame quite so bluntly but every analyst is asking: will Kevin Warsh be functionally independent from the president who appointed him?
The legal and institutional architecture of Fed independence is formidable. The Treasury-Fed Accord of 1951 enshrined it. Decades of practice have reinforced it. Markets price in a substantial “independence premium” — the expectation that the Fed will respond to economic data rather than political instruction. Any erosion of that premium would trigger a dollar selloff, a spike in Treasury yields, and a rapid repricing of sovereign risk that would transmit across emerging-market currencies from the Turkish lira to the Indonesian rupiah.
Warsh has said, repeatedly, that independence is “crucial” to the Fed’s function. But he has also argued, in language that pleased the White House, that independence does not preclude immediate rate cuts and that the Fed has, under Powell, overstepped into policy territory beyond its mandate — from climate risk to social equity. These are arguments that conveniently align with the administration’s preferences while being framed in the language of institutional restraint.
The CFR’s Roger Ferguson put it sharply: financial markets will react decisively to any sign that the Fed is abandoning its data-driven approach. The OMFIF was blunter still, noting that “presumably ex-hawk Warsh is capable of reading Truth Social and got the memo” on rate cuts. That observation is as concise a summary of the confirmation’s underlying tension as any I have encountered.
The risk is not necessarily that Warsh will be a crude supplicant. It is subtler. A chair who believes, genuinely and in good faith, that AI productivity justifies rate cuts will, in the near term, produce outcomes indistinguishable from a chair who is simply following orders. The divergence comes later — when inflation data turns inconvenient, when the oil shock bites harder, when the data demands a hold or a hike. It is at that moment that the question of independence becomes existential, not theoretical.
Global Stakes: What the Rest of the World Is Watching
The Federal Reserve’s decisions reverberate well beyond American borders, and the world’s central bankers are watching tomorrow’s hearing with unusual intensity.
In the eurozone, the ECB faces its own dilemma: a weakening growth outlook and a dollar that has been volatile against the euro as Warsh’s confirmation odds have fluctuated. A hawkish balance-sheet Warsh who nonetheless cuts short-term rates creates a peculiar dollar trajectory — weaker in short-term interest rate differential terms, but stronger in longer-term credibility terms. European policymakers cannot easily model that divergence.
In Asia, the picture is more acute. Japan’s Bank of Japan has been edging toward policy normalisation after decades of ultra-loose settings; a Fed that moves erratically based on political pressure would complicate Tokyo’s ability to anchor yen expectations. South Korea and Taiwan, with their deep integration into U.S. semiconductor supply chains and their extreme sensitivity to U.S. monetary conditions, are watching rate expectations with the attention of nervous creditors.
For emerging markets, the stakes are existential in the literal financial sense. Dollar-denominated debt in countries from Ghana to Sri Lanka to Pakistan has been refinanced on the assumption of gradual Fed normalisation. A Warsh Fed that delivers abrupt policy swings — cutting aggressively and then reversing under inflation pressure — would produce the kind of dollar volatility that has historically triggered emerging-market crises. The 1994 “taper tantrum” and the 2013 episode are still institutional memories in finance ministries from Nairobi to Jakarta.
Key Risks at a Glance
Senate confirmation hurdles: Senator Tillis’s blocking posture remains the most immediate obstacle. The DOJ investigation into Powell must conclude, or a political arrangement must be reached, before Warsh can reach the full Senate floor.
Oil-shock inflation trap: With Brent crude approaching $100 and Iran-related supply disruptions ongoing, the economic environment may simply not permit the rate cuts Trump is demanding — placing Warsh between political expectations and empirical reality from day one.
FOMC internal dynamics: Warsh would inherit a committee populated with economists who are skeptical of his AI-productivity thesis and committed to data-dependence. Herding that committee toward his preferred regime without triggering public dissent will test the “family fight” model immediately.
Markets pricing a rate hike: Futures markets pricing a 35–40% probability of a rate hike by December represent the starkest possible rebuke of the political narrative that Warsh was nominated to validate. Markets are telling the White House, as politely as they can manage, that the data does not cooperate with the political preference.
Conflict-of-interest scrutiny: The partially opaque Juggernaut Fund holdings, the Druckenmiller family office advisory relationship, and the Estée Lauder board connections of his wife will all face rigorous Democratic interrogation. The Fed has been plagued by ethics controversies under Powell; a fresh scandal in the opening months of Warsh’s tenure would be institutionally devastating.
The Fall Guy Thesis, and the Alternative
Let me be direct, as this column has always endeavoured to be: there is a real and non-trivial probability that Kevin Warsh is walking into a trap of historical proportions. A president who demands 1 percent rates in an economy facing energy-driven inflation is setting his Fed chair up to fail publicly. When Warsh — if he is as serious about his own intellectual framework as he claims — resists that pressure, the blame will flow downward, not upward. The president who manufactured the demand will not absorb the political cost of the unfulfilled promise. The chair who refused to deliver it will.
This is the “fall guy” scenario, and it is not a fringe interpretation. It is a structural feature of the relationship Trump has publicly constructed with his own nominee.
But there is an alternative reading that deserves equal weight. If the AI productivity thesis is substantially correct — if 2026 and 2027 see measurable gains in total factor productivity driven by AI deployment across the economy — then Warsh’s framework may prove prescient rather than convenient. A Fed chair who both cuts short-term rates and shrinks the balance sheet, who liberalises bank regulation without abandoning prudential oversight, and who restores internal deliberative discipline to the FOMC, could be a genuinely transformative figure. Not because he served the president’s preferences, but because the president’s preferences happened to align, in this narrow window, with what the economy actually needed.
History will record which of these two Warshes materialises. The April 21 hearing is unlikely to settle the question definitively — confirmation hearings rarely do. But watch carefully for one thing in his testimony: how he responds when senators ask whether he would resist political pressure to cut rates if inflation were rising. The specificity or vagueness of that answer will tell you everything about which of these men we are actually welcoming into the most powerful monetary policy chair on earth.
What Warsh Should Do — and What He Probably Won’t
Let me close with a prescription, because economists who decline to prescribe are merely commentators in academic disguise.
Warsh should use his confirmation hearing tomorrow to make one unambiguous commitment: that the Federal Reserve’s policy decisions will be driven solely by its dual mandate data and its long-run inflation credibility, and that no future communication from the White House will be treated as a policy input. He should announce that he will not pre-brief the administration on rate decisions, will not discuss upcoming FOMC votes with Treasury officials, and will not use social media interactions with the president as evidence of economic consensus.
He should then build a policy framework genuinely anchored in the AI-productivity thesis — not as a convenient justification for cuts the president wants, but as a seriously evidenced analytical position subject to revision when contradicted by data. If oil shocks persist and inflation rises, he must say clearly and publicly that cuts are off the table. If AI productivity materialises as forecast, the cuts will follow naturally from the data.
This path is the one that preserves institutional credibility, serves the long-run interest of American households and businesses, and — not incidentally — protects Warsh himself from becoming history’s footnote as the chair who let the Fed’s independence die quietly under the cover of a productivity boom that never fully arrived.
Whether he takes it depends entirely on the quality of his own convictions. Tomorrow morning, the markets will begin to find out.
Discover more from The Economy
Subscribe to get the latest posts sent to your email.
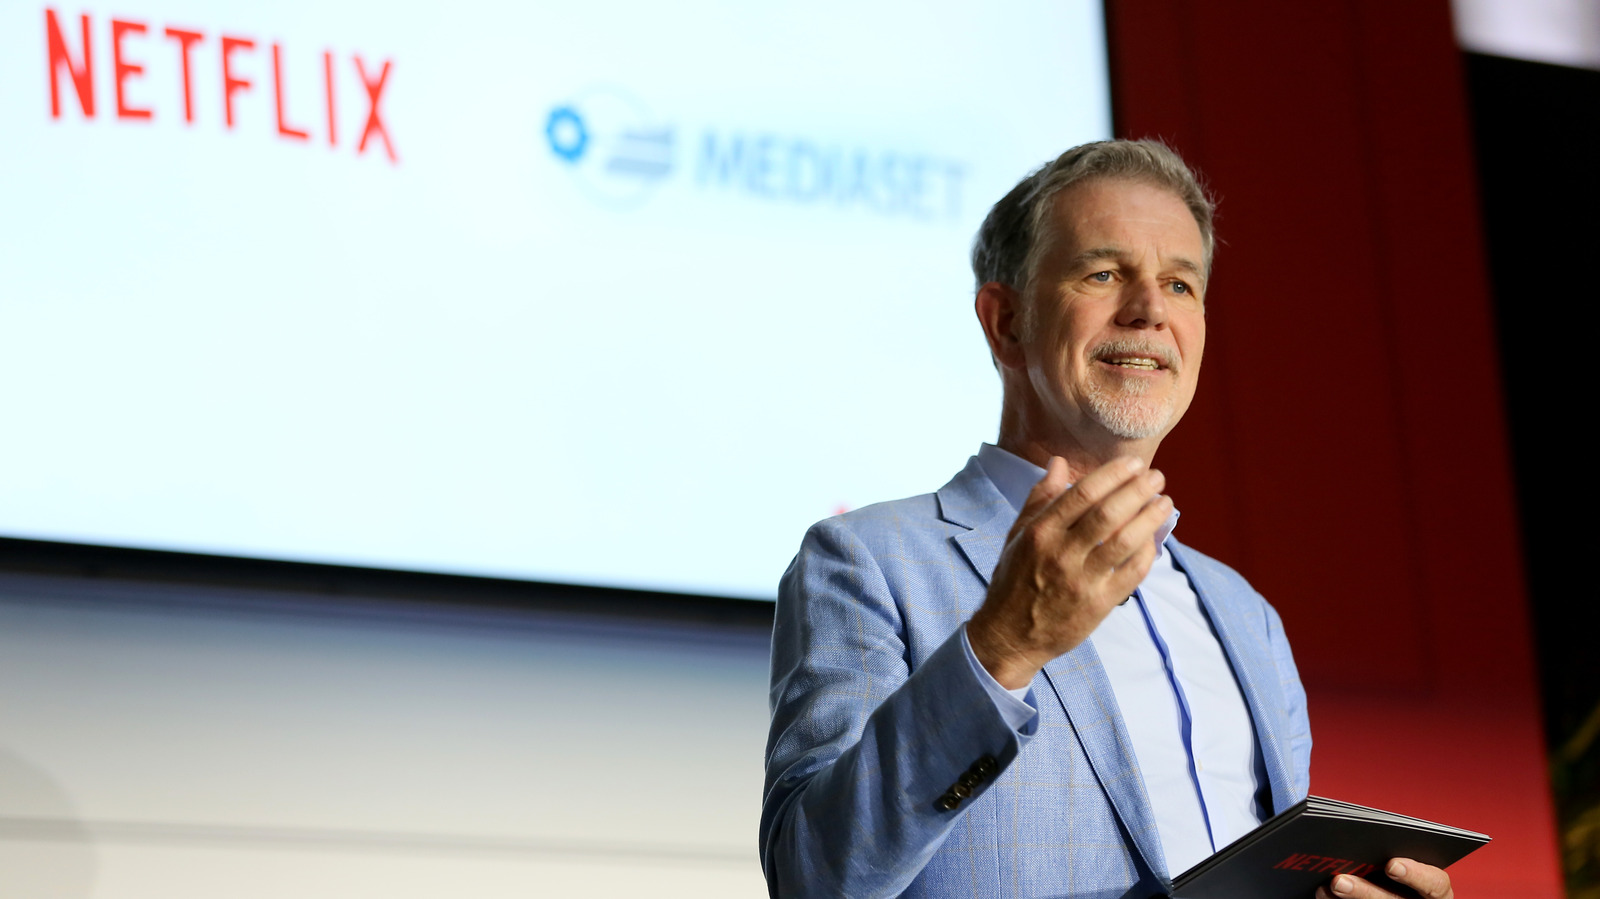
There is a particular kind of departure that announces itself not with a bang but with a line buried inside a quarterly earnings letter — neat, unassuming, and quietly seismic. On April 16, 2026, Netflix slipped exactly such a line into its first-quarter shareholder report: Reed Hastings, co-founder, former chief executive, and current board chairman, would not stand for re-election at the June annual meeting. After 29 years, the last founder’s hand on the tiller is finally coming free. The Reed Hastings steps down Netflix board story has been written in a hundred ways in the hours since, but almost none of them ask the harder question: not what this means for Netflix today, but what it reveals about the peculiar alchemy that built the most consequential entertainment company of the 21st century — and whether that alchemy can be bottled without the chemist.
Key Takeaways
- Hastings formally notified Netflix on April 10, 2026; he will depart at the June annual meeting after 29 years.
- The departure was disclosed alongside Q1 2026 earnings: revenue $12.25B (+16% YoY), EPS $1.23 — both beating consensus.
- Stock fell ~9% after-hours, driven primarily by soft Q2 guidance, not the leadership change itself.
- Netflix’s succession plan is multi-year, deliberate, and structurally robust under the Sarandos-Peters co-CEO model.
- Three risks to monitor: cultural drift without the founder, AI disruption of content economics, and geopolitical navigation in high-growth emerging markets.
- Hastings’ next act — Anthropic board, philanthropy, Powder Mountain — signals confidence in, not anxiety about, the company he leaves behind.
From Stamped Envelopes to Global Streaming Dominance
The timeline of Reed Hastings’ Netflix is worth reciting not as nostalgia, but as context for the scale of what is now changing hands. In 1997, Hastings and co-founder Marc Randolph conceived a company in the unglamorous gap between late fees and convenience. By 1999, Netflix had launched its subscription DVD-by-mail model — a marginal curiosity in a world of Blockbuster megastores and Hollywood’s iron grip on home video windows. When Netflix finally went public in 2002, almost nobody outside Silicon Valley was paying attention.
What happened next is the stuff of business school mythology. Netflix’s pivot to streaming in 2007 was not merely a product decision; it was a civilisational one. The company didn’t just change how people watched television — it changed what television was. It collapsed the distinction between film and episodic narrative, funded auteurs who couldn’t get a studio meeting, and, with House of Cards in 2013, proved that an algorithm-driven platform could not only predict taste but manufacture prestige. By January 2016 — Hastings’ own “all-time favourite memory,” he noted this week — Netflix was live in nearly every country on earth simultaneously. The company had, in a single night, become the first truly global television network.
Over the past 20 years, Netflix stock has generated a compound annual growth rate of 32%, producing total gains of approximately 99,841% for long-term shareholders — a figure that requires a moment of silence. For context, the S&P 500 returned roughly 460% in the same period. Hastings did not merely build a company; he compounded human attention on an industrial scale.
The Governance Architecture of a Graceful Exit
What makes the Netflix leadership transition 2026 so instructive is not the departure itself, but the architecture of its execution. Hastings has been engineering his own obsolescence with unusual intentionality since at least 2020. He elevated Ted Sarandos to co-CEO in July of that year, a move widely read at the time as a talent-retention play but which now reads as deliberate succession landscaping. In January 2023, he took a further step back, stepping down as co-CEO and anointing Greg Peters — then the company’s chief operating officer — as Sarandos’s co-equal partner, while himself assuming the role of executive chairman.
According to an SEC Form 8-K filed by Netflix, Hastings formally informed the company on April 10, 2026 of his decision not to stand for re-election as a director at the 2026 annual meeting of stockholders, and the filing explicitly states his decision was not the result of any disagreement with the company. In the world of corporate governance, that boilerplate language is often a fig leaf. Here, the broader evidence suggests it is genuinely true.
During the Q1 2026 earnings call, the last analyst question — posed by Rich Greenfield of LightShed Partners — probed the obvious rumour: had Netflix’s failed bid to acquire Warner Bros. Discovery assets, and Hastings’ reported preference for organic growth over acquisition, driven a wedge between founder and management? Sarandos was unequivocal: “Sorry for anyone who was looking for some palace intrigue here — not so. Reed was a big champion for that deal. He championed it with the board. The board unanimously supported the deal.” Netflix had walked away from Warner Bros. not because of internal conflict, but because Paramount Skydance outbid them — and Netflix wisely drew the line. Netflix received a $2.8 billion breakup fee from Warner Bros. Discovery after withdrawing from the bidding contest. Hastings’ departure, it seems, is genuinely what it claims to be: the clean, unhurried conclusion of a plan conceived long ago.
What the Market’s Reaction Actually Tells Us
Netflix stock fell approximately 8% in after-hours trading on April 16, even as the company reported Q1 revenue of $12.25 billion — up 16% year-over-year — and adjusted earnings per share of $1.23, well above the consensus estimate of $0.76. Analysts and headlines rushed to assign the selloff to the Netflix board changes Hastings announcement. The truth is messier and more instructive.
The real culprit was softer-than-expected guidance: Q2 revenue forecast of $12.57 billion fell below Wall Street’s $12.64 billion estimate, while earnings per share guidance of $0.78 missed the $0.84 expected, and the operating income outlook of $4.11 billion came in well below the $4.34 billion the Street had anticipated. Bloomberg Intelligence senior media analyst Geetha Ranganathan noted that the guidance miss did little to assuage investor concerns about growth momentum, a sentiment compounded by the fact that Netflix shares had already risen 15% year-to-date before Thursday’s report — leaving little cushion for disappointment.
This dynamic — a founder departure landing atop a guidance miss — is a particular kind of market stress test. It forces investors to disaggregate genuine structural concern from sentiment-driven noise. The answer, in this case, is mostly noise. Netflix’s underlying trajectory remains enviable: the ad-supported tier represented 60% of all Q1 signups in countries where the company offers advertising, and Netflix said it remains on track to double its advertising revenue to $3 billion in 2026, up from $1.5 billion in 2025, with advertising clients up 70% year-over-year to more than 4,000. A company executing that kind of commercial transformation does not need its founder’s continued presence to validate the thesis.
The Strategic Implications: Three Fault Lines to Watch
The what Reed Hastings departure means for Netflix question has generated predictably shallow commentary. Here is a more honest mapping of the fault lines that actually matter.
The Culture Carrier Problem
Hastings was not primarily a financial engineer. He was, above all, a culture architect — the author of the Netflix Culture Memo, a document so influential that Sheryl Sandberg once called it “the most important document ever to come out of Silicon Valley.” Its precepts — radical transparency, freedom with responsibility, no “brilliant jerks” — are not policies that survive their author automatically. They must be performed by leadership, daily and visibly, to remain operational. Sarandos has been performing them alongside Hastings for more than two decades; Peters for over a decade. But there is a meaningful difference between internalising a culture and constituting it. Without Hastings present — even in the background, even as a non-executive reference point — the risk of cultural drift is real. Not imminent, but real.
The AI Reckoning
In a recent interview, Hastings himself identified what he believes is Netflix’s biggest existential risk: the threat of AI-generated video transforming content creation in ways the company cannot control. This is not a paranoid concern. The economics of content production are structurally threatened by generative AI in ways that could compress Netflix’s most durable competitive advantage — exclusive, high-production-value, globally distributed storytelling — into something more easily replicated. The company’s response to this challenge will be the defining strategic question of the next decade. Hastings leaves at precisely the moment that challenge is becoming acute, and his absence removes the kind of contrarian, first-principles thinking that originally enabled Netflix to see around corners its competitors could not.
The Succession That Has Already Happened
Here is the structurally optimistic read, and it deserves equal weight: unlike the chaotic founder-exits at Twitter, WeWork, Uber, or early-period Apple, Netflix’s Netflix succession planning has been a multi-year, deliberate, and remarkably un-dramatic process. Sarandos noted on the earnings call that Hastings, as far back as the company’s founding days, was already talking about building “a company that would be around long after him,” and that succession planning was baked into the organisation’s DNA from its earliest stages. The co-CEO structure — unusual in corporate America, but increasingly recognised as effective for companies that must balance creative and operational excellence simultaneously — has been tested under real conditions: a pandemic, a catastrophic subscriber loss in 2022, a Wall Street rout, a failed M&A campaign, and a successful strategic pivot to advertising. Sarandos and Peters have governed capably through all of it.
On the earnings call, Sarandos described Hastings as “a singular source of inspiration, personally and professionally,” and said he and Peters had the privilege of working for “a true history maker.” Peters added that Hastings “will always be Netflix’s founder and biggest champion — he is a part of our DNA.” This is the language of inheritance, not of rupture.
The Global Stakes of a Streaming Power Shift
International readers should not underestimate how much of the streaming industry power shift now in motion runs through this moment. Netflix operates in over 190 countries. Its annual content spend rivals the GDP of small nations. Its pricing decisions — the company raised its Standard ad-free plan to $19.99 per month and its Premium tier to $26.99 per month earlier this year — ripple through household budgets from Karachi to Kansas City.
The transition away from founder governance also matters for how Netflix navigates increasingly fraught geopolitical terrain. India, Southeast Asia, and Sub-Saharan Africa remain the company’s highest-growth opportunity corridors, and each requires a kind of nimble, relationship-driven market entry that benefits from an executive chairman’s imprimatur. Hastings, who was personally involved in many of those early market pushes, leaves a vacuum in that domain that is less easily filled by institutional structure than by individual authority.
Meanwhile, the competitive landscape has shifted dramatically from the streaming wars of 2019–2022. The consolidation that was expected — and partially delivered — has produced a duopoly structure at the top of premium streaming: Netflix on one side, with Disney+ and Max competing for second position. Apple TV+ remains a boutique anomaly. Amazon Prime Video is a bundle play. The insurgent aggression that once threatened Netflix has largely dissipated. What remains is a grind for engagement share and advertising dollars — and in that grind, Netflix currently holds most of the strongest cards.
Forward Look: Hastings’ Legacy and the Next Chapter
The Hastings legacy Netflix is not in doubt. It will be taught in business schools for a generation, and rightly so. But the more interesting question is what Hastings will do next, and what it signals about where he believes the action is.
Since leaving the CEO role in 2023, Hastings has accepted a board seat at leading AI firm Anthropic, purchased the Powder Mountain ski resort in Utah, and deepened his involvement in educational philanthropy through organisations including KIPP, City Fund, and the Charter School Growth Fund. The Anthropic board seat, in particular, is worth dwelling on. Hastings, who spent 29 years disrupting incumbent entertainment, is now a governance voice at the company most directly challenging the foundations of knowledge work and creative production. If he believes AI-generated content is the existential risk for Netflix, his choice of next chapter suggests he intends to be on the other side of that disruption — shaping it rather than absorbing it.
That, in itself, is a kind of institutional vote of confidence in the team he leaves behind. A founder who feared his company could not manage without him would not make such a decisive break. Hastings is not hedging. He is exiting cleanly because he believes the machine is running. The future of Netflix after Hastings, in his own implicit judgment, is not a crisis. It is an execution challenge. And execution, it turns out, is what Sarandos and Peters have been hired — and tested — to deliver.
The Art of Knowing When to Leave
There is a moment in almost every great company’s life when the founder’s continued presence stops being an asset and starts being a constraint — not because they have become less brilliant, but because institutions need room to grow beyond their origins. The great founders are those who can feel that moment approaching and act before it arrives. Watson at IBM could not. Jobs at Apple, the second time, could — barely, and only because illness forced his hand. Bezos stepped back from Amazon at a moment of his choosing. Hastings has now done the same at Netflix, and done it more cleanly than almost any comparable figure in modern corporate history.
His farewell statement, included in the Q1 shareholder letter, was characteristically precise and unflashy: “My real contribution at Netflix wasn’t a single decision; it was a focus on member joy, building a culture that others could inherit and improve, and building a company that could be both beloved by members and wildly successful for generations to come.” That sentence is the whole thesis. The mark of a truly great builder is not the product they ship on a given day; it is the institution they leave behind that goes on shipping without them.
Reed Hastings has, by that measure, succeeded. The question now belongs to Greg Peters, Ted Sarandos, and the 280 million households worldwide that have made Netflix part of the fabric of their evenings. Whether they prove the founder’s faith justified is the next act of a story he began writing in 1997 — and which, for the first time, he will watch from the audience.
Discover more from The Economy
Subscribe to get the latest posts sent to your email.
-

 Markets & Finance4 months ago
Top 15 Stocks for Investment in 2026 in PSX: Your Complete Guide to Pakistan’s Best Investment Opportunities
-

 Analysis2 months ago
Brazil’s Rare Earth Race: US, EU, and China Compete for Critical Minerals as Tensions Rise
-

 Analysis2 months ago
Top 10 Stocks for Investment in PSX for Quick Returns in 2026
-

 Banks3 months ago
Best Investments in Pakistan 2026: Top 10 Low-Price Shares and Long-Term Picks for the PSX
-

 Investment3 months ago
Top 10 Mutual Fund Managers in Pakistan for Investment in 2026: A Comprehensive Guide for Optimal Returns
-

 Global Economy4 months ago
Pakistan’s Export Goldmine: 10 Game-Changing Markets Where Pakistani Businesses Are Winning Big in 2025
-

 Global Economy4 months ago
15 Most Lucrative Sectors for Investment in Pakistan: A 2025 Data-Driven Analysis
-

 Asia4 months ago
China’s 50% Domestic Equipment Rule: The Semiconductor Mandate Reshaping Global Tech