
Geopolitics
China’s Belt and Road Roars Back: A Record $213 Billion Surge in 2025 and What It Means for the World
As Western infrastructure promises stall, Beijing’s flagship initiative delivers its strongest year yet—fueling a dramatic global realignment
On a sweltering afternoon in Port Harcourt, Nigeria, construction crews break ground on what will become one of Africa’s largest liquefied natural gas facilities. In the snow-dusted steppes of Kazakhstan, Chinese engineers finalize contracts for a sprawling wind farm complex. Thousands of miles away in the Democratic Republic of Congo, surveyors map terrain for copper mining operations that will feed the world’s electric vehicle revolution. These disparate projects share a common thread: they represent fragments of the most ambitious infrastructure undertaking in modern history, one that in 2025 achieved a resurgence few observers predicted.
China’s Belt and Road Initiative recorded $213.5 billion in new deals during 2025, according to the Griffith Asia Institute’s comprehensive annual report released in January 2026. This staggering figure—comprising $128.4 billion in construction contracts and $85.2 billion in direct investments—represents a 75% surge from 2024 and marks the Belt and Road’s strongest performance since Beijing launched the initiative in 2013. The cumulative total now stands at $1.399 trillion across more than 150 countries, cementing the BRI as the defining infrastructure project of the 21st century.
But raw numbers tell only part of the story. Beneath this remarkable resurgence lies a complex narrative of geopolitical repositioning, environmental contradictions, and shifting global power dynamics that will shape international relations for decades to come.
The Numbers Behind the Comeback
To understand the magnitude of 2025’s acceleration, context is essential. The Belt and Road Initiative 2025 performance represents a dramatic reversal from recent years of stagnation and retrenchment. Following peak activity in the late 2010s, Chinese overseas infrastructure engagement contracted sharply during the pandemic years, dropping below $80 billion annually as Beijing confronted domestic economic headwinds and mounting international skepticism about debt sustainability.
The turnaround began cautiously in 2024 before exploding into 2025’s record-breaking figures. Christoph Nedopil Wang, director of the Griffith Asia Institute’s Green Finance & Development Center and author of the definitive BRI tracking report, describes the shift as “the most significant single-year expansion in the initiative’s history—one that fundamentally alters calculations about China’s global economic footprint.”
Year-over-Year BRI Engagement Comparison:
| Year | Total Engagement | Construction Contracts | Direct Investment | % Change |
|---|---|---|---|---|
| 2023 | $75.9 billion | $48.2 billion | $27.7 billion | -8% |
| 2024 | $122.1 billion | $76.8 billion | $45.3 billion | +61% |
| 2025 | $213.5 billion | $128.4 billion | $85.2 billion | +75% |
This acceleration occurred despite—or perhaps because of—intensifying geopolitical tensions, persistent Western skepticism, and domestic Chinese economic challenges including property sector troubles and deflationary pressures. The paradox raises fundamental questions: What drove this remarkable surge? And what does it signal about the global economic order’s evolution?
The Energy Paradox: Greenest and Dirtiest Year
Perhaps no aspect of China’s Belt and Road investments surge 2025 embodies contemporary contradictions more vividly than the energy sector’s composition. This was simultaneously the initiative’s “greenest” and “dirtiest” year—a paradox reflecting both China’s genuine renewable energy ambitions and its pragmatic resource security imperatives.
Energy transactions dominated the year’s activity, commanding $93.9 billion or 44% of total engagement. Within this massive portfolio lies a striking duality: renewable energy projects reached unprecedented heights while fossil fuel investments surged to levels unseen since the Paris Agreement era.
On the green ledger, solar and wind projects captured $31.2 billion in new commitments—triple the 2024 figure. China’s dominant position in renewable technology manufacturing allowed it to export turnkey solutions at prices Western competitors cannot match. The Zhambyl Wind Energy Complex in Kazakhstan, contracted at $4.8 billion, will generate 3,000 megawatts when completed in 2028, making it Central Asia’s largest renewable installation. In Egypt, Chinese firms secured contracts for solar parks totaling 6,500 megawatts across three desert sites.
Yet fossil fuels claimed an even larger share. Natural gas infrastructure absorbed $42.7 billion, led by Nigeria’s Brass LNG Project ($12 billion) and expansion of Mozambique’s offshore gas facilities ($8.3 billion). Coal-fired power plants—supposedly phased out under China’s 2021 pledge to cease overseas coal financing—found backdoor continuation through “already committed” projects and loopholes for facilities incorporating carbon capture technology. The Financial Times noted that Beijing “pours cash into Belt and Road financing in global resources grab,” highlighting how climate pledges bend when energy security concerns intensify.
This contradiction reflects pragmatic calculation rather than hypocrisy. Chinese policymakers view energy security as existential, particularly as Western sanctions regimes demonstrate how resource dependencies create vulnerabilities. Partner nations share this calculus: for countries like Pakistan, Bangladesh, and Indonesia, immediate electrification needs trump long-term climate considerations. Western offers of renewable-only infrastructure financing often arrive with conditions these nations find onerous or delayed by bureaucratic processes BRI streamlines.
“China offers what developing nations actually want, not what Western development agencies think they should want,” observes Dr. Sarah Chen, senior fellow at the Council on Foreign Relations. “That distinction explains much of BRI’s competitive advantage.”
Metals, Mining, and the Battery Arms Race
The second-largest sectoral surge occurred in metals and mining, which captured $32.6 billion in 2025—a near-quadrupling from 2024’s $8.7 billion. This explosion directly correlates with global electric vehicle production scaling and renewable energy infrastructure deployment, both requiring vast quantities of copper, lithium, cobalt, and rare earth elements.
The Democratic Republic of Congo emerged as the epicenter of BRI mining expansion, with Chinese firms securing or expanding operations across fourteen separate projects worth a combined $11.4 billion. The most significant, the Kamoa-Kakula Copper Complex expansion, will more than double output at what’s already the world’s second-largest copper mine. Separately, lithium extraction operations in Chile’s Atacama Desert and Argentina’s Lithium Triangle secured $6.2 billion in Chinese financing and technical partnership agreements.
These investments serve dual purposes. Commercially, they position Chinese firms at chokepoints in supply chains for technologies dominating the 21st-century economy. Geopolitically, they reduce dependence on Western-controlled commodity trading networks while cultivating influence in resource-rich nations courted by multiple great powers.
The strategy shows sophistication absent from earlier BRI phases. Rather than merely financing extraction, Chinese firms increasingly pursue integrated value chains—from mining through processing to component manufacturing. In Indonesia, a $3.8 billion nickel processing complex will produce battery-grade materials rather than exporting raw ore, creating local employment while ensuring Chinese EV manufacturers secure stable supplies.
Critics note environmental and labor concerns accompanying this mining boom. Independent monitors report inadequate environmental impact assessments, insufficient community consultation, and exploitative labor practices at some sites. Yet defenders counter that Chinese-backed operations increasingly meet international standards and compare favorably to Western mining firms’ historical records in the same regions.
Africa and Central Asia: The New Frontiers
Geographic reorientation constitutes the third defining feature of Belt and Road’s 2025 resurgence. While Southeast Asia remains important, the initiative dramatically pivoted toward Africa (up 283% to $67.8 billion) and Central Asia (up 156% to $31.4 billion).
Africa’s Transformative Moment
The China BRI record deals 2025 in Africa span infrastructure categories from ports to power grids, railways to refineries. Beyond sheer dollar figures, the qualitative shift matters: China increasingly finances transformative mega-projects rather than scattered smaller initiatives.
Top Five African BRI Projects in 2025:
- Nigeria Brass LNG Complex – $12.0 billion (energy)
- Republic of Congo Pointe-Noire Port Expansion – $6.8 billion (maritime infrastructure)
- DRC Kamoa-Kakula Copper Expansion – $5.7 billion (mining)
- Ethiopia Abay Grand Infrastructure Corridor – $4.9 billion (multi-modal transport)
- Tanzania Standard Gauge Railway Phase III – $3.8 billion (rail transport)
These projects reflect African nations’ infrastructure deficit—estimated at $100 billion annually by the African Development Bank—and Western development finance’s chronic inability to deliver at comparable scale and speed. While the United States’ Partnership for Global Infrastructure and Investment (PGII) announced with fanfare in 2022, has struggled to deploy even $10 billion of its promised $200 billion, China moves from commitment to groundbreaking in months rather than years.
The South China Morning Post reported that African leaders increasingly view BRI as the only viable mechanism for achieving infrastructure parity with developed regions. This perception, whether entirely accurate or not, shapes diplomatic alignments and voting patterns in multilateral forums where China seeks support on issues from Taiwan to trade rules.
Central Asia’s Strategic Significance
Central Asia’s 156% surge reflects both geography and geopolitics. These former Soviet republics occupy the literal heartland of Eurasia, controlling energy corridors, mineral deposits, and overland routes linking China to Europe and the Middle East.
Kazakhstan led regional engagement with $14.2 billion in new BRI contracts, headlined by the Zhambyl wind project but extending to oil pipeline upgrades, railway modernization, and industrial park development. Uzbekistan ($8.7 billion) and Turkmenistan ($4.3 billion) followed, with transactions heavy on gas infrastructure and textile manufacturing.
Russia’s invasion of Ukraine accelerated this pivot. Western sanctions severed many Central Asian republics’ traditional economic links through Russian territory, creating openings for Chinese alternatives. Transportation projects now explicitly route around Russian networks—the Trans-Caspian International Transport Route expansion ($2.1 billion in Chinese financing) creates a China-Central Asia-Caucasus-Europe corridor bypassing Russian railways entirely.
This geographic shift also serves domestic Chinese objectives. Xinjiang, China’s westernmost province and focal point of international human rights criticism, borders three Central Asian nations. BRI projects creating economic interdependence with neighbors potentially complicate Western pressure campaigns while absorbing output from Xinjiang’s industrial capacity.
Geopolitical Drivers: Resource Security in an Age of Fragmentation
Strip away the development rhetoric, and Belt and Road fundamentally represents China’s response to strategic vulnerabilities exposed by intensifying US-China competition. The 2025 surge occurred against backdrop of tightening Western export controls on semiconductors and other critical technologies, expanding AUKUS security cooperation, and increasingly explicit American efforts to limit Chinese economic influence.
Three overlapping security imperatives drive Beijing’s doubling down on BRI:
Supply Chain Resilience
The pandemic and subsequent geopolitical tensions demonstrated catastrophic vulnerabilities in globalized supply chains. Chinese policymakers concluded that resource security requires not just diversified suppliers but also controlled infrastructure connecting extraction sites to Chinese industry. BRI investments lock in access through ownership stakes, long-term contracts, and strategic infrastructure like ports and railways that Chinese firms operate.
The mining sector surge exemplifies this logic. With Western nations pursuing “friend-shoring” and “de-risking” strategies to reduce China dependencies, Beijing races to secure physical control over resources before such initiatives mature. The battery metals boom means Chinese firms must lock in cobalt, lithium, and rare earth supplies now or face potential exclusion later.
Diplomatic Leverage
Each billion dollars invested buys not just commodities or construction contracts but diplomatic capital. BRI partner nations frequently support Chinese positions in UN voting, remain neutral on Xinjiang and Hong Kong criticisms, and resist pressure to exclude Huawei from telecom networks. While crude “debt trap diplomacy” narratives oversimplify complex relationships, patterns of alignment are undeniable.
The Africa surge particularly matters for multilateral diplomacy. African nations comprise more than one-quarter of UN General Assembly votes and increasingly assert collective agency on global governance reforms where China seeks greater influence.
Counter-Hegemonic Infrastructure
More ambitiously, BRI aims to create alternative networks reducing global dependence on Western-dominated financial and logistical infrastructure. Chinese payment systems, satellite networks, telecommunications equipment, and standardized railway gauges gradually build parallel systems that function independently of American or European control.
This creates optionality for partner nations and complications for Western coercive diplomacy. When the United States or EU threaten sanctions, targeted nations increasingly can pivot to Chinese-backed alternatives—a dynamic fundamentally altering traditional Western leverage.
The Debt Question: Sustainability Versus Development
No discussion of Belt and Road reaches equilibrium without addressing debt sustainability—the initiative’s most persistent criticism. By late 2025, more than 60 countries owed China over $1.1 trillion in BRI-related debt, with several African and South Asian nations dedicating 15-25% of government revenues to Chinese loan servicing.
High-profile cases fuel debt trap narratives: Sri Lanka’s Hambantota Port lease, Zambia’s Chinese-held debt exceeding $6 billion, Pakistan’s chronic renegotiation requests. Research from organizations like the World Bank and AidData document numerous cases where BRI projects failed to generate promised returns, leaving recipients with white elephant infrastructure and crushing debt obligations.
Yet nuance matters. Recent academic research challenges simplistic debt trap framings, finding that Chinese creditors frequently renegotiate terms, accept delays, and restructure obligations rather than seizing collateral. The China Africa Research Initiative at Johns Hopkins documented 93 debt restructuring cases between 2000 and 2024, with Chinese lenders showing flexibility comparable to Paris Club creditors.
Moreover, the counterfactual matters: absent BRI financing, many recipient nations would simply lack infrastructure entirely. The Tanzania railway transporting copper from landlocked Zambia to ports generates measurable economic activity impossible without the initial debt-financed construction. Bangladesh’s Chinese-built power plants ended decades of crippling electricity shortages, enabling industrial growth that enhanced debt servicing capacity.
“The debt sustainability question is real but often posed dishonestly,” argues Dr. Deborah Brautigam, director of the China Africa Research Initiative. “Western critics ignore that multilateral development banks also saddle poor countries with debt, often with more stringent conditions and slower disbursement. The relevant question is whether projects generate sufficient development benefits to justify borrowing, not whether debt exists at all.”
The 2025 surge included modest improvements toward sustainability. Average interest rates declined to 4.2% from 5.7% in prior years. Concessional loan percentages increased slightly. More projects incorporated revenue-sharing arrangements rather than fixed repayment schedules. Whether these shifts represent genuine reform or cosmetic adjustments to deflect criticism remains debatable.
Western Alternatives: Promises Versus Performance
Understanding BRI’s resurgence requires examining the competitive landscape. Western democracies belatedly recognized infrastructure’s geopolitical significance, launching initiatives explicitly framed as BRI alternatives: the G7’s Build Back Better World (B3W) in 2021, rebranded as Partnership for Global Infrastructure and Investment (PGII) in 2022, the EU’s Global Gateway, and Japan’s Partnership for Quality Infrastructure.
These programs promised hundreds of billions in infrastructure financing emphasizing sustainability, transparency, and good governance. Three years later, delivery lags embarrassingly behind rhetoric. PGII’s $200 billion commitment over five years has deployed under $15 billion in actual projects. Global Gateway’s €300 billion pledge has yielded scattered small-scale initiatives rather than transformative mega-projects.
Multiple factors explain this gap. Western financing mechanisms involve multilateral coordination, environmental impact assessments, labor standards compliance, and procurement transparency that—while laudable—create bureaucratic obstacles Chinese state-owned enterprises bypass. Private sector participation requires bankable returns that many developing market projects cannot guarantee. Recipient nations face conditions on governance, transparency, and policy reform that BRI loans avoid.
The result: Western financing promises attract headlines while Chinese construction crews break ground. For African or Asian leaders seeking tangible infrastructure on electoral timelines, the choice becomes stark. BRI’s appeal lies less in Chinese superiority than Western ineffectiveness.
Some observers detect shifting Western approaches in response. Recent PGII announcements emphasize fewer conditions and faster deployment. Whether these adjustments can match BRI’s pace without sacrificing standards remains uncertain.
The Human Dimension: Winners, Losers, and Complexities
Beyond geopolitical abstractions and billion-dollar figures, Belt and Road manifests in human experiences across partner nations—experiences far more complex than either cheerleading or condemnation acknowledges.
In Kenya, Chinese-built Standard Gauge Railway reduced Mombasa-Nairobi transit time from twelve hours to four, slashing business costs and enabling small traders to access larger markets. Yet the same railway displaced thousands of families, many inadequately compensated, and employs primarily Chinese workers in skilled positions while reserving menial labor for locals.
In Pakistan’s Gwadar, Chinese investment created port infrastructure transforming a fishing village into a potential trading hub. Yet locals complain of marginalization as Chinese-developed enclaves restrict access and fishing grounds shrink to accommodate industrial development. Promised prosperity hasn’t materialized for many residents who now live in limbo between traditional livelihoods lost and modern employment opportunities not yet arrived.
In Central Asia, BRI highway construction connects remote communities to markets and services previously inaccessible. But the same roads facilitate resource extraction that enriches Chinese firms and local elites while providing little benefit to ordinary citizens beyond low-wage construction employment.
These complexities defy simplistic narratives. BRI simultaneously drives development and creates dependencies, generates employment and displaces communities, builds infrastructure and extracts resources. Partner nation governments bear responsibility for negotiating terms, ensuring environmental protections, and distributing benefits equitably—responsibilities many fail to discharge effectively.
Civil society organizations increasingly recognize this complexity, moving beyond blanket opposition toward demanding better project design, stronger safeguards, and more equitable benefit-sharing. Some Chinese institutions show responsiveness: debt restructuring, improved environmental standards, increased local employment targets. Whether this represents genuine learning or tactical adaptation to criticism remains contested.
Looking Forward: Trajectories and Transformations
As 2026 unfolds, several trends will shape Belt and Road’s evolution:
Sectoral Focus: Energy transition pressures and battery technology demands will sustain mining and renewable investments. Fossil fuel projects face increasing reputational costs, potentially moderating the 2025 surge even as energy security concerns persist. Technology infrastructure—5G networks, data centers, digital payment systems—will likely capture growing shares as China exports digital economy capabilities.
Regional Shifts: Africa and Central Asia will probably retain prominence, with possible expansion into Latin America if commodity prices remain elevated. Southeast Asia may see relatively slower growth as earlier BRI phases already developed much infrastructure. Middle Eastern petrostates flush with oil revenues present interesting opportunities, particularly around renewable energy and high-tech manufacturing.
Financial Innovation: Expect continued movement toward local currency financing, reducing dollar dependencies that create vulnerabilities for both China and partner nations. Yuan internationalization receives subtle but steady advancement through BRI transactions. Blended finance mechanisms combining Chinese state capital with private investment may increase as Beijing seeks to reduce fiscal exposure.
Governance Improvements: Whether from genuine commitment or diplomatic necessity, modest improvements in transparency, environmental standards, and labor practices will likely continue. Multilateral cooperation on debt restructuring through frameworks like the G20 Common Framework may increase as defaults multiply. These changes will remain incremental rather than transformative.
Geopolitical Competition: Western infrastructure initiatives will probably improve delivery but remain unlikely to match BRI’s scale. The competition shifts toward selective counterprogramming in strategic regions and technologies rather than comprehensive alternatives. Middle power nations like Japan, South Korea, and UAE pursue independent infrastructure diplomacy, fragmenting what was once clearer Western-Chinese dichotomy.
The most significant question involves sustainability—not just debt sustainability but BRI’s viability within China’s evolving domestic context. With economic growth slowing, property sector troubles persisting, and local government debt mounting, can Beijing sustain massive overseas infrastructure financing indefinitely?
Analysts divide on this question. Skeptics note that China’s domestic challenges necessitate capital retention rather than export. Defenders counter that BRI serves strategic interests justifying financial costs, particularly as domestic investment opportunities diminish in saturated infrastructure markets.
Conclusion: Recalibrating Global Order
China’s Belt and Road Initiative record $213 billion year represents far more than construction contracts and commodity deals. It signals a fundamental recalibration of global economic geography, one where developing nations increasingly turn to Beijing rather than Washington for infrastructure, investment, and development models.
This shift unfolds against broader patterns of fragmentation replacing the integrated globalization that characterized the post-Cold War era. Supply chains regionalize. Payment systems diverge. Technology standards multiply. Infrastructure networks realign along geopolitical rather than purely economic logic.
Whether this trajectory proves sustainable remains uncertain. China’s domestic economic headwinds could force retrenchment. Debt crises could trigger partner nation backlash. Western alternatives might eventually deliver on promises. Environmental and social criticisms could impose constraints Chinese policymakers cannot ignore.
Yet for now, the momentum runs decisively in BRI’s favor. While Western nations debate infrastructure financing mechanisms in Brussels and Washington conference rooms, Chinese firms pour concrete, string power lines, and lay rail tracks from Lagos to Lahore, Quito to Astana. Grand strategy manifests in tangible construction, development aspiration meets engineering capacity, and geopolitical influence accumulates one project at a time.
The global order that emerges from this infrastructure revolution will differ profoundly from what preceded it. Roads, railways, ports, and power grids built today will shape economic possibilities, political alignments, and strategic calculations for generations. Understanding Belt and Road’s 2025 resurgence means understanding the future being built, quite literally, right now.
For policymakers in Washington, Brussels, Tokyo, and New Delhi, the message is stark: competing effectively requires moving beyond rhetoric to deliver tangible alternatives at scale and speed. For leaders in Nairobi, Dhaka, and Jakarta, the challenge involves negotiating terms that advance development without mortgaging sovereignty. And for observers everywhere, the imperative is seeing Belt and Road clearly—neither as development panacea nor neo-colonial trap, but as complex reality reshaping our interconnected world.
The road ahead remains under construction, but its direction increasingly runs eastward.
Discover more from The Economy
Subscribe to get the latest posts sent to your email.


Most headlines on Russia’s economy in July 2026 focus on the latest sanctions package or oil price cap negotiation. The more important story is structural: the model Russia has used to fund its war for four years is showing real signs of running out of road.
The core finding
A research brief from the Center for Strategic and International Studies (CSIS) argues Putin is pushing Russia toward an “economic, political, and military abyss,” according to Fortune. While Russia’s economy remains large — roughly $2.6 trillion — growth is slowing and shrinking on a quarterly basis, with 2026 growth projected at just 0.4%, worse than 2025’s 1% growth, which itself narrowly avoided recession.
Analysts describe Russia’s approach as a form of “military Keynesianism” — the state investing heavily in militarizing the economy while extending financial support to households affected by the war. But per Fortune’s reporting, “after more than four years of war, that well is running dry.” Russia’s fiscal reserves are dwindling, and 71% of the country’s gold reserves have been liquidated to sustain spending.
The number that matters most: oil and gas budget share
The most underreported data point here: the share of oil and gas receipts in Russia’s federal budget revenue fell to just 23% in 2025 — the lowest share in two decades — according to the Oxford Institute for Energy Studies, cited by Fortune. To compensate, Russia has turned to expansive taxation, including raising VAT from 20% to 22% — a move that has proven unpopular domestically.
This matters because Russia’s economy has historically been described, correctly, as fossil-fuel dependent — with oil and gas taxation making up 44% of federal revenues in the decade before the Ukraine invasion, and still around 24.5% over the first three quarters of 2025, according to a Brookings Institution analysis. A further slide to 23% signals the sanctions and diversification pressure are compounding, even as Russia continues finding workarounds through its “shadow fleet.”
The Iran-war reprieve was temporary — and it’s over
The Iran war offered Russia a brief lifeline: Brent crude surged more than 55% at its peak, nearing $120 a barrel, after President Trump eased some sanctions on Russian oil, per Fortune. But that chaos also undermined Russia’s own long-term energy and infrastructure projects in the Middle East — two Russian-linked power plants in Iran were put on hold, along with oil and gas exploration and plans to link Russia to India via Iran through new transit routes. Since then, oil prices have normalized as demand softened and the Strait of Hormuz reopened, removing that temporary cushion.
The sanctions escalation now in motion
The pressure is intensifying on multiple fronts simultaneously. US senators unveiled a sweeping bipartisan Russia sanctions bill in mid-July, which would impose mandatory sanctions on Russian political and military leaders including President Putin, and up to a 100% tariff on the top five countries — including China and India — that purchase Russian crude oil and natural gas, according to CNN. Separately, the EU has been racing to avoid an automatic upward revision of its Russian oil price cap, which would otherwise jump from $44.10 to roughly $58 per barrel if a new sanctions package wasn’t agreed by July 15, per Euronews.
Analysis from the Center for European Policy Analysis notes the outcome depends heavily on whether India and China accept the risk of secondary sanctions: “If China stands firm, Moscow’s dependence on Beijing deepens,” per CEPA. If Russian seaborne oil exports were to fall to near-zero, the budget would lose roughly a quarter of its revenue — an extreme but non-trivial scenario given the pace of legislative and diplomatic pressure building in July 2026.
Why this matters beyond Russia
For countries positioned between Western sanctions regimes and continued Russian energy purchases — including India, and by extension trade partners like Pakistan whose remittance and trade flows intersect with Gulf and South Asian energy markets — the trajectory of Russia’s budget dependency and the secondary-sanctions risk attached to its buyers is a live variable, not a settled one. A further deterioration in Russia’s oil-and-gas revenue share would likely accelerate Moscow’s reliance on China specifically, reshaping regional energy-trade alignments well beyond the Russia-Ukraine conflict itself.
FAQ
What percentage of Russia’s federal budget comes from oil and gas? 23% in 2025 — the lowest share in two decades, according to the Oxford Institute for Energy Studies.
What is Russia’s projected GDP growth for 2026? 0.4%, according to CSIS research cited by Fortune — down from 1% growth in 2025.
What is “military Keynesianism” in the context of Russia’s economy? A term analysts use to describe Russia’s strategy of heavy state investment in militarizing the economy alongside financial support for war-affected households, functioning as a form of stimulus that is now showing signs of fiscal strain.
Discover more from The Economy
Subscribe to get the latest posts sent to your email.

Russia‘s two largest, US-sanctioned oil producers have clawed back control of the majority of the country’s crude export trade, restoring their combined share to 57% in the first half of May 2026 after a sharp decline earlier in the year — a recovery that underscores the limits of Western sanctions enforcement even as the Middle East conflict reshapes global energy flows in Moscow’s favor.
According to the Kyiv School of Economics Institute‘s Russian Oil Tracker, sanctioned producers Rosneft, Lukoil, Gazpromneft, and Surgutneftegaz had seen their combined export share collapse to just 4-8% in the January-to-March period, only to rebound sharply as sanctioned “shadow fleet” tankers and previously idle vessels returned to commercial service, according to KSE Institute’s May 2026 tracker. The reversal illustrates a pattern that has recurred throughout the sanctions era: enforcement gaps open, capital and logistics networks adapt, and market share flows back toward sanctioned entities within a matter of months.
The Shadow Fleet’s Growing Dominance
The scale of Russia’s reliance on unconventional shipping infrastructure has reached a new high. KSE Institute estimates that 192 shadow fleet tankers carrying crude and refined products left Russian ports or engaged in ship-to-ship transfers in April 2026 alone, with 92% of those vessels older than 15 years — aging tonnage increasingly steered toward sanctions-evasion routes as newer, compliant vessels avoid the reputational and insurance risk of handling Russian crude.
The share of Russian seaborne oil transported by explicitly sanctioned tankers rose from 15% in July 2025 to 31% by April 2026, according to KSE data, while the corresponding share carried specifically by US-designated vessels reached 26% over the same window — driven, according to the tracker, by previously idle tankers returning to active commercial rotation. As of May 21, six major sanctioning jurisdictions — the US, UK, EU, Australia, Canada, and New Zealand — had jointly designated 651 unique oil tankers, yet the fleet supporting Russian exports has continued to expand around those designations rather than shrink beneath them.
Separately, monthly analysis from the Centre for Research on Energy and Clean Air (CREA) found that in April 2026, over half — 54% — of Russia’s seaborne oil moved via sanctioned shadow tankers, up sharply from 48% in March, with sanctioned vessels responsible for the highest share of Russian fossil fuel exports on record, according to CREA’s April 2026 monthly tracker.
Revenue Keeps Climbing Despite the Sanctions Architecture
The financial consequence of this logistics resilience is a fossil fuel export revenue stream that has continued growing even as enforcement pressure has, on paper, intensified. Russia’s fossil fuel export revenues rose 2% month-on-month to €726 million per day in May 2026, according to CREA’s most recent analysis, despite export volumes remaining broadly flat. Crude oil export revenues specifically grew 1% to €362 million per day, with volumes up 8% — evidence that Russia is finding new efficiencies in its export logistics even as the headline sanctions regime tightens.
KSE Institute’s revenue modeling, updated in light of the Middle East conflict, now projects that Russia’s total oil revenue could climb from $158 billion in 2025 to $208 billion in 2026 under a base-case scenario assuming current price caps and a conflict lasting up to three months. Under an adverse scenario involving weak sanctions enforcement, that figure could reach $214 billion — meaning even the coalition’s most pessimistic enforcement scenario still implies rising, not falling, Russian oil revenue for the year.
Pricing dynamics tell a related story. Russia’s benchmark Urals crude rose 19% month-on-month in April 2026 to $112.30 per barrel — more than double the $44.10 EU and UK price cap that took effect on February 1, 2026 — before easing 12% in May to $82.02 per barrel, still nearly double the cap, according to CREA’s tracking data. The price cap, designed explicitly to constrain Russian per-barrel revenue while keeping global oil supply flowing, has functioned as a floor for insurance and freight compliance rather than an effective revenue ceiling during periods of tight global supply.
Third-Country Refineries Remain a Persistent Loophole
Refineries in India, Türkiye, Brunei, and Georgia running on Russian crude exported €641 million worth of oil products to sanctioning countries in May 2026 alone, according to CREA, including shipments to the EU, Australia, the US, and New Zealand — jurisdictions that have formally banned direct imports of Russian crude but continue receiving refined products derived from that same crude once it has passed through a third-country refinery. Georgia’s Kulevi refinery has run entirely on Russian crude for months without receiving a single shipment of non-Russian oil, despite its operating company publicly stating an intent to diversify — and despite narrowly avoiding inclusion on the EU’s sanctions list in March.
The EU closed one version of this loophole through its 18th sanctions package in January 2026, banning oil products refined from Russian crude in third countries from entering the bloc, according to analysis from the Center for European Policy Analysis (CEPA). Yet the persistence of flows through Kulevi and similar facilities illustrates how quickly new evasion routes emerge once established ones are formally closed — a pattern sanctions researchers describe as a continuous cat-and-mouse dynamic rather than a one-time enforcement fix.
What the Data Means for the Broader Sanctions Debate
Since Russia’s full-scale invasion of Ukraine, sanctions imposed by the UK, US, and EU are estimated to have denied Russia access to more than $450 billion, according to CEPA’s analysis — a substantial figure that nonetheless coexists with the reality that Russia’s oil exports since February 2022 have generated more than $800 billion in revenue through April 2026, according to CREA data cited in the same CEPA report. Those two figures, both accurate, capture the fundamental tension at the heart of Western sanctions policy: meaningful financial damage has been inflicted, but Russia’s core oil revenue engine has continued operating at a scale sufficient to sustain its war economy.
For markets and policymakers tracking global oil supply through the remainder of 2026, the practical implication is that Russian barrels — whether transported via shadow fleet, laundered through third-country refineries, or shipped directly by re-empowered sanctioned majors — remain a structurally embedded part of global crude supply, with enforcement gaps proving durable enough that even renewed sanctions packages have thus far failed to meaningfully compress Russia’s oil-derived war financing.
Discover more from The Economy
Subscribe to get the latest posts sent to your email.
Analysis
Turkey’s Bid for Middle East Leadership: How Ankara Is Filling the Vacuum Left by Iran’s Weakening
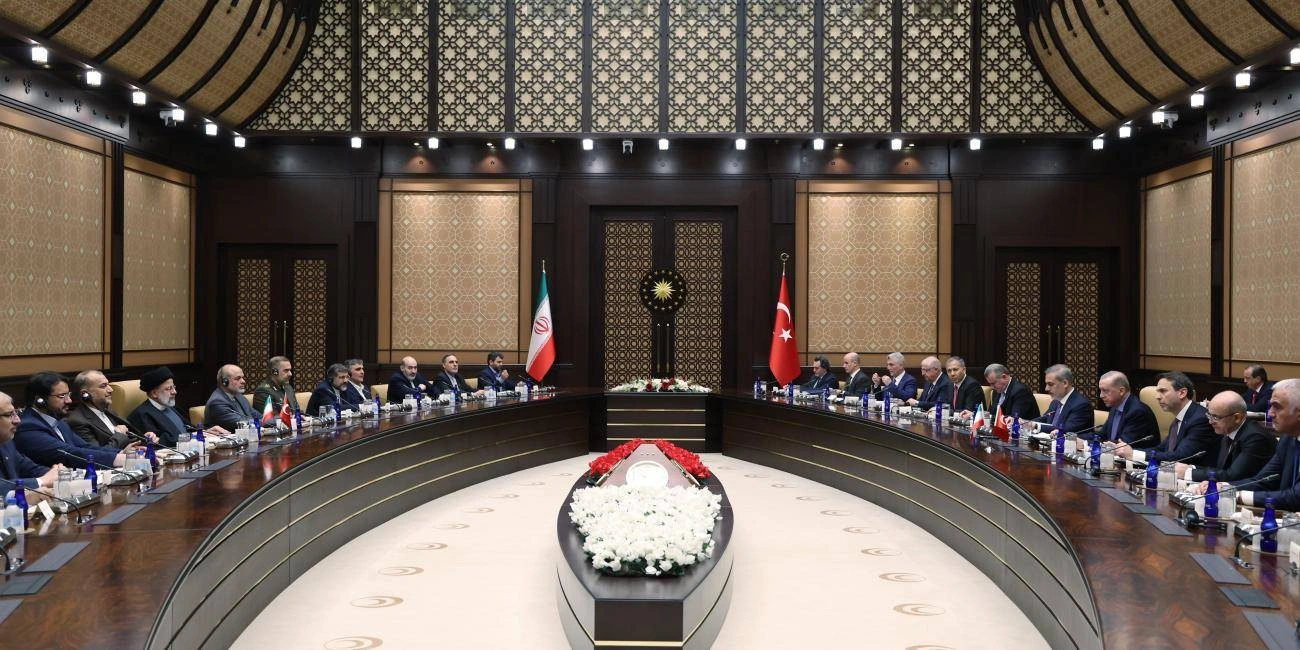
When the United States and Israel struck Iran in February 2026, they did not merely launch a war. They created a strategic vacuum. Iran — the dominant non-Arab power in the Middle East and the linchpin of the “Axis of Resistance” — was degraded, isolated, and forced into ceasefire negotiations. The question immediately arising for regional analysts: who fills the space?
The answer, increasingly, is Turkey.
Erdoğan’s Strategic Moment
Brookings scholar Aslı Aydıntaşbaş examines Turkey’s evolving role as it searches for influence in a Middle East undergoing fundamental transformation, prompted in equal parts by the Iran war and shifting U.S. commitments.
Turkey enters this moment with unusual strategic assets: it is a NATO member with deep ties to both the West and the Islamic world; it has the second-largest military in the alliance; it has cultivated relationships with Hamas, the Muslim Brotherhood, Qatar, and various Gulf states; and it is the host of the July 2026 NATO summit — placing President Erdoğan at the center of the most consequential alliance gathering in years.
The Islamabad Memorandum and Ankara’s Role
Turkey played a quiet but important role in the Iran ceasefire diplomacy. Pakistan served as the primary mediator — hence “Islamabad Memorandum” — but Turkish diplomatic channels contributed to the broader regional framework. This positioning as a constructive regional broker, distinct from both the U.S.-Israel axis and the Iran-led resistance bloc, is central to Erdoğan’s strategic calculus.
As Hezbollah is weakened and Hamas isolated, as Iran negotiates from a position of damage rather than strength, and as the Gulf states recalibrate toward Washington — Turkey is positioning itself as the indispensable interlocutor between competing regional forces.
The NATO Summit Leverage
Hosting the Ankara summit gives Turkey unusual leverage. The July 7–8 summit in Ankara will focus heavily on allies spending on European and Arctic security, as well as the need to vastly increase defense production.
But the summit’s subtext is about Turkey’s own strategic agenda: sustaining arms purchases outside of U.S. conditionality, maintaining relations with both Ukraine and Russia, and extracting concessions from NATO partners on matters ranging from Kurdish groups to EU accession.
Erdoğan has proven adept at using NATO summits as negotiating platforms. Ankara 2026 will be no different.
The Iran War’s Regional Reordering
The 2026 Iran war has fundamentally altered the regional power balance in ways that benefit Ankara. Hezbollah — Iran’s most powerful proxy — has been severely degraded by Israeli operations. The Houthis have been weakened. Hamas is isolated. Iran itself is in ceasefire negotiations.
The “Axis of Resistance,” as a coherent strategic instrument of Iranian foreign policy, has been severely damaged. The architecture of Iranian regional influence, built over four decades, is being reconstructed — and Turkey intends to ensure its influence grows in the reconstruction phase.
The Limits of Turkish Ambition
Turkey’s regional ambitions face real constraints. Its economy has been strained by years of inflation and currency volatility. Its relationship with the EU remains frozen. Its ties with Egypt, Saudi Arabia, and the UAE — which have normalized in recent years — could fray if Ankara overplays its hand.
Moreover, Turkey must navigate a NATO summit at which Trump is furious with European allies for their Iran stance — yet Turkey itself declined to actively support U.S. operations. Managing that contradiction requires considerable diplomatic dexterity.
The Middle East is undergoing a fundamental transformation, one prompted in equal parts by the Iran war and shifting U.S. commitments — and Turkey is positioning itself to shape that transformation rather than merely react to it.
Conclusion: The Ankara Moment
The 2026 Iran war may ultimately be remembered not only for what it did to Iran, but for what it enabled in Turkey. If Erdoğan manages the NATO summit effectively, deepens Turkey’s regional broker role, and maintains its strategic ambiguity between East and West — Ankara could emerge from 2026 as the most consequential player in the new Middle East order.
That prospect will be welcomed by some, feared by others, and watched closely by all.
Discover more from The Economy
Subscribe to get the latest posts sent to your email.

Pakistan Gulf Investment Outflows 2026: Peace Deal Stakes Explained

Canada Trade Diversification 2026: China, Indonesia, UAE Deals Explained

US Forced-Labour Tariffs on 60 Countries: The Hidden Trade Shock of 2026

Global Central Banks 2026: Fed, BoE and BoJ Decisions Could Reshape Markets

Gulf Capital Retreat From Pakistan 2026: UAE Loan Freeze & What It Means

Pakistan’s Most Reliable Export Is Its People: Remittances Hit $41.6 Billion, Overtaking Total Exports

Indonesia’s Confidence Problem: Record Investment, a Sinking Rupiah, and a Widening Credibility Gap

Down But Not Out: Inside the Slow Sinking of Russia’s War Economy

China’s Growth Slips to a Four-Year Low: Why Beijing Still Won’t Pull the Stimulus Trigger

The Johor-Singapore Corridor: How Malaysia Became Southeast Asia’s AI Infrastructure Powerhouse

Canada’s Economy ‘On Pause’: Inside the CUSMA Deadline That Passed Without a Deal

Dubai’s Millionaire Magnet: How the UAE Turned Middle East Turmoil Into a Capital Safe-Haven Boom

Britain’s Sixth Prime Minister in a Decade: What Starmer’s Exit Means for Gilts, Sterling and Your Portfolio

Anthropic Offers Up to $600,000 Salary for Critical IPO Role as AI Giant Prepares for Wall Street Debut

Carry Trade Unwind 2026: How the Yen’s Snapback Triggered a Global Margin Call

AI Bubble Warning 2026: Why BIS, IMF and Bank of England Fear a Market Crash

BRICS De‑Dollarization Strategy Takes Shape with $15 Billion Local‑Currency Push

The AI Super Bubble Is Ready to Burst

Russia Bans Diesel Exports 2026: Global Fuel Market Impact Explained

Strait of Hormuz Blockade 2026: Oil Prices Surge 9% as US-Iran Conflict Reignites

Private Credit Warning: Most BDCs Turn Unprofitable in 2026, Reuters Finds

IMF Cuts Pakistan Growth Forecast, Raises Inflation to 8.4%

Bitcoin $150k Milestone Achieved as US Sovereign Crypto Pivot Looms
Gulf Capital Retreat From Pakistan 2026: UAE Loan Freeze & What It Means

India Economic Rise 2026: How the Subcontinent Toppled Japan

Strait of Hormuz 2026: Why Markets Still Don’t Trust It’s Open

China Housing Market Turnaround: White‑List Model Stabilises Prices

Chipmakers Just Lost 6.7% in Two Days: Inside the Great AI Trade Rotation
-

 Markets & Finance7 months ago
Top 15 Stocks for Investment in 2026 in PSX: Your Complete Guide to Pakistan’s Best Investment Opportunities
-

 Analysis5 months ago
Johor’s Investment Boom: The Hidden Costs Behind Malaysia’s Most Ambitious Economic Surge
-

 Analysis5 months ago
Top 10 Stocks for Investment in PSX for Quick Returns in 2026
-

 Analysis6 months ago
Brazil’s Rare Earth Race: US, EU, and China Compete for Critical Minerals as Tensions Rise
-

 Banks6 months ago
Best Investments in Pakistan 2026: Top 10 Low-Price Shares and Long-Term Picks for the PSX
-

 Investment7 months ago
Top 10 Mutual Fund Managers in Pakistan for Investment in 2026: A Comprehensive Guide for Optimal Returns
-

 Global Economy7 months ago
15 Most Lucrative Sectors for Investment in Pakistan: A 2025 Data-Driven Analysis
-

 Global Economy7 months ago
Pakistan’s Export Goldmine: 10 Game-Changing Markets Where Pakistani Businesses Are Winning Big in 2025