
Analysis
Trump Economy 2026: Americans’ Views Remain Negative on Health Care, Food Costs

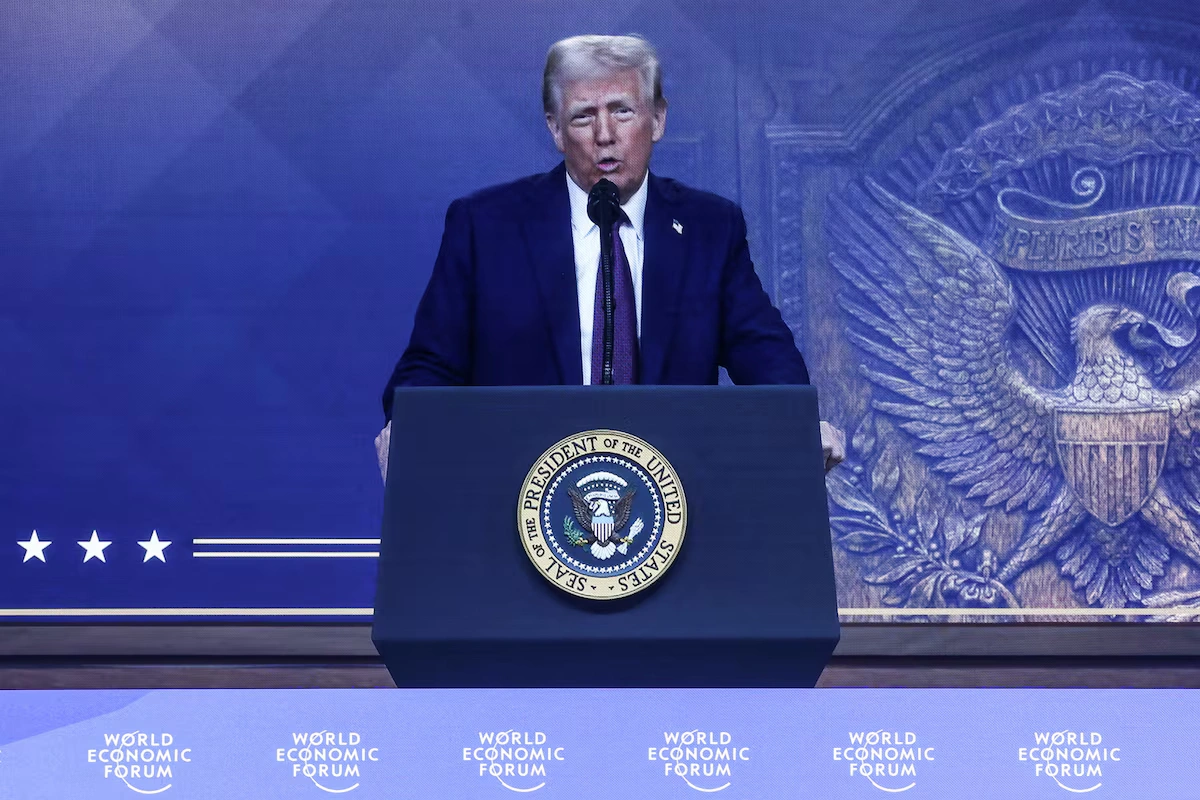
One year after Donald Trump’s return to the White House, economic anxiety grips American households as persistent inflation, healthcare costs, and grocery bills dominate kitchen-table conversations—despite administration claims of progress.
Introduction: The Paradox of Perception and Policy
Twelve months into his second term, President Donald Trump confronts a stubborn political reality: Americans remain deeply pessimistic about the economy, even as some traditional indicators show resilience. According to Pew Research Center‘s comprehensive February 2026 survey, 72% of Americans rate current economic conditions as fair or poor—a striking repudiation of the administration’s economic messaging. More troubling for the White House, 52% of respondents say Trump’s policies have actually made economic conditions worse, not better.
This disconnect between presidential rhetoric and public sentiment reveals something fundamental about the American economy in 2026: headline statistics no longer capture the lived experience of working families. While stock markets have shown periods of strength and unemployment remains relatively low, the relentless pressure of everyday costs—healthcare premiums, grocery bills, energy expenses—has created what economists call a “vibecession,” where negative perceptions persist regardless of macroeconomic data.
The numbers tell a compelling story. Seventy-one percent of Americans express serious concern about healthcare costs, while 66% worry intensely about food and consumer goods prices, according to Pew’s findings. These aren’t abstract anxieties; they reflect real household budget pressures that have reshaped American economic behavior and political calculations heading into the 2026 midterm elections.
Persistent Economic Pessimism: The Data Behind the Discontent
The breadth of negative economic sentiment extends across multiple polling organizations, creating a consistent portrait of American dissatisfaction. Gallup‘s latest tracking shows Trump’s economic approval hovering between 36-40%, with a particularly damaging net disapproval rating of -23 specifically on inflation management. The Quinnipiac University Poll reports similar findings, with just 37% approving of the president’s economic handling.
Perhaps most revealing is consumer sentiment data from the University of Michigan, which registered 57.3 in February 2026—near historic lows that typically accompany recessions. This metric, closely watched by economists and policymakers, measures how confident Americans feel about their financial future and willingness to make major purchases. The current reading suggests profound uncertainty about economic prospects.
A CBS News survey underscores this pessimism: only 22% of Americans expect a booming economy in the near term. This contrasts sharply with the optimism that characterized Trump’s first term in early 2017, when consumer confidence surged following his election. The reversal suggests that Americans have adjusted their expectations downward, potentially reflecting accumulated frustration from years of inflation that began during the pandemic and has proven more persistent than experts predicted.
According to The Economist‘s approval tracker, Trump’s net rating stands at -15, a significant deficit that reflects broader dissatisfaction with his economic stewardship. Meanwhile, The Wall Street Journal reported that 57% of Americans view the economy as weak—a damning assessment that undermines the administration’s claims of economic revival.
Rising Costs of Essentials: Where Americans Feel the Squeeze
Healthcare: The Unrelenting Burden
Healthcare costs remain the paramount concern for American families, with 71% expressing serious worry according to Pew Research. This anxiety is well-founded. Insurance premiums have continued their multi-decade climb, with family coverage now averaging over $25,000 annually for employer-sponsored plans—of which workers typically shoulder $7,000-$8,000 in premiums alone, before deductibles and out-of-pocket expenses.
The Trump administration’s approach to healthcare policy—including continued efforts to reshape the Affordable Care Act and proposals to restructure Medicaid—has created additional uncertainty. Prescription drug costs, despite some legislative efforts to cap insulin prices and allow Medicare negotiation, remain substantially higher than in comparable developed nations. For millions of Americans, medical debt continues to be a leading cause of personal bankruptcy, a uniquely American phenomenon among wealthy nations.
Brookings Institution researchers note that healthcare cost anxiety transcends partisan lines, affecting Republicans, Democrats, and independents nearly equally. This universal concern makes it a potent political issue, yet one that has proven notoriously difficult to address through policy reforms that satisfy diverse stakeholders.
Food and Consumer Goods: Grocery Bills as Economic Barometers
Sixty-six percent of Americans express serious concern about food and consumer goods prices—an anxiety rooted in daily experience at checkout counters nationwide. While headline inflation has moderated from 2022-2023 peaks, food prices remain significantly elevated compared to pre-pandemic levels. Common staples like eggs, bread, dairy products, and meat have seen cumulative price increases of 25-35% since 2020, according to Bureau of Labor Statistics data.
This “grocery inflation” has proven particularly stubborn and politically salient. Unlike gasoline prices, which fluctuate visibly and can decline dramatically, food prices rarely decrease in absolute terms; they simply rise more slowly during periods of moderating inflation. This creates a persistent affordability challenge for families, especially those in lower and middle income brackets who spend proportionally more of their budgets on food.
The Washington Post analysis reveals that Americans’ inflation expectations remain elevated, suggesting they anticipate continued price pressures. This psychology can become self-fulfilling, as businesses maintain pricing power when consumers expect increases, and workers demand higher wages to compensate for anticipated cost-of-living jumps.
Consumer goods beyond food—electronics, clothing, household items, vehicles—have experienced variable price trajectories. Supply chain normalization has eased some pressures, yet tariff policies implemented during Trump’s second term have introduced new costs on imported goods, particularly from China and other Asian manufacturing centers. These tariffs, designed to protect American industries and generate revenue, function as consumption taxes that ultimately fall on American households.
Policy Impacts and Public Sentiment: Assigning Responsibility
The most politically damaging finding for the Trump administration may be the attribution of blame. Pew Research found that 52% of Americans believe Trump’s policies have worsened economic conditions—a direct repudiation of the president’s economic agenda. This represents a significant shift from his first term, when economic performance generally received more favorable reviews, at least until the pandemic disrupted commerce in 2020.
What explains this negative assessment? Several policy domains appear to be driving discontent:
Tariff and Trade Policy: Trump’s renewed embrace of tariffs, implemented more aggressively in his second term than his first, has generated both retaliation from trading partners and measurable price increases for consumers. Economic modeling suggests these tariffs have added hundreds of dollars annually to typical household costs.
Tax and Fiscal Policy: While corporate tax rates remain at levels established during Trump’s first term, proposed changes to individual taxation and entitlement programs have generated anxiety, particularly among seniors and near-retirees concerned about Social Security and Medicare sustainability.
Regulatory Approach: Deregulation in financial services, environmental protection, and consumer safeguards has created concerns about corporate accountability and long-term economic stability, even as business groups applaud reduced compliance burdens.
Federal Reserve Relations: Trump’s public criticism of Federal Reserve policies and interest rate decisions—a continuation of behavior from his first term—has raised questions about central bank independence and the credibility of inflation-fighting efforts.
Forbes analysis suggests that the administration’s messaging challenges stem partly from a mismatch between traditional Republican economic priorities (tax cuts, deregulation, reduced government spending) and the immediate concerns of working-class voters who prioritize cost-of-living relief and job security over abstract growth metrics.
Comparative Context: Historical and International Perspectives
To understand the significance of current economic sentiment, historical comparison proves instructive. Consumer confidence at 57.3 ranks among the lowest readings outside official recession periods. During the Great Recession (2008-2009), sentiment plummeted to the 50s and even lower, reflecting genuine economic catastrophe with massive job losses and collapsing home values. The current reading suggests Americans feel comparable anxiety despite relatively stable employment conditions—a testament to inflation’s psychological impact.
Internationally, American economic pessimism stands out. Financial Times reporting indicates that consumer confidence in European Union countries, while below pre-pandemic levels, generally exceeds American sentiment. This suggests that inflation’s political fallout has been particularly severe in the United States, possibly because Americans experienced sharper pandemic-era price spikes and have fewer social safety nets to cushion cost-of-living pressures.
The political consequences of economic sentiment are historically clear: incumbent parties suffer in midterm elections when economic perceptions are negative. The 2026 midterms loom as a potential referendum on Trump’s economic stewardship, with control of Congress hanging in the balance. Democrats have made cost-of-living concerns central to their messaging, while Republicans have attempted to shift focus to immigration, crime, and cultural issues—a tacit acknowledgment of difficult economic terrain.
Demographic Divides: Who Feels the Pain Most Acutely?
Economic anxiety is not evenly distributed across American society. Pew and other surveys reveal important demographic patterns:
Income Stratification: Lower and middle-income households express substantially greater concern about costs than affluent Americans. For families earning under $50,000 annually, healthcare and food costs can consume 40-50% of post-tax income, leaving minimal cushion for emergencies or savings. Upper-income households, while not immune to price increases, face less severe trade-offs.
Age Differences: Younger Americans (18-35) show particular anxiety about housing costs and student debt in addition to healthcare and food concerns. Older Americans (65+) focus intensely on healthcare, prescription drugs, and Social Security sustainability. Middle-aged Americans (35-65) often face compound pressures: supporting children, caring for aging parents, and saving inadequately for their own retirement.
Geographic Variation: Urban and suburban residents face different cost structures than rural Americans. Housing costs dominate urban budgets, while transportation and energy expenses weigh more heavily in rural areas. Regional variation in healthcare access and costs also shapes economic experience significantly.
Partisan Perspectives: Predictably, Democrats express more negative views of economic conditions under Trump than Republicans, but the Pew data shows that even among Republicans, enthusiasm is muted. Only about half of Republican identifiers rate current economic conditions as good or excellent—suggesting that partisan loyalty only partially insulates the president from economic dissatisfaction.
Looking Forward: Economic Prospects and Political Implications
As Trump’s second term reaches its midpoint, several factors will shape economic trajectories and public perceptions:
Inflation Path: The Federal Reserve’s success in sustainably returning inflation to its 2% target without triggering recession remains uncertain. Current projections suggest continued gradual moderation, but geopolitical risks—including energy market volatility and supply chain disruptions—could reignite price pressures.
Labor Market Evolution: Employment strength has provided a floor beneath consumer confidence. Should unemployment begin rising significantly, already-negative sentiment could deteriorate sharply. Conversely, sustained job growth with accelerating wage increases could eventually improve household finances and perceptions.
Policy Adjustments: Whether the Trump administration recalibrates its approach based on negative polling remains to be seen. Politically, the pressure to demonstrate tangible cost-of-living relief will intensify as midterm elections approach. However, presidents have limited short-term tools to reduce prices without triggering other economic disruptions.
Structural Challenges: Beyond immediate policy debates, American economic anxiety reflects deeper structural issues: healthcare system inefficiencies that produce world-leading costs with mediocre outcomes; housing undersupply that has made homeownership increasingly unattainable; educational credentialing that requires debt-financed investment; and wage stagnation relative to productivity growth over decades. No administration can solve these challenges quickly, yet voters understandably demand relief.
The New York Times‘ economic analysis suggests that absent significant policy shifts or unexpected favorable developments, negative economic sentiment is likely to persist through 2026. This creates a challenging political environment for Republicans defending congressional majorities and looking ahead to 2028 presidential positioning.
Conclusion: The Politics of Economic Perception in an Age of Anxiety
One year into Donald Trump’s second term, the verdict from American families is clear: economic conditions remain unsatisfactory, costs continue squeezing household budgets, and presidential policies have not delivered the relief voters anticipated. With 72% rating the economy as fair or poor, 71% worried about healthcare costs, and 66% concerned about food and consumer goods prices, the political foundations of Trump’s economic agenda appear shaky.
This disconnect between administration claims and public experience raises fundamental questions about economic policymaking in contemporary America. Traditional metrics—GDP growth, unemployment rates, stock market performance—no longer reliably predict political success when Americans feel financially insecure in their daily lives. The “vibecession” of 2026 demonstrates that perception is political reality, and that lived experience at grocery stores, pharmacies, and doctor’s offices outweighs abstract economic indicators.
For policymakers across the political spectrum, the message is unmistakable: Americans demand tangible relief from cost-of-living pressures, not statistical reassurances. Whether that relief comes through wage growth, price moderation, enhanced social programs, or some combination remains a central question for American political economy.
As midterm campaigns intensify and voters prepare to render their judgment on Trump’s economic stewardship, one certainty emerges: economic anxiety will drive political outcomes, potentially reshaping congressional power and setting the stage for the 2028 presidential race. The party that convincingly addresses Americans’ cost-of-living concerns may gain decisive political advantage in an era defined by economic uncertainty.
What are your biggest economic concerns right now? Share your perspective on healthcare costs, grocery bills, or financial anxieties in the comments below, and join the conversation about America’s economic future.
Discover more from The Economy
Subscribe to get the latest posts sent to your email.



Key Takeaways
- Rolex’s secondary market rose approximately 7.9% year-over-year as of 2026 (per WatchCharts data) — trailing Patek Philippe (+16.2%) and Tudor (+11.4%) but still outperforming Audemars Piguet (+3.4%).
- Rolex raised U.S. retail prices 4–9% in January 2026 (steel models ~5.6%, gold models ~8.7%), narrowing the historical gap between retail and pre-owned pricing.
- Not every model appreciates: steel sports references (Submariner, GMT-Master II, Daytona) have held value far better than two-tone or widely available dress references like the standard Datejust.
- The Lady-Datejust posted the sharpest 2026 gain among tracked collections — up 22.73%, from roughly $9,269 to $11,376 — driven by demand for smaller, “everyday luxury” watches.
- Gold’s rise past $2,400/oz has directly lifted the investment case for Rolex’s precious-metal references (Day-Date, Sky-Dweller, Yacht-Master).
The Model-by-Model Picture
| Category | 2026 Trend |
|---|---|
| Lady-Datejust | +22.73% (strongest performer among tracked collections) |
| Steel sports models (Submariner, GMT-Master II) | Held value well; corrected from 2022 peak but stabilized above retail |
| Daytona | Corrected from highs above $50,000 to the mid-$30,000s; still among the most sought-after references |
| Two-tone/widely available Datejust | Flat to negative — “holds value” is an overstatement for this category |
| Gold references (Day-Date, Sky-Dweller) | Lifted by gold’s rise above $2,400/oz |
Why the “Rolex Always Appreciates” Myth Is Fading
The pandemic-era boom pushed some references — the Daytona above all — to speculative highs disconnected from historical norms. Since the March 2022 peak, steel sports models have compressed meaningfully, and dealers who bought inventory near the top have in some cases faced 20–40% markdowns on liquidation. The lesson for 2026 buyers: Rolex as a category is not a monolith. Value retention depends heavily on specific reference, condition, and whether the piece comes with box and papers (“full set”).
What’s Actually Driving 2026 Strength
- Retail price increases raise the floor. When a new Submariner retails at $10,050 (up from $9,500), a pre-owned example at $11,000–$12,000 suddenly represents a smaller premium — narrowing the gap without secondary prices actually moving.
- Supply discipline remains Rolex’s core lever. The brand has never confirmed production numbers, and secondary-market premiums remain entirely a function of Rolex’s own manufacturing decisions — a risk factor as much as a support.
- Certified Pre-Owned rollout. Rolex’s now fully rolled-out CPO program has changed how buyers transact in the used market, adding a layer of brand-verified legitimacy that supports pricing.
The Case for Rolex as a Portfolio Diversifier
Financial advisors increasingly frame luxury watches not as a replacement for equities or bonds, but as a tangible, historically low-correlation diversifier — one that carries its own risks (illiquidity, condition-dependent pricing, no yield) but has demonstrated multi-decade resilience for specific references.
Is Rolex a good investment in 2026?
It depends heavily on the specific reference. Steel sports models like the Submariner and Daytona have held or grown in value; two-tone and widely available dress models generally have not. Overall, Rolex’s secondary market rose about 7.9% year-over-year in 2026, trailing Patek Philippe but ahead of Audemars Piguet.
Discover more from The Economy
Subscribe to get the latest posts sent to your email.

Navigating Mortgage and Loan Refinancing in a High-Yield Environment
Global public debt crossing critical thresholds has kept central bank policies volatile, resulting in fluctuating US Treasury yields throughout 2026. For homeowners and commercial property holders burdened by previous high-interest borrowing cycles, finding optimal refinance windows has become a high-stakes financial puzzle. Stalled disinflation and stubborn employment numbers mean rate cuts are incremental, requiring borrowers to act with precision.
Timing your mortgage or commercial loan refinance in this environment requires a deep understanding of yield curve movements and lender risk appetites.
Decoding 2026 Refinance Dynamics
The 10-Year Treasury Yield Benchmark
Mortgage rates continue to track closely with the 10-year US Treasury yield. When macroeconomic anxiety spikes debt issuance, yields rise, tightening consumer borrowing capacity. Savvy borrowers monitor weekly Treasury auctions to lock in rates during brief dip windows.
Hybrid ARMs and Alternative Structures
With fixed rates remaining elevated, 7/1 and 10/1 adjustable-rate mortgages (ARMs) have surged in popularity. These products offer lower initial monthly payments, giving borrowers breathing room until central bank easing cycles fully materialize.
| Loan Product | Current Rate Range | Best For | Key Risk Factor |
| 30-Year Fixed Mortgage | 6.2% – 6.8% | Long-term predictability | Higher initial monthly outlay |
| 7/1 Hybrid ARM | 5.5% – 5.9% | Short-term ownership / flipping | Rate reset risk after year 7 |
| Commercial Refinance | 7.0% – 8.2% | Corporate asset restructuring | Strict DSCR lender covenants |
Actionable Steps for Successful Refinancing
To maximize your chances of securing favorable refinance terms in a volatile market, follow a disciplined preparation strategy.
Boost Your Credit Score Immediately: Lenders in 2026 are applying stringent credit tiering; a 20-point increase can drop your APR by a crucial quarter-point.
Shop Regional Credit Unions: Smaller financial institutions often offer portfolio loans with more flexible underwriting than major national banks.
Calculate the Break-Even Point: Ensure your total closing costs are recouped through monthly savings within 24 months of closing.
“Market Strategist View: Refinancing in 2026 is an exercise in opportunistic timing. Borrowers must maintain immaculate financial profiles ready to strike the moment Treasury yields dip.”
Mastering the complexities of today’s debt environment ensures you can successfully lower your debt service costs and protect your long-term financial stability.
Discover more from The Economy
Subscribe to get the latest posts sent to your email.

The days of pulling generic auto insurance quotes based purely on your zip code and age are officially over. In 2026, insurance comparison engines are powered entirely by generative AI and real-time telematics. These platforms digest thousands of live data points—ranging from your driving smoothness via connected vehicle sensors to real-time traffic congestion patterns—to generate hyper-personalized premiums instantly.
For consumers, this evolution represents both a massive opportunity for savings and a hidden trap for penalty pricing. Understanding how AI algorithms evaluate risk is essential for anyone looking to lower their monthly auto insurance premiums.
How AI Comparison Engines Evaluate Your Risk Profile
Behavioral Telematics and Connected Cars
Modern cars stream performance data directly to insurance aggregators. Generative AI models analyze braking sharpness, acceleration curves, cornering G-forces, and phone distraction metrics. Drivers who maintain smooth, defensive habits are rewarded with dynamic rate cuts of up to 40% compared to traditional rating tiers.
Predictive Traffic and Weather Modeling
AI tools now cross-reference your daily commute route with predictive weather and accident probability models. If your standard parking location or driving corridor has a statistically higher incidence of uninsured motorist claims, your quotes will reflect that hyper-local risk assessment.
| Comparison Factor | Traditional Rating Model | 2026 Generative AI Model | Impact on Premium |
| Mileage & Usage | Annual estimated odometer reading | GPS tracking & live trip duration | High (up to 35% savings) |
| Driving Behavior | MVR driving record & accidents | Real-time braking, speed, & G-force | Critical (determines tier) |
| Vehicle Tech | Make, model, and safety rating | ADAS calibration & repair cost data | Moderate |
Strategies to Lower Your AI-Driven Insurance Quote
To outsmart the algorithm and secure the lowest possible premium in 2026, drivers must proactively manage their digital footprint on insurance platforms.
Opt-In for Telematics Trial Periods: Many insurers offer immediate 15% discounts just for installing their driving app; let it track safe habits for 30 days to lock in permanent savings.
Scrub Unverified Public Records: Ensure your motor vehicle report is free of clerical errors that AI risk models misinterpret as reckless behavior.
Compare AI Aggregators: Use platforms that integrate multi-carrier API feeds rather than single-brand comparison sites to find the best risk-adjusted rate.
“Industry Note: AI-driven pricing rewards transparency and precision. Drivers who actively manage their telematics data consistently out-save those relying on legacy quote calculators.”
Embracing AI comparison tools allows savvy policyholders to customize coverage limits precisely to their driving habits, eliminating wasted premium spend while ensuring robust protection.
Discover more from The Economy
Subscribe to get the latest posts sent to your email.

Solar Panel Installation Cost in 2026: Why the Math Changed Overnight

Business Insurance: What Coverage You Actually Need and What It Costs in 2026

Auto Insurance Quotes: How to Get the Lowest Rate Without Losing Coverage

Huntington Online Banking: Full Features, Fees, and How It Compares in 2026

Apply for a Bank Account Online: What You Need and How Long It Actually Takes

World’s Largest Economies: Ranking the Top Global Powers

Business Loan: A Complete 2026 Guide to Rates, Types, and Qualifying

Fast Invoice Factoring: How to Turn Unpaid Invoices Into Cash Within 24 Hours

Investment Banking Services: What They Cost and How to Choose the Right Firm in 2026

Structured Settlement Loan: What “Cash Now” Offers Actually Cost You

DUI Attorney: Why Your First Call After an Arrest Should Never Be to the Court

Personal Injury Lawyer: A Complete Guide to Filing Your Claim in 2026

Commercial Vehicle Accident Lawyer: Holding Companies Accountable Beyond the Driver

Inside the White House Feud: How Trump’s Allies Are Painting Anthropic’s Dario Amodei as the Face of ‘AI Doomerism’

Top 30 Stocks for Investment in PSX for Massive ROI in 2026

SpaceX Starship Flight 14: First Orbital Attempt & Starlink V3 Launch Explained

Oil Prices Break $100 in 2026: Middle East Conflict & Energy Markets

Fidelity Investments Review 2026: SPAXX Yields & Zero-Fee Funds

AI Chip Stocks 2026: The Best Semiconductor Investments Beyond Marvell

BRICS+ Cross-Border Payments 2026: Interoperability Explained

Tween Back-to-School Trends 2026: What’s Driving the $85B Season

10-Year Treasury Yield Hits 4.80%: What It Means for Rates & Portfolios

Shein Clothes Quality & Safety in 2026: What Lab Tests Show

China’s US$10.8 Billion Trade Shortcut: Why the Pinglu Canal Matters

MRVL Earnings 2026: Why Marvell Sank Despite Beating Estimates

IMF & World Bank 2026 Global Economic Outlook: Growth, Inflation, Debt

High-CPM Finance Niches 2026: Publisher Monetization Blueprint

Middle East War Economics 2026: Oil Prices & Energy Markets
-

 Markets & Finance9 months ago
Top 15 Stocks for Investment in 2026 in PSX: Your Complete Guide to Pakistan’s Best Investment Opportunities
-

 Analysis7 months ago
Johor’s Investment Boom: The Hidden Costs Behind Malaysia’s Most Ambitious Economic Surge
-

 Analysis7 months ago
Top 10 Stocks for Investment in PSX for Quick Returns in 2026
-

 Banks8 months ago
Best Investments in Pakistan 2026: Top 10 Low-Price Shares and Long-Term Picks for the PSX
-

 Analysis8 months ago
Brazil’s Rare Earth Race: US, EU, and China Compete for Critical Minerals as Tensions Rise
-

 Investment9 months ago
Top 10 Mutual Fund Managers in Pakistan for Investment in 2026: A Comprehensive Guide for Optimal Returns
-

 Global Economy9 months ago
15 Most Lucrative Sectors for Investment in Pakistan: A 2025 Data-Driven Analysis
-

 Global Economy9 months ago
Pakistan’s Export Goldmine: 10 Game-Changing Markets Where Pakistani Businesses Are Winning Big in 2025