
Asia
The Great Singapore Disinflation: Why MAS Will Stand Firm as a Global Storm Abates

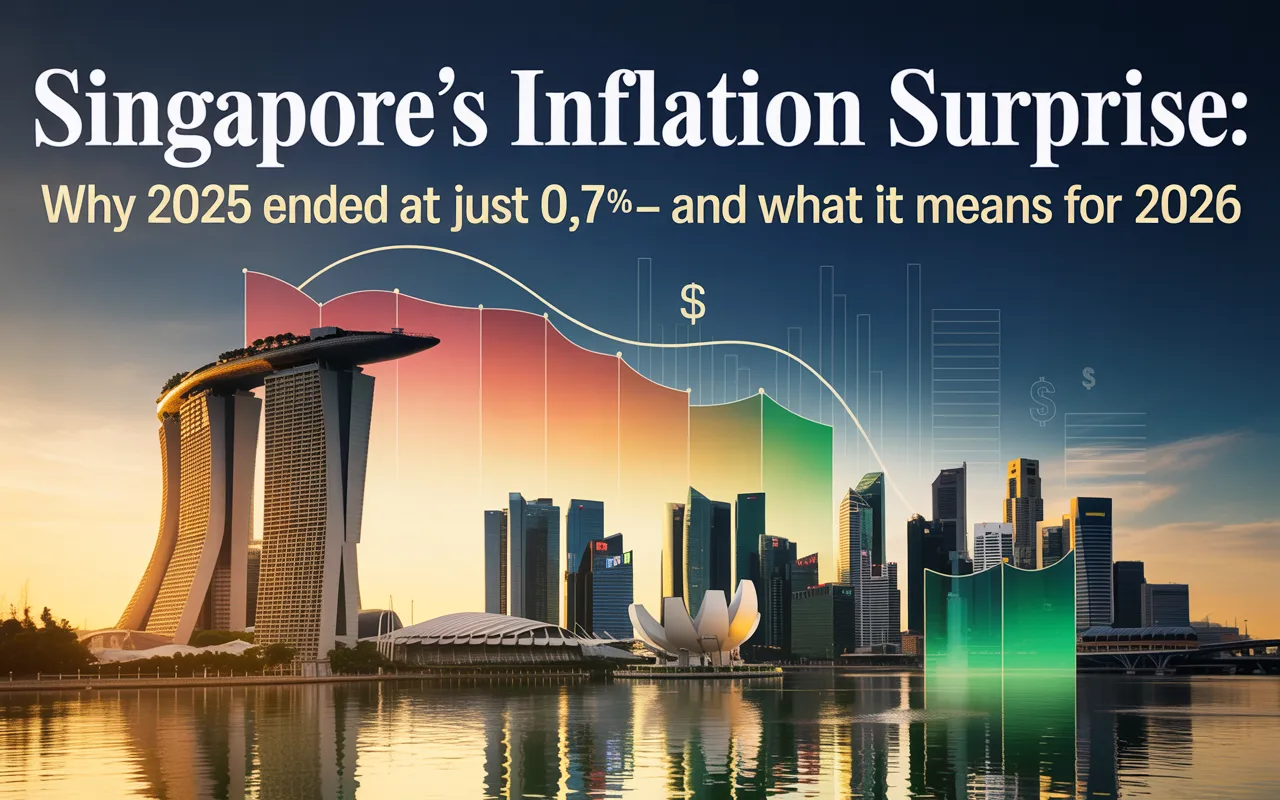
Singapore’s core inflation fell to 0.7% in 2025. With price pressures receding, the MAS is expected to hold policy steady in January 2026, marking a new phase for the city-state’s economy.
The late afternoon sun slants through the canopy of the Tiong Bahru Market hawker centre, glinting off stainless steel steamers and the well-worn handles of kopi cups. Here, at the heart of Singapore’s quotidien life, the most consequential economic conversation of the year is being had, not in the jargon of central bankers, but in the simple calculus of daily purchases. An auntie considers the price of char siew before ordering; a taxi driver compares the cost of his teh tarik to last year’s. For the first time in nearly half a decade, that mental math is bringing a faint, collective sigh of relief. The fever of inflation—which spiked to a 14-year high in 2023—has broken. The Monetary Authority of Singapore (MAS), the nation’s powerful central bank, now faces a delicate new reality: not of battling runaway prices, but of navigating a return to profound price stability in a world still rife with uncertainty.
On January 29, 2026, the MAS will release its first semi-annual monetary policy statement of the year. All signs, confirmed by the latest data from the Singapore Department of Statistics (SingStat), point to a unanimous decision: the central bank will keep its exchange rate-centered policy settings unchanged. The full-year data for 2025 is now in, and it tells a story of remarkable disinflation. Core Inflation—the MAS’s preferred gauge, which excludes private transport and accommodation costs—came in at 0.7% for 2025, a dramatic decline from 2.8% in 2024 and 4.2% in 2023.

Headline inflation for the year was 0.9%. December’s figures showed both core and headline inflation holding steady at 1.2% year-on-year, indicating a stable plateau as the economy adjusts to a post-shock norm. This outcome, while slightly above the government’s earlier 2025 forecast of 0.5%, underscores a victory in the battle against imported global inflation. Economists widely anticipate that alongside its stand-pat decision, the MAS and the Ministry of Trade and Industry (MTI) will revise the official 2026 inflation forecast range upward, from the current 0.5–1.5% to a likely 1–2%. This adjustment would not signal a new tightening impulse, but rather a recognition of stabilizing domestic price pressures and base effects, framing a modestly more hawkish guardrail for the year ahead.
The Data Unpacked: A Return to Pre-Pandemic Normality
To appreciate the significance of the 0.7% core inflation print, one must view it through the corrective lens of recent history. Singapore, as a miniscule, trade-reliant economy, is a hyper-sensitive barometer of global price pressures. The supply-chain cataclysm of 2021-2022 and the energy shock following Russia’s invasion of Ukraine were transmitted directly into its domestic cost structure, amplified by robust post-pandemic domestic demand.
Table: Singapore Core Inflation (CPI-All Items ex. OOA & Private Road Transport)
| Year | Core Inflation Rate (%) | Key Driver |
|---|---|---|
| 2022 | 4.1 | Broad-based imported & domestic cost pressures |
| 2023 | 4.2 | Peak passthrough, tight labour market |
| 2024 | 2.8 | MAS tightening, global disinflation begins |
| 2025 | 0.7 | Sustained MAS policy, falling import costs |
| 2026F | 1.0 – 2.0 | Stabilising domestic wages, moderated global decline |
The journey down from the peak has been methodical, reflecting the calibrated tightening by the MAS. Since October 2021, the authority had undertaken five consecutive rounds of tightening, primarily by adjusting the slope, mid-point, and width of the Singapore Dollar Nominal Effective Exchange Rate (S$NEER) policy band. This unique framework, which uses the exchange rate as its primary tool, effectively imported disinflation by strengthening the Singapore dollar, making imports cheaper in local currency terms. The decision to pause this tightening cycle in July 2024 was the first signal that the worst was over.
The 2025 disinflation was broad-based. Key contributors included:
- Food Inflation: Eased significantly from 3.8% in 2024 to an average of 1.8% in 2025, as global supply chains normalized and commodity prices softened.
- Retail & Other Goods: Inflation turned negative in several quarters, reflecting lower imported goods prices and weaker discretionary spending.
- Services Inflation: Moderated but remained stickier, a testament to persistent domestic wage pressures in a tight labour market. However, even here, the pace decelerated markedly by year-end.
The slight overshoot of the 0.7% outcome relative to the official 0.5% forecast is statistically marginal but analytically noteworthy. It likely reflects the residual stickiness in domestic services costs and perhaps a firmer-than-anticipated trajectory for accommodation costs, which are excluded from the core measure but feed into overall economic sentiment.
The MAS Mandate in a New Phase: Vigilance Over Volatility
The MAS operates under a singular mandate: to ensure price stability conducive to sustainable economic growth. Unlike most central banks, it does not set an interest rate but manages the S$NEER. The current expectation of an unchanged policy stance is a statement of confidence that the existing level of the currency’s strength is sufficient to keep imported disinflation flowing while guarding against any premature loosening of financial conditions.
“The current rate of appreciation of the S$NEER policy band is sufficient to ensure medium-term price stability,” the MAS stated in its October 2025 review. The latest inflation data validates this assessment. Holding the policy band steady now achieves two objectives:
- It Anchors Expectations: It signals to businesses and unions that the central bank sees no need for further tightening, but is equally not prepared to risk its hard-won credibility by easing policy while core inflation, though low, is expected to rise modestly through 2026.
- It Provides a Buffer: A stable, moderately strong Singapore dollar acts as a shock absorber against potential renewed volatility in global energy and food prices, which remain susceptible to geopolitical flare-ups.
The anticipated upward revision of the 2026 forecast range to 1–2% is the key nuance in this meeting. This is not a hawkish pivot, but a realistic recalibration. It acknowledges several forward-looking dynamics:
- Base Effects: The very low inflation in late 2024 and early 2025 will create less favourable base effects for year-on-year comparisons in late 2026.
- Domestic Cost Pressures: Wage growth, while moderating, is expected to remain above pre-pandemic trends, supported by structural tightness in the local labour market and ongoing initiatives like the Progressive Wage Model.
- Policy-Driven Price Increases: The scheduled 1%-point GST increase to 10% in January 2026 will impart a one-time upward push to price levels, which the MAS will look through but must account for in its communications.
The Global and Comparative Lens: Singapore as a Bellwether
Singapore’s disinflation narrative is not occurring in a vacuum. It mirrors, and in some respects leads, trends in other small, advanced, open economies. A comparative view is instructive:
- Switzerland: Like Singapore, Switzerland has seen inflation return to target rapidly, aided by a strong currency (the Swiss Franc) and direct government interventions on energy prices. The Swiss National Bank has already shifted to a neutral stance, with discussions of easing emerging.
- Hong Kong: Linked to the US dollar via its currency peg, Hong Kong has had its monetary policy dictated by the Federal Reserve. Its disinflation path has been bumpier, complicated by its unique economic integration with mainland China and a slower post-pandemic recovery in domestic demand.
- New Zealand: The Reserve Bank of New Zealand has maintained a more hawkish stance, with inflation proving stickier due to a less open consumption basket and intense domestic capacity constraints. New Zealand’s cash rate remains restrictive.
Singapore’s experience stands out for the precision of its policy tool. The S$NEER framework allowed it to respond directly to the imported nature of the inflation shock. As Bloomberg Economics noted in a January 2026 analysis, “The MAS’s exchange-rate centered policy has acted as a targeted filter for global inflation, proving highly effective in the post-pandemic cycle.” This successful navigation has bolstered the authority’s international credibility and the Singapore dollar’s status as a regional safe-haven asset.
The Looming Risks: Why Complacency is Not an Option
The path to a sustained 2% inflation environment is not without its pitfalls. The MAS’s steady hand in January belies a watchful eye on several risk clouds:
- Geopolitical Supply Shocks: Any major escalation in the Middle East or renewed disruption in key trade lanes like the Straits of Malacca could trigger a sudden spike in global energy and freight costs. Singapore’s strategic petroleum reserves and diversified supply chains provide a buffer, but the inflationary impact would be swift.
- Wage-Price Spiral Precautions: The slope of Singapore’s Phillips Curve—the historical relationship between unemployment and inflation—has flattened but remains a concern. Robust wage settlements in 2026, if they significantly outstrip productivity growth, could embed inflation in the services sector, which is less sensitive to exchange rate policy.
- Global Monetary Policy Divergence: The timing and pace of interest rate cuts by the US Federal Reserve and the European Central Bank will cause significant currency and capital flow volatility. The MAS must ensure the S$NEER moves in an orderly fashion amidst this global repricing of risk.
- Climate Transition Costs: The green energy transition, while deflationary in the long term, may impose episodic cost pressures through carbon taxes, regulatory costs, and investments in new infrastructure. Singapore’s carbon tax is scheduled to rise significantly in the coming years.
As the Financial Times reported following the release of the 2025 data, analysts caution that “the last mile of disinflation—stabilising at the 2% sweet spot—is often the most treacherous.” The MAS is acutely aware that premature declarations of victory could unanchor inflation expectations.
Conclusion: The Steady Centre in a Churning World
As the hawker centre stalls begin to shutter for the evening, the economic reality they embody is one of cautious normalization. The MAS’s expected decision to hold policy unchanged is a powerful signal of this new phase. It is the policy equivalent of a skilled sailor easing the sails after successfully navigating a storm: the vessel is steady, the immediate danger has passed, but the horizon is still watched for the next shift in the wind.
The recalibration of the 2026 forecast to a 1–2% range is a masterclass in central bank communication—acknowledging progress while managing expectations upward from unsustainably low levels. It leaves the MAS with maximum optionality: it can maintain its stance through much of 2026 if inflation drifts toward the upper end of the band, but it is not locked into any pre-committed path.
For Singaporeans, the profound disinflation of 2025 offers tangible respite. For global investors and policymakers, Singapore’s trajectory serves as a compelling case study in the effective use of an unconventional monetary framework in a crisis. The nation has emerged from the global inflationary maelstrom not just with stable prices, but with reinforced confidence in the institutions that guard its economic stability. The challenge ahead is one of preservation, not conquest. And in that endeavour, a steady hand on the tiller is the most valuable tool of all.
Discover more from The Economy
Subscribe to get the latest posts sent to your email.


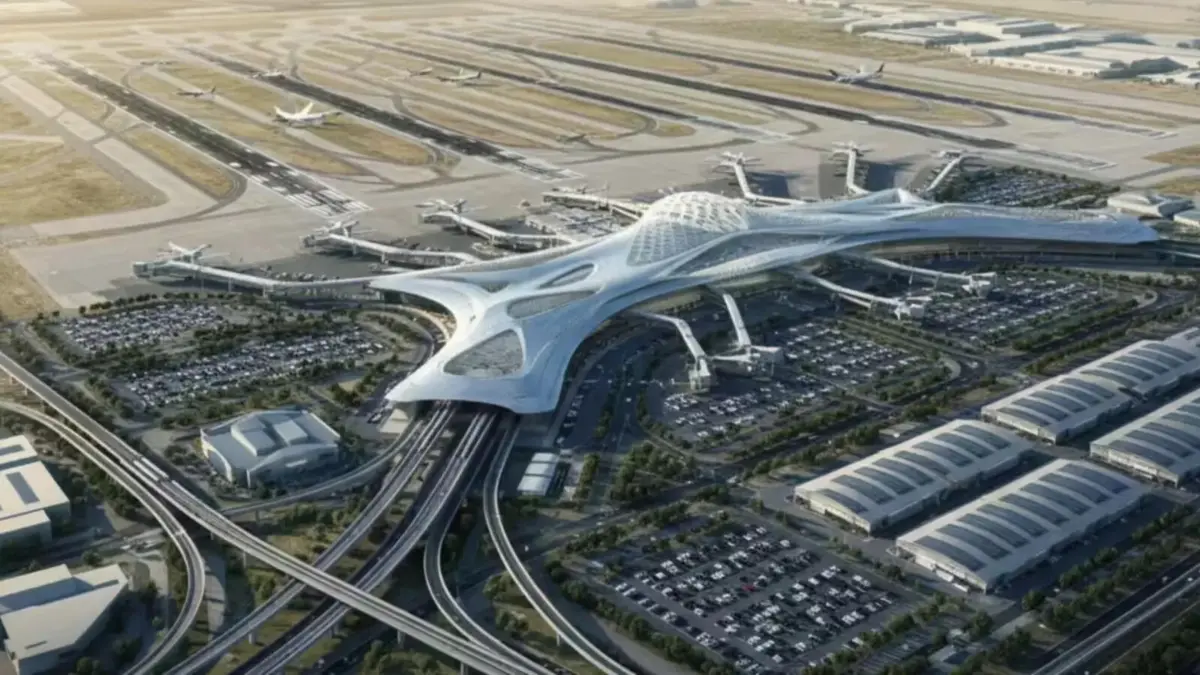
Dubai is in the middle of building what is intended to become the world’s largest airport by capacity — a Dh128 billion ($34.8 billion) expansion of Al Maktoum International Airport at Dubai World Central (DWC), according to Gulf News. When complete, the facility will feature five parallel runways, roughly 400 gates, and the capacity to handle up to 260 million passengers a year — nearly three times the current capacity of Dubai International Airport (DXB), already the world’s second-busiest airport for international traffic, per analysis from K Estates.
Where the project actually stands in 2026
Construction crews have already excavated more than 45 million cubic metres of earth and completed the airport’s second runway, according to MyBayut’s DWC guide. The first phase — a central passenger terminal and four concourses designed to handle 150 million passengers annually — is targeted for completion around 2032, per Khaleej Times. Dubai is set to allocate AED 55 billion worth of expansion contracts by the end of 2026 alone, underscoring the pace at which the project is being financed and built.
The scale of ambition extends beyond aviation infrastructure. DWC is being planned as a self-contained “airport city,” incorporating business, cultural, and residential districts across Dubai South, roughly 35 kilometres from Dubai Marina, according to the same Khaleej Times reporting. All operations currently based at DXB — including Emirates’ long-haul network — are expected to eventually transfer to the new hub.
Part of a much bigger regional aviation build-out
Al Maktoum’s expansion is the largest single project within a broader regional wave of investment: airports across the Middle East, Africa, and South Asia are expected to spend a combined $183 billion on capacity, connectivity, and passenger-experience upgrades, with the UAE and Saudi Arabia leading the push, according to Gulf News. Within the UAE alone, expansion plans extend beyond Dubai to Sharjah and Ras Al Khaimah, with a shared emphasis on AI-enabled operations, IoT systems, and energy-efficient terminal design.
What it means for the region’s real estate and travel markets
The airport build-out is already reshaping property markets nearby. Transactions in Dubai South exceeded AED 15 billion ($4.1 billion) in just the first five months of 2025 — nearly matching the entire AED 16.1 billion recorded across all of 2024 — with analysts forecasting further price appreciation as the airport nears completion, according to K Estates. For travellers and airlines, the eventual payoff is a dramatic increase in regional connectivity capacity at a time when global air travel demand — and airfares — have both been climbing steadily through 2026.
Key takeaways
- Al Maktoum International Airport’s expansion carries a price tag of roughly $34.8 billion (Dh128 billion) and is intended to make it the world’s largest airport by 2050.
- Full build-out capacity: five runways, ~400 gates, up to 260 million passengers annually and 12 million tonnes of cargo.
- Phase one, targeted for around 2032, alone will handle 150 million passengers a year.
- The project has already reshaped Dubai South real estate, with transactions surpassing AED 15 billion in the first five months of 2025.
- It is the anchor project within a broader $183 billion regional airport investment wave across the Middle East, Africa, and South Asia.
FAQ
When will Al Maktoum International Airport be the world’s largest? Full completion is projected around 2050, though the first major phase is targeted for roughly 2032.
How many passengers will Al Maktoum Airport handle? Up to 260 million passengers annually at full capacity, with the first completed phase alone handling 150 million.
Will Emirates move its operations to the new airport? Yes — all Dubai International Airport operations, including Emirates’ long-haul network, are expected to eventually transfer to Al Maktoum International.
Discover more from The Economy
Subscribe to get the latest posts sent to your email.
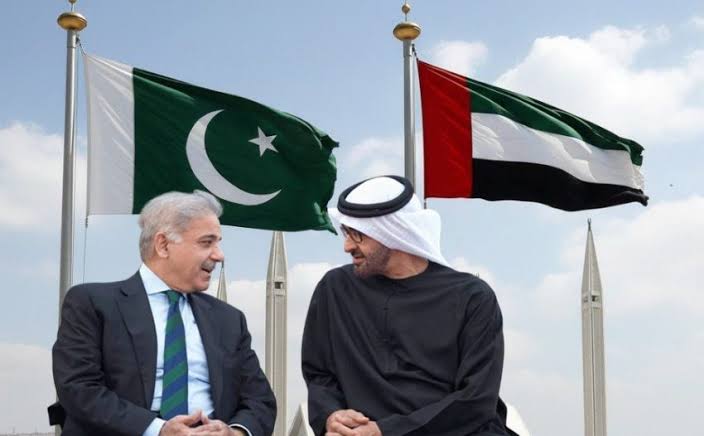
What happened: In early 2026, the United Arab Emirates declined to roll over a $3 billion loan to Pakistan — the first such refusal in seven years. The repayment equalled roughly 18% of Pakistan’s foreign currency reserves, arriving as Islamabad also faced a $1.3 billion bond payment and was waiting on the next IMF tranche.
Why it matters: It’s the clearest sign yet that Gulf sovereign patience with Pakistan’s balance-of-payments cycle is thinning, even as Gulf states simultaneously court China, Saudi Arabia, and each other for capital in a tightening regional liquidity environment.
The Story Nobody’s Connecting
Most coverage of Pakistan’s 2026 external account stress treats the UAE’s loan decision as an isolated liquidity event — a “routine financial transaction,” in the words of Pakistan’s own Ministry of Foreign Affairs. That framing misses the bigger pattern. The same weeks that Abu Dhabi called in its $3 billion, unusual delays began appearing in bank transfers from Saudi Arabia to the UAE itself — friction between the Gulf’s two largest economies, at a moment when both are also managing their own post-war oil price adjustment. (Pakistan & Gulf Economist)
Put those two data points together and a different story emerges: this isn’t just about Pakistan’s creditworthiness. It’s about Gulf capital becoming more selective, more transactional, and less willing to extend informal grace periods across the board — with Pakistan simply the most exposed borrower in the queue.
The Numbers Behind the Pressure
Pakistan’s State Bank held $16.4 billion in reserves as of late March 2026 — enough to cover roughly three months of imports, a threshold economists generally treat as a comfort floor, not a cushion. (Mettis Global News) The UAE’s declined rollover landed at the same time as a looming $1.3 billion international bond payment and dependence on the next $1.2 billion IMF disbursement — a convergence of obligations that left the State Bank with limited room to maneuver beyond import restrictions, rate hikes, or fresh commercial borrowing.
The backdrop matters too. The rupee had been trading in a comparatively narrow 278–282 band before the escalation of the Iran conflict pushed global oil prices higher, squeezing Pakistan’s import bill precisely when its Gulf safety net began to wobble. The KSE-100 benchmark, meanwhile, had already shed around 15% amid the broader pressure. (Mettis Global News)
This is not Pakistan’s first Gulf-dependency cycle. The IMF’s own record shows a now-familiar pattern: staff-level agreements reached in Dubai, UAE pledges of multibillion-dollar investment arriving alongside IMF tranches, and Gulf bridge financing used to stave off sovereign default in periods when reserves cover shrinks toward zero. (Business Standard) What’s different in 2026 is that the bridge itself is showing cracks.
Islamabad’s Official Line vs. the Structural Reality
Pakistan’s government has leaned into a “stability to sustainable growth” narrative around its FY2026–27 federal budget, with the finance minister framing the transition as export-driven rather than reserve-dependent. Business groups have broadly welcomed the budget, and the current account posted a $459 million surplus in May 2026, an improvement attributed to strong remittance inflows. (Business Recorder) The Monetary Policy Committee has held rates steady rather than reaching for emergency tightening, which is itself a signal that the central bank does not yet see the UAE episode as a systemic trigger.
But a current account surplus built substantially on remittances is different from one built on export competitiveness or durable FDI. Pakistan’s trade structure still leans heavily on a narrow set of partners: China supplies over a quarter of its imports and a meaningful share of its exports, the UAE is both a top export destination and its second-largest import source, and Gulf states collectively remain the primary channel for both remittances and emergency liquidity. (Wikipedia — Economy of Pakistan) That concentration is precisely what makes a single Gulf lender’s changed appetite so consequential.
Why the Oil Backdrop Compounds the Risk
None of this is happening in a vacuum. The IMF’s own July 2026 commentary noted that global oil markets “absorbed the war shock” from the Iran conflict, but cautioned that buffers — spare production capacity, strategic reserves, shipping insurance capacity — are running low. (IMF Blog) For an oil-importing, reserve-constrained economy like Pakistan, a second energy price shock without deeper buffers would land directly on the same reserves the UAE loan was meant to protect.
What to Watch Next
- Whether Saudi Arabia steps in as an alternative bridge lender, or whether the Riyadh–Abu Dhabi transfer friction signals a broader Gulf liquidity tightening that limits everyone’s appetite to backstop Pakistan.
- The pace and size of the next IMF tranche, and whether Fund conditionality shifts to demand deeper reserve buffers given the UAE precedent.
- Whether China increases its role as lender of last resort, deepening Pakistan’s dependency in exactly the direction Gulf financing was historically meant to offset.
Discover more from The Economy
Subscribe to get the latest posts sent to your email.
Introduction
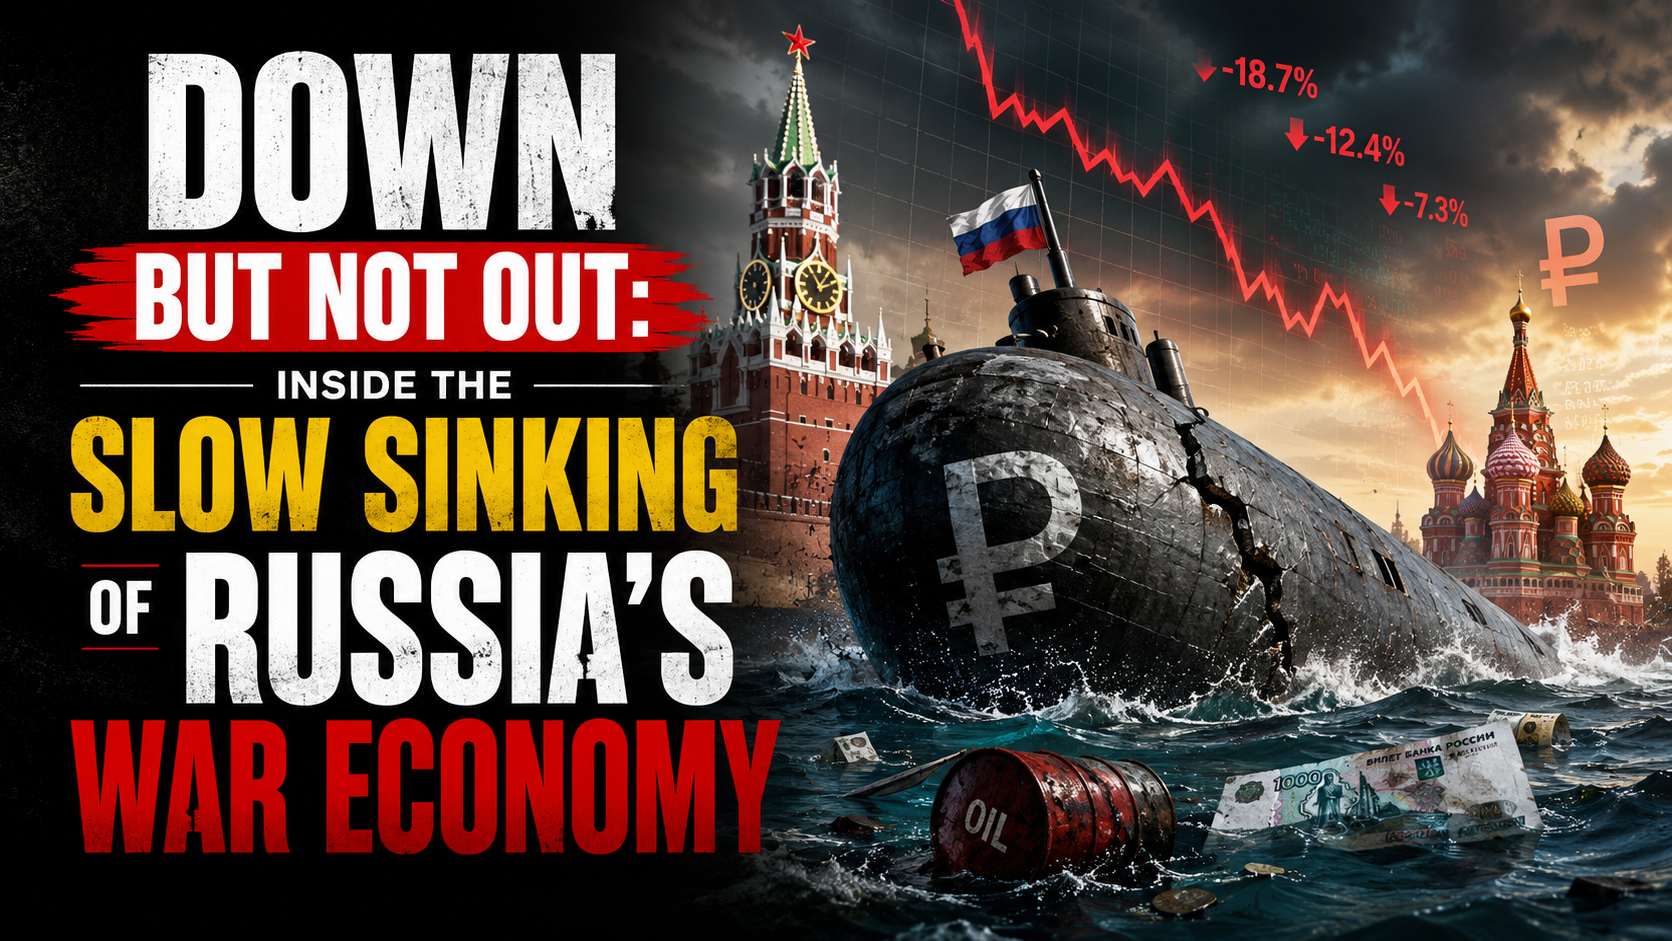
The European Council formally extended its economic sanctions against Russia for another full year on 25 June 2026, keeping restrictive measures in place until 31 July 2027 (Council of the EU). More than four years into the war, the headline story of Russia’s economy has shifted from whether sanctions would work to a more nuanced question: how much longer can the Kremlin keep financing the war before the accumulated strain becomes impossible to hide behind favorable official statistics.
The Sanctions Architecture, Renewed Again
The EU’s economic measures against Russia, first introduced in 2014 and dramatically expanded after the February 2022 full-scale invasion, now span trade, finance, energy and dual-use technology restrictions, alongside asset freezes and travel bans on a broad range of individuals and entities (Council of the EU). Since February 2022, the EU has adopted 20 separate sanctions packages, and the European Council has explicitly stated it remains determined to keep weakening Russia’s war economy by further reducing its energy revenues, curbing shadow-fleet oil shipping operations and constraining its banking system (Council of the EU). Separately, on 3 July 2026 the EU sanctioned six individuals connected to the poisoning and death of opposition figure Alexei Navalny, underscoring that the sanctions regime continues to expand on human-rights grounds as well as economic ones (Council of the EU Sanctions Timeline).
The Headline Numbers Beijing-Style Optimism Can No Longer Explain Away
Russia’s GDP is now put at roughly $2.51 trillion, the world’s eleventh-largest economy — comparable in size to South Korea despite Russia’s vastly larger landmass and resource base — with 2026 growth projected at just 1.0% and inflation running at 5.2% (Statistics of the World). More pessimistic estimates put full-year 2026 growth even lower, at around 0.4%, which would be worse than 2025’s already-weak 1% expansion and would mark a sharp deceleration from the 4.1% growth Russia posted in 2023 as it forged new trading relationships to route around initial sanctions (Forbes).
Oil and gas revenues — historically around half of Russia’s state income — have fallen to roughly a quarter, a deliberate outcome of Western sanctions strategy that targets how much Russia earns from exports rather than blocking those exports outright (Stockholm School of Economics/SITE). Russia’s oil and gas budget revenues reportedly halved in January 2026 alone, with crude prices falling below $73 a barrel before the Middle East conflict briefly reversed the trend, sending Brent surging more than 55% to near $120 a barrel at its peak (Forbes).
The Middle East War: A Temporary Lifeline With Long-Term Costs
The spike in oil prices tied to the Iran conflict, combined with a period of eased US sanctions enforcement on Russian oil under President Trump, offered Moscow unexpected fiscal breathing room in mid-2026 (Forbes). But that same conflict has undermined Russia’s longer-term energy diversification ambitions in the region: two Russian-backed power plant projects in Iran have been put on hold, along with oil and gas exploration work and plans to build new transit routes linking Russia to India via Iran (Forbes).
The Gap Between Official Statistics and Underlying Reality
Perhaps the most important analytical point from recent research is not about any single data point but about the reliability of Russian statistics themselves. Torbjörn Becker of the Stockholm Institute of Transition Economics has argued the real test of sanctions is not whether they end the war overnight, but how much they erode the Kremlin’s capacity to finance it — and by that measure, the evidence points to deeper strain than headline GDP figures suggest (Stockholm School of Economics/SITE). Becker notes that Russia’s economy grew only modestly in 2022 despite oil prices rising sharply that year — a gap between expected and actual performance that implies a considerably larger hidden economic hit than the official contraction figures showed (Stockholm School of Economics/SITE). Compounding the problem, Russian authorities have stopped publishing several key statistics since 2022, making independent assessment of inflation, consumption and real economic conditions increasingly difficult — leading Becker to conclude that “statistics have become part of the narrative” rather than a neutral measure of economic reality (Stockholm School of Economics/SITE).
The Military-Civilian Economic Split
A recurring theme across recent analysis is the growing bifurcation between Russia’s overheating military-industrial sector and a stagnating civilian economy. This imbalance has pushed interest rates higher and forced the liquidation of a striking 71% of Russia’s gold reserves to help fund continued war spending (Forbes). Russia’s total fossil fuel export revenue is estimated at roughly €734 million per day, underscoring just how central hydrocarbon income remains to the entire war financing model even as that revenue stream shrinks (Forbes).
The Counter-Narrative: Wages Still Rising
It would be inaccurate to describe Russia’s economy as in freefall. CSIS research notes that Russian salaries rose 17.8% in nominal terms and 8.7% in real terms in 2024 compared to 2023, with disposable incomes up 6.1% in 2023 and 7.3% in 2024 — growth rates not seen in Russia in almost two decades (CSIS). Government budget projections still expect real salaries to rise, albeit at a decelerating pace: 7% in 2025, 5.7% in 2026 and 4.1% in 2027 — a marked slowdown from the 2024 peak but still roughly double the pre-invasion decade average (CSIS). This wage growth, driven substantially by wartime labor shortages and military-adjacent spending, is precisely the kind of headline-stabilizing data point that has allowed Putin to argue publicly that sanctions have failed to cripple his economy (Fortune) — even as think tanks describe the broader trajectory as pushing Russia toward what one report calls an “economic, political, and military abyss” (Fortune).
What Comes Next
Renewed legislative pressure in Washington — including the Sanctioning Russia Act introduced with strong bipartisan support — signals appetite in the US for tightening the screws further, even as the loss of a key congressional champion for that effort has complicated the political path forward (TIME). Whether the EU’s renewed sanctions regime, continued oil price pressure, and constrained reserves ultimately force a shift in Kremlin calculus toward negotiation remains the central open question for 2027.
Key Takeaways
- The EU has extended Russia sanctions for a further year, through 31 July 2027, continuing a regime built from 20 separate packages since 2022.
- Russia’s 2026 GDP growth is forecast between 0.4% and 1.0%, a sharp deceleration from 2023’s 4.1% post-shock rebound.
- Oil and gas revenue’s share of Russian state income has fallen from roughly half to about a quarter as Western sanctions target export earnings specifically.
- Russia has liquidated a large share of its gold reserves to sustain war financing amid a widening split between an overheating military sector and a stagnating civilian economy.
- Official Russian statistics likely understate the true economic strain, according to independent economists who cite a widening gap between reported and expected performance.
Sources: Council of the EU, Council of the EU Sanctions Timeline, Stockholm School of Economics/SITE, Forbes, Statistics of the World, CSIS, Fortune, TIME
Discover more from The Economy
Subscribe to get the latest posts sent to your email.

Balance of Payments (BOP)

The Falkland Islands Dispute: Sovereign Wealth, Offshore Drilling, and Market Impacts

Gross Domestic Product (GDP): Nominal vs. Real

What is Inflation and the Consumer Price Index (CPI)?

US-China Trade Competition 2026: Supply Chain Relocation Guide

Oil Prices Break $100 in 2026: Middle East Conflict & Energy Markets

South-South Trade Expansion: Digital Integration and Emerging Market Growth

$166B Tariff Refund Tapering Fast: Is Your Business Missing Out?

Stock Market Today: Dow Climbs 500 Points as Markets Shake Off Inflation Jitters

14th WTO Conference 2026: Tariffs & Global Supply Chain Impact

Swish Secures $24M Funding to Disrupt India’s $100B Food Market

Physical AI and Driverless Tech: The Next Trillion-Dollar Industrial Revolution

Enterprise AI Platforms Disrupting B2B SaaS in 2026: Full Analysis

Crypto vs. Safe Haven Assets 2026: Where Institutions Are Hedging

State Farm’s $5B Dividend 2026: Who Qualifies & Payout Dates

US-China Relations in Q3 2026: Trade Tariffs and Supply Chain Risks

Gold’s Wild 2026: From a Record $5,600 Peak to a 24% Crash and Back Toward $4,500

Oil Surges as Strait of Hormuz Traffic Collapses Again

The Rocket That Won’t Quit: Inside SpaceX’s Falcon 9 Launch Machine

Bank of England Set to Hold Rates Through Year-End, Reuters Poll Shows

SpaceX Starship Flight 14: First Orbital Attempt & Starlink V3 Launch Explained

The 2026 Crypto Regulatory Shift: What It Means for Institutional Investors

AI Chip Stocks 2026: The Best Semiconductor Investments Beyond Marvell

Retail Earnings Week: What Home Depot, Target & Walmart Reveal

AI-Powered Training: The Next Multi-Billion Dollar Ecosystem in Fitness

Russia’s Black Sea Oil Exports Fall for a Fifth Straight Week

Global Chip Selloff Deepens: What’s Driving the Aug. 19 Semiconductor Rout

Tween Back-to-School Trends 2026: What’s Driving the $85B Season
-

 Markets & Finance8 months ago
Top 15 Stocks for Investment in 2026 in PSX: Your Complete Guide to Pakistan’s Best Investment Opportunities
-

 Analysis7 months ago
Johor’s Investment Boom: The Hidden Costs Behind Malaysia’s Most Ambitious Economic Surge
-

 Analysis7 months ago
Top 10 Stocks for Investment in PSX for Quick Returns in 2026
-

 Analysis7 months ago
Brazil’s Rare Earth Race: US, EU, and China Compete for Critical Minerals as Tensions Rise
-

 Banks8 months ago
Best Investments in Pakistan 2026: Top 10 Low-Price Shares and Long-Term Picks for the PSX
-

 Investment8 months ago
Top 10 Mutual Fund Managers in Pakistan for Investment in 2026: A Comprehensive Guide for Optimal Returns
-

 Global Economy9 months ago
15 Most Lucrative Sectors for Investment in Pakistan: A 2025 Data-Driven Analysis
-

 Global Economy9 months ago
Pakistan’s Export Goldmine: 10 Game-Changing Markets Where Pakistani Businesses Are Winning Big in 2025