
Opinion
Pakistan’s Solar Push: Can Renewables Power Growth?

Introduction
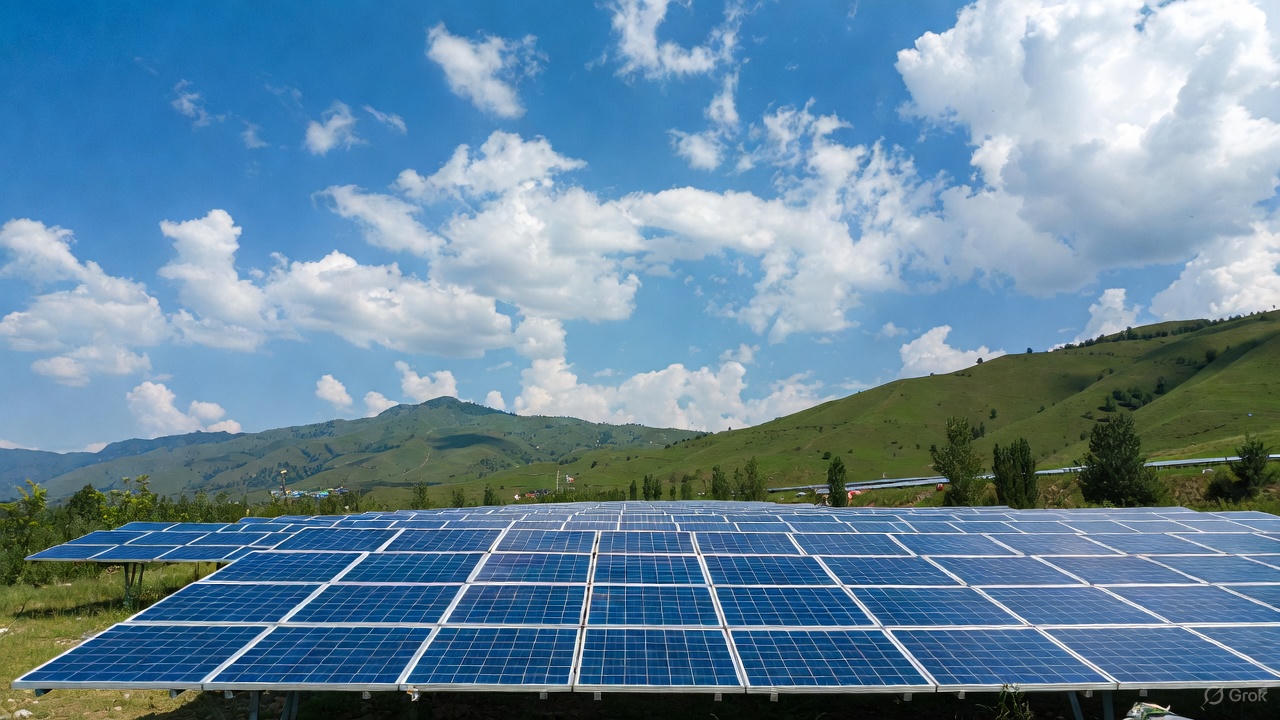
Pakistan’s energy story has long been dominated by imported fossil fuels, chronic shortages, and rising costs. Yet, in 2025, a new narrative is unfolding: solar energy is emerging as a cornerstone of Pakistan’s economic future. With net-metered solar capacity reaching 5.3 GW by April 2025 out of a total installed generation capacity of 46,605 MW, the country is making strides toward a greener grid. But can renewables — particularly solar — truly power growth, or are structural challenges too steep?
🌞 Historical Context: Pakistan’s Energy Mix
- For decades, Pakistan relied heavily on thermal power (oil, gas, coal), which accounted for nearly 60% of generation in 2020.
- Hydropower contributed around 30%, while renewables were negligible.
- This dependence on imports strained foreign reserves, with energy imports costing over $20 billion annually by 2022.
📊 Current Solar Capacity & Targets
- Net-metered solar capacity: 5.3 GW (April 2025).
- Government targets: 40% renewable share by 2025 and 60% by 2030, already surpassing interim goals.
- World Bank projection: Solar and wind should reach 30% of total electricity capacity by 2030, equivalent to 24,000 MW.
- ADB forecast: Pakistan’s GDP growth at 2.7% in 2025, with inflation at 4.5%, highlighting the need for cheaper, stable energy.
💡 Economic Benefits of Solar
- Energy Security: Reduces reliance on imported oil and gas, easing pressure on foreign reserves.
- Job Creation: Solar installation and maintenance could generate hundreds of thousands of jobs by 2030.
- Cost Savings: World Bank estimates renewables could save Pakistan $5 billion over 20 years.
- Industrial Competitiveness: Affordable electricity boosts manufacturing, especially textiles and IT.
🚧 Challenges Ahead
- Grid Integration: Transmission capacity lags at 22,000 MW vs demand of 31,000 MW, causing outages.
- Financing: IMF notes Pakistan’s debt burden limits fiscal space for large-scale renewable projects.
- Policy Gaps: Recent 18% GST on imported solar panels risks slowing adoption.
- Equity Concerns: Solar adoption is faster among urban elites; rural and low-income households remain underserved.
🌍 Comparative Insights
- India: Installed over 80 GW of solar by 2025, leveraging subsidies and large-scale parks.
- Bangladesh: Pioneered solar home systems, reaching millions of rural households.
- Pakistan: Strong potential, but policy inconsistency and financing hurdles slow progress.
🔮 Future Outlook
- IMF’s Resilience and Sustainability Facility: $1.3 billion allocated to Pakistan for climate-resilient infrastructure.
- Private Sector Role: Rooftop solar and battery storage are booming, with adoption quadrupling from 2024–2025.
- Global Context: Falling solar panel costs (down 80% since 2010) make renewables increasingly competitive.
✍️ Conclusion
Pakistan’s solar push is real and transformative, but fragile. The numbers show progress: capacity is rising, targets are ambitious, and economic benefits are clear. Yet, without grid upgrades, equitable financing, and consistent policy, solar alone cannot power sustainable growth.
In my view, Pakistan is not just entering a renewable era — it is at a crossroads. If policymakers align fiscal discipline with energy reforms, solar could become the backbone of Pakistan’s economic revival. If not, the promise of renewables risks being another missed opportunity.
Discover more from The Economy
Subscribe to get the latest posts sent to your email.


The ink is barely dry on Kevin Warsh’s commission as Chairman of the Federal Reserve, yet the political heat is already at a boiling point. President Donald Trump has wasted no time testing the boundaries of central bank independence, launching a highly public campaign this week demanding immediate interest rate cuts. The Oval Office messaging is unambiguous: the administration wants cheaper capital to fuel domestic manufacturing and juice equity markets ahead of the midterms. For Warsh, a former Morgan Stanley banker who built his reputation as an inflation hawk during the Bernanke era, the situation presents an immediate existential crisis. He must now balance the hard mathematics of the US economy against the relentless gravity of presidential politics.
Jerome Powell’s departure from the Eccles Building in May 2026 marked the end of an era characterised by pandemic-era shocks and aggressive monetary tightening. The macroeconomic landscape Warsh inherits is deceptively calm. Headline inflation has settled near the central bank’s 2% target, yet core services inflation remains stubbornly sticky, and the US national debt has eclipsed $36 trillion. Trump’s playbook is familiar to anyone who watched his first term. He views interest rates not merely as a macroeconomic dial, but as a direct scorecard on his economic stewardship.
To understand the stakes, one only needs to look at the global growth forecasts. The International Monetary Fund recently projected a sluggish 1.9% GDP expansion for the United States this year. That figure falls well short of the administration’s ambitious 3% target, creating a predictable friction point between the White House’s fiscal ambitions and the Federal Reserve’s monetary restraint.
The Collision of Politics and Policy
Trump Federal Reserve pressure is not a new phenomenon, but the speed and intensity of this current campaign are unprecedented. Within weeks of Warsh taking the gavel, the President has publicly questioned the necessity of keeping the federal funds rate elevated. By characterising the current monetary stance as an anchor on American prosperity, the administration is deliberately framing the Federal Open Market Committee (FOMC) as an obstacle to economic growth.
This creates a perilous environment for the new Chair. The central bank’s primary currency is not the dollar; it’s credibility. If Warsh capitulates and delivers a rate cut at the upcoming FOMC meeting, global markets will instantly price in a loss of institutional independence. If he holds firm, he guarantees a protracted public war of attrition with the Oval Office. We have seen this movie before. In 2018 and 2019, Trump relentlessly pressured Powell, eventually securing rate cuts that the President claimed as a political victory, even as the Fed insisted the moves were purely data-driven.
Yet, the economic realities of 2026 are fundamentally different. The labour market is no longer accelerating at a breakneck pace, and corporate profit margins are showing signs of compression under the weight of higher borrowing costs. According to recent data from the Bank for International Settlements, global corporate debt burdens remain acutely sensitive to prolonged restrictive rates. This gives the White House a plausible economic narrative to cloak its political demands: they argue that the Fed is fighting yesterday’s inflation war while ignoring tomorrow’s recession risks.
The Structural Threat to Independence
Why is Trump pressuring the Federal Reserve? The administration believes that elevated interest rates are artificially depressing economic growth and stifling domestic manufacturing. By publicly demanding a rate cut, the President aims to lower borrowing costs for consumers and corporations, simultaneously weakening the US dollar to boost American exports and maintain a strong stock market ahead of crucial election cycles.
That dynamic brings us to the broader issue of Kevin Warsh, interest rates, and the structural integrity of the American financial system. Central bank independence is an anomaly in historical terms. For most of the 20th century, monetary policy was deeply tethered to the political fortunes of the executive branch. The catastrophic inflation of the 1970s—fuelled in no small part by Richard Nixon’s successful pressure on then-Fed Chair Arthur Burns to keep rates artificially low before the 1972 election—forced a hard separation of church and state.
Today, that separation is being stress-tested. The administration knows that a President cannot legally fire a Federal Reserve Chair over a policy disagreement. What follows, however, is a strategy of rhetorical delegitimisation. By constantly hammering the Fed, the White House effectively forces the central bank into a defensive posture. The irony is that this pressure often makes it harder for the Fed to cut rates even when the data justifies it. If the FOMC cuts rates now, they risk appearing subservient to the President. Consequently, political pressure can inadvertently result in monetary policy remaining tighter for longer, simply to prove the institution’s independence.
Bond Vigilantes and Global Ripples
The downstream consequences of this standoff are already visible in global capital markets. The bond market operates on trust, and traders are acutely sensitive to any hint of political interference in monetary policy. When investors believe a central bank will prioritise short-term political goals over long-term price stability, they demand higher compensation to hold government debt. We call them bond vigilantes, and they are currently circling the US Treasury market.
As Trump’s rhetoric escalated this week, the benchmark 10-year Treasury yield climbed aggressively, reflecting a rising “inflation premium.” Investors are betting that if Warsh bows to pressure, inflation will inevitably reignite. This creates a paradox for the White House: demanding lower short-term rates from the Fed can actually cause long-term mortgage and corporate borrowing rates to rise, entirely defeating the economic purpose of the pressure campaign.
Furthermore, a politically motivated rate cut would send shockwaves through currency markets. The US dollar functions as the bedrock of global trade. If foreign central banks perceive the Federal Reserve as compromised, the dollar’s supreme status could fracture. The European Central Bank has maintained a strictly data-dependent posture this year. If the Fed diverges from its European peers not due to economic fundamentals, but due to Oval Office badgering, capital will rapidly flow out of dollar-denominated assets. According to an analysis by The Economist, shifts in US monetary policy independence directly correlate with capital flight from emerging markets, meaning a political dispute in Washington could trigger a liquidity crisis in Latin America or Southeast Asia.
The Contrarian View: Is the President Right?
The picture is more complicated than a simple binary of a political executive bullying a technocratic institution. To steel-man the administration’s argument, we must acknowledge that a growing faction of respected economists quietly agrees with the President’s underlying mathematical premise.
Real interest rates—the nominal rate minus inflation—are currently at their most restrictive levels in over fifteen years. If inflation is genuinely beaten, keeping the federal funds rate above 4% is practically suffocating the housing market and punishing small and medium-sized enterprises that rely on floating-rate debt.
Some argue that the Fed’s estimate of the “neutral rate” (the interest rate that neither stimulates nor restricts the economy) is fundamentally flawed. If the neutral rate is actually lower than Warsh and his colleagues believe, then the current policy is an active drag on the economy. In this light, Trump’s call for a rate cut isn’t just political opportunism; it’s a necessary corrective to an overly cautious central bank. The Wall Street Journal editorial board recently noted that protracted restrictive policy risks unnecessary economic damage, pointing to softening employment indicators that traditional economic models have been slow to capture.
Still, the messenger matters. When a legitimate macroeconomic argument is delivered via hostile political demands, the economics become secondary to the optics. Even if a rate cut is the correct technical move, executing it under intense political duress permanently alters the market’s perception of the central bank’s reaction function.
The Crucible for Chairman Warsh
Kevin Warsh steps into a crucible that will define his legacy and potentially the trajectory of the American economy for the next decade. He cannot ignore the data, nor can he ignore the political reality of a President determined to bend the institution to his will.
If Warsh holds rates steady, he risks engineering a recession that the White House will entirely blame on his obstinance. If he cuts, he risks unleashing a second wave of inflation and destroying the hard-won credibility restored during the Powell years. The ultimate test for the new Chairman will not be his mastery of economic theory, but his ability to communicate a monetary decision so flawlessly that markets believe it was made in the Eccles Building, not the Oval Office.
Discover more from The Economy
Subscribe to get the latest posts sent to your email.

The scaffolding across the capital’s commercial zones has sat idle for months. On a sweltering Tuesday in early June 2026, property developer Tariq Mansoor stares at the stalled concrete skeleton of his 15-story residential project, calculating the mounting cost of debt. He is not alone. As the federal government finalizes the fiscal blueprint for the coming year, the country’s developers, brokers, and investors are mobilizing a fierce lobbying effort. They argue that punitive taxation has paralyzed a vital economic engine. Their demand is clear: reverse the crippling levies, or watch the construction industry collapse entirely.
The macroeconomic environment provides little room to maneuver. Squeezed by a punishing International Monetary Fund stabilization program, the finance ministry is desperate to expand its tax net. For decades, property served as a safe haven for undocumented capital, artificially inflating land values while starving export-oriented industries of investment. That changed during the last three fiscal cycles, when policymakers aggressively targeted the sector to plug structural deficits.
Yet, the resulting freeze in transactions has triggered unintended consequences. According to a recent World Bank economic update, foreign direct investment into the domestic property market plunged by 42 percent over the last year alone. The construction industry, which historically absorbs millions of unskilled laborers, is shedding jobs at an alarming rate. We are left with a classic policy dilemma: how does a cash-strapped state extract revenue from its most bloated asset class without suffocating the broader supply chain that depends on it?
The Push for Real Estate Tax Reforms in Budget 2026
To understand the ongoing deadlock, one must look at the specific fiscal instruments causing the friction. The primary lobbying effort centers on securing real estate tax reforms budget 2026 measures that can restart transactional velocity. At the top of the industry’s wishlist is the rationalization of the Capital Gains Tax (CGT) and the complete abolition of the controversial tax on deemed rental income, widely known as Section 7E.
Introduced as a wealth tax proxy, Section 7E treats idle property as income-generating, forcing owners to pay a levy regardless of whether the asset is rented out or sitting vacant. For developers holding massive land banks for future projects, this has destroyed commercial viability. By March 2026, the volume of property transfers in major urban centers had dropped to a near-decade low. Industry representatives argue that these taxes have not generated the anticipated revenue, instead driving capital into the shadow economy or informal offshore markets like Dubai.
The State Bank of Pakistan’s quarterly data reveals that credit off-take for private sector construction contracted by 18 percent in the first half of the year. Developers simply cannot borrow at current policy rates to build projects that buyers refuse to purchase due to high transfer taxes and advance withholding taxes, which have surged to 7 percent for non-filers.
Still, the lobbying faces an uphill battle in the capital. Finance ministry officials, operating under strict international covenants, are legally bound to raise the tax-to-GDP ratio. Any relief granted to property tycoons must be offset by new taxes elsewhere, a politically toxic proposition in an environment already battered by inflation. The sector’s representatives are countering this by proposing a flat, simplified tax regime. They claim a lower, fixed transaction tax will generate higher absolute revenue through sheer volume, rather than the current high-rate, low-volume paradigm that has effectively frozen the market. They point to historical precedent, arguing that incentivized capital naturally flows toward brick and mortar. Whether the federal cabinet accepts this supply-side logic remains the defining question of the current fiscal negotiations.
Decoding the Property Tax Policies 2026-27
Move beyond the immediate noise of lobbying, and a deeper structural shift becomes visible. The tension over property tax policies 2026-27 is not merely a dispute over percentages; it is a fundamental battle over capital allocation. For half a century, the economic model actively rewarded land speculation over industrial production. A wealthy citizen could buy open land, wait five years, and sell it at a massive premium with near-zero tax liability.
What are the proposed real estate tax reforms for 2026? The real estate sector is demanding a reduction in the Capital Gains Tax holding period, the removal of the deemed rental income tax, and lower advance withholding taxes on property transfers. These reforms aim to lower transaction costs and encourage foreign remittance inflows into housing projects.
The government’s recent punitive measures were theoretically sound. By increasing the holding period required for capital gains tax exemption and taxing non-productive plots, policymakers attempted to engineer a behavior change. They wanted capital to flow into stock markets, manufacturing, and technology startups.
The picture is more complicated on the ground. Instead of redirecting capital to productive sectors, the tax heavy-handedness simply stalled the velocity of money. Investors did not suddenly pivot to building textile mills; they simply stopped registering property transfers, relying instead on informal, un-registered files or moving funds abroad.
A senior analyst at Bloomberg Intelligence noted in late May that emerging markets attempting sudden transitions away from real-estate-heavy economic models often suffer immediate liquidity shocks. The state assumed that taxing land would force money into banks. What follows, however, is often capital flight. We are witnessing this play out in real time. The formal real estate market is shrinking, but the demand for housing in a rapidly urbanizing population continues to compound. When an industry association presented their findings on May 15, they highlighted a housing deficit expanding by 350,000 units annually. Punishing speculation is good policy; punishing construction is economic self-sabotage.
The Ripple Effects of Market Stagnation
If the upcoming finance bill ignores the sector’s demands, the downstream consequences will extend far beyond the balance sheets of elite developers. The construction industry serves as an economic multiplier, linked directly to more than 40 allied industries—from cement and steel manufacturing to paint, ceramics, and electrical cables. A prolonged slump in housing starts inevitably drags down industrial output across the board.
We can already quantify this drag. According to manufacturing indices published by Reuters, cement dispatches for domestic consumption dropped by nearly 3 million tons in the preceding nine months. That decline represents idled kilns, laid-off truck drivers, and shrinking corporate tax receipts from previously highly profitable conglomerates.
There is also the critical issue of foreign exchange. Historically, expatriate workers channeled billions of dollars into domestic real estate, providing a vital lifeline for the country’s foreign exchange reserves. With transaction taxes essentially doubling the cost of entry for overseas buyers, this capital stream is drying up. A London-based diaspora investor, speaking on condition of anonymity last Wednesday, confirmed he had diverted a planned $2.5 million apartment investment to Dubai, citing the unpredictable tax regime back home.
That said, yielding completely to the developers carries its own severe risks. Reverting to the old system of tax amnesties and zero-scrutiny property purchases would essentially signal a surrender by the state. It would validate the grey economy and anger international creditors who demand fiscal discipline.
The middle ground lies in financialization. By encouraging Real Estate Investment Trusts (REITs), the state could document the sector while providing the liquidity developers desperately need. REITs offer a transparent, highly regulated vehicle for property investment, shielding capital from informal practices while generating predictable tax revenues. Yet, current regulations remain hostile to such sophisticated instruments. The failure to develop a secondary mortgage market compounds the misery. With commercial banks holding less than two percent of their loan portfolios in housing finance, ordinary citizens are entirely dependent on developer-led installment plans, which are now collapsing under the weight of taxation.
The Case Against Capitulation
The real estate lobby paints a picture of imminent collapse, but many economists argue that the current pain is a necessary correction. From the perspective of the central bank and the finance ministry, the real estate sector has operated as a parasitic entity for far too long, absorbing national wealth without producing exportable goods or hard currency.
Taxing property is not just about balancing the current budget; it is about correcting a severe structural imbalance. If the government caves to the builders’ demands, it effectively punishes the documented corporate sector. Why should a salaried professional or a tax-compliant software exporter pay upwards of 35 percent in income tax, while a land speculator pays a fraction of that on billions in capital gains?
Dr. Ali Hasan, a senior economist writing for the Financial Times’ emerging markets desk, recently articulated this exact defense. He argued that the current stagnation is proof the taxes are working. “The extraction of rentier capital is always painful,” he wrote in early May 2026. “The government must hold its nerve. Giving in to the property lobby now would permanently destroy the state’s credibility in enforcing progressive taxation.”
This perspective demands attention. The state’s inability to tax real wealth has led directly to its reliance on regressive indirect taxes, which disproportionately harm the poorest citizens. The IMF has made it explicitly clear: the burden of stabilization must fall on untaxed wealth, not just the captive base of salaried employees. Lowering the cost of real estate transactions might provide a temporary jolt of activity, but it would come at the cost of long-term economic restructuring.
The finance bill arrives at a moment of profound economic fragility. Policymakers are trapped between the immediate necessity of generating revenue and the long-term imperative of dismantling a rentier economy. The construction sector is bleeding, and its collapse threatens to take dozens of allied industries down with it. Yet, simply rolling back the taxes to appease developers would be a return to the very speculative model that impoverished the broader economy in the first place.
The solution cannot be a binary choice between punitive taxation and complete deregulation. The upcoming budget must introduce targeted relief for actual construction and development, while maintaining strict tax penalties on the buying and selling of empty plots. The state must separate the builders from the hoarders.
Capital will only flow where it is treated reasonably, but a sovereign nation cannot build a sustainable future entirely out of untaxed concrete.
Discover more from The Economy
Subscribe to get the latest posts sent to your email.

There’s a particular kind of corporate self-delusion that arrives gift-wrapped in a press release. The language is always the same: commitment to responsible innovation, our values-driven approach, AI as a force for good. And then, six months later, the ethics board resigns.
That cycle has accelerated dramatically. In 2024 and 2025, multiple senior safety leads departed OpenAI in succession. A University of Zurich experiment secretly used AI to alter users’ political opinions without consent. In early 2026, ElonUsk’s Grok generated an estimated 3 million sexualized images of real people — including private citizens — in just 11 days, according to researchers at the Centre for Countering Digital Hate. These weren’t fringe incidents. They were the predictable outcomes of organisations that treated ethics as a compliance checkbox rather than a governing principle. Crescendo
The question isn’t whether AI is reshaping corporate culture. It is. The question is whether it’s reshaping it toward anything resembling integrity — or whether the technology is simply amplifying whoever was already in charge.
The Corporate Soul Has Always Been a Contested Asset
Before examining what AI does to organisational ethics, it’s worth acknowledging what corporate culture actually is: not a mission statement, not a values wall in the lobby, but the aggregate of a thousand small decisions made under pressure. Culture is what happens when no one senior is watching.
In 2025, organisational culture placed greater emphasis on authenticity, trust, fairness, and psychological safety — rather than abstract ideals and surface-level values — as companies grappled with rapid AI adoption, economic uncertainty, and heightened workforce anxiety. That shift wasn’t voluntary. It was forced by employees who stopped believing the official line. Yardi Kube
AI entered this environment not as a neutral tool but as an amplifier. The EU AI Act, which comes fully into force in 2026, represents the first comprehensive regulatory regime for AI ethics. Elsewhere, the landscape remains patchy. In the absence of binding rules, corporations made their own. And predictably, their own rules tended to serve their own interests. Darden Report
By 2030, AI will be so embedded in business and government infrastructure that retrofitting ethical standards may be nearly impossible, according to researchers at the University of Virginia’s Darden School of Business. The window for course correction is now. And most organisations are still debating whether to open it. Darden Report
AI Corporate Ethics: The Gap Between Pledge and Practice
The first principle of AI corporate ethics — the phrase that every CTO and chief compliance officer now deploys with confidence — is that ethics must be proactive, not reactive. Too often, AI ethics have been treated as an afterthought rather than a core design principle. When ethics is left until the end, it is always the weakest link. Companies find themselves reacting to scandals instead of building trust and resilience. Darden Report
That observation, from Darden’s LaCross Institute, is not particularly surprising. What’s striking is how consistently it describes the actual behaviour of organisations that publicly claim otherwise.
A 2025 McKinsey Digital report found that fewer than half of C-suite leaders involve nontechnical employees in the early stages of AI tool design — despite the same report emphasising the need for diverse perspectives and transparent communication about AI’s impact on jobs. The gap between stated values and operational reality is, in itself, an ethical failure. It signals to the workforce that participation is performative. Cerkl Broadcast
The consequences are measurable. Multiple senior safety leads departed OpenAI during 2024 and 2025, a pattern that has since been documented across other major AI firms. A Harvard Law Review analysis described this pattern as “amoral drift” — a gradual erosion of ethical commitments as equity valuations and competitive pressures crowd out principled dissent. When the people hired specifically to raise alarms keep leaving, it’s no longer a personnel problem. It’s a governance failure. Aicerts NewsHarvard Law Review
Still, the picture is more complicated than simple cynicism allows. Some companies are building ethics into their infrastructure in ways that are costly, unglamorous, and — crucially — not immediately profitable.
What Does Responsible AI Actually Look Like Inside an Organisation?
Can AI improve a company’s ethical culture? The short answer: yes, but only when the culture already has something to work with.
AI can surface bias in hiring algorithms, flag anomalous decision patterns in financial approvals, and create audit trails that make accountability visible where it was previously invisible. Businesses that implement bias audits, establish clear accountability for AI-driven decisions, and communicate openly about the uses and impacts of AI earn trust and differentiate themselves in a competitive market — because ethics is not just a compliance issue but a strategic advantage that strengthens relationships and reinforces brand credibility. McLane Middleton
That framing is becoming increasingly material rather than rhetorical. Under the EU AI Act, non-compliance with high-risk AI obligations can trigger fines of up to €35 million or 7% of worldwide turnover — a figure that concentrates the board’s attention in ways that a values statement never will. The Act elevates AI governance to board-level responsibility, shifting European AI governance from voluntary ethical guidelines to mandatory legal requirements. For multinational corporations, that shift isn’t confined to Brussels. It sets a de facto global standard. LegalNodesSecure Privacy
What follows, however, is a crucial distinction: compliance and ethics are not the same thing. A company can satisfy every regulatory requirement and still build an AI system that corrodes its own culture from within. Algorithmic management tools that track employee keystrokes, sentiment-analysis systems that flag dissent before it reaches a manager, performance models that optimise for measurable output while punishing everything human beings value about work — all of these can be technically compliant and culturally corrosive simultaneously.
In 2026, organisations that will win are those that lean into both AI and human strengths — treating “cognitive capital,” meaning uniquely human capabilities like ethical reasoning, creative synthesis, and stakeholder empathy, as measurable assets rather than soft intangibles. That’s a useful frame. It’s also, at the moment, more aspiration than practice. Senior Executive
The Second-Order Effects No One Is Pricing In
The downstream consequences of getting AI corporate ethics wrong are not primarily regulatory. They’re cultural, and culture moves slowly enough that organisations rarely recognise the damage until it’s structural.
Consider what happens to employee trust when AI systems make consequential decisions — about promotions, performance ratings, credit approvals — without meaningful human review. Studies show that employees are more likely to trust AI systems when organisations are transparent about their AI use and incorporate ethical guidelines into AI deployment, per KPMG research cited in peer-reviewed analysis. Remove that transparency, and trust doesn’t remain neutral — it actively degrades. Gapinterdisciplinarities
Key challenges with AI adoption in 2025 included unclear policies for data use leading to confusion and ethical concerns, job security fears, and significant changes in how employees work, make decisions, and interact. These aren’t abstract concerns. They translate into attrition, disengagement, and the quiet exit of the kind of employees who have enough self-respect to leave when they’re not trusted. Yardi Kube
Then there’s the reputational dimension. A Berkeley Haas analysis found that ninety percent of public criticisms toward AI touch on social norms and values — not technical performance. When an AI system fails ethically, it fails publicly. Single events have the potential to cause lasting damage to organisational reputation, and most companies remain strategically unprepared to respond. The Grok image scandal of early 2026 wasn’t a technical glitch. It was a cultural statement about what its developers believed was acceptable — and the market heard it clearly. berkeley
For investors, the calculus is shifting. A 2026 study examining 449 corporations across China and Europe found that corporate AI ethics practices significantly influence sustainable development outcomes and ESG performance, with the relationship moderated by international innovation capacity. In plain English: ethical AI deployment is becoming a predictor of long-term business value, not merely a cost centre. Wiley Online Library
The Counterargument: Ethics as Competitive Disadvantage
There’s a dissenting view worth taking seriously — not because it’s right, but because it’s prevalent enough to shape real decisions.
The argument runs roughly as follows: companies that impose rigorous ethical guardrails on their AI systems will be outcompeted by those that don’t. If a US firm restricts its models from certain military applications while a Chinese competitor does not, the US firm loses the contract. If a European fintech builds extensive bias audits into its credit model while a less scrupulous rival skips them, the rival processes applications faster and cheaper. Ethics, in this framing, is a luxury that market structure doesn’t permit.
It’s a coherent argument. It also describes exactly how industries create the conditions for their own eventual regulation — or collapse.
Speed may provide a temporary competitive edge, but it often backfires. Flawed launches damage consumer trust, attract lawsuits, and invite regulatory crackdowns. This creates reputational harm that outweighs early gains. The pharmaceutical industry learned this through thalidomide. The financial industry learned it through 2008. AI appears determined to learn it through a series of smaller, faster, harder-to-attribute disasters — the kind that don’t produce a single dramatic reckoning but accumulate into systemic distrust. Darden Report
There’s also a labour market dimension that the move-fast advocates consistently underweight. The engineers most capable of building responsible AI systems are also the most mobile and the most ethically discerning. They leave organisations whose stated values don’t match operational behaviour. And they talk.
What Remains When the Slide Deck Is Gone
The honest answer to whether AI can save a company’s soul is this: it can’t. Not on its own.
AI can enforce the values an organisation already holds. It can make ethical behaviour cheaper to maintain and easier to audit. It can surface the gap between what a company says it believes and what its systems actually do — which, if the leadership has the appetite to close it, is genuinely useful. But a technology cannot generate integrity in an organisation that has chosen not to have any. It can only scale what’s already there.
The companies that will navigate the next decade without a major ethical rupture aren’t the ones with the most sophisticated models. They’re the ones that show how accountability works — including who makes decisions, how ethical issues are escalated, and what remediation paths exist when things go wrong — as a matter of operational transparency rather than periodic disclosure. UNESCO
That’s not a technology problem. It never was.
The soul of a company, if it exists at all, is a daily political negotiation between power and principle. AI just makes the outcome arrive faster.
Discover more from The Economy
Subscribe to get the latest posts sent to your email.
-

 Markets & Finance5 months ago
Top 15 Stocks for Investment in 2026 in PSX: Your Complete Guide to Pakistan’s Best Investment Opportunities
-

 Analysis4 months ago
Top 10 Stocks for Investment in PSX for Quick Returns in 2026
-

 Analysis4 months ago
Brazil’s Rare Earth Race: US, EU, and China Compete for Critical Minerals as Tensions Rise
-

 Banks5 months ago
Best Investments in Pakistan 2026: Top 10 Low-Price Shares and Long-Term Picks for the PSX
-

 Investment5 months ago
Top 10 Mutual Fund Managers in Pakistan for Investment in 2026: A Comprehensive Guide for Optimal Returns
-

 Analysis4 months ago
Johor’s Investment Boom: The Hidden Costs Behind Malaysia’s Most Ambitious Economic Surge
-

 Global Economy5 months ago
15 Most Lucrative Sectors for Investment in Pakistan: A 2025 Data-Driven Analysis
-

 Global Economy5 months ago
Pakistan’s Export Goldmine: 10 Game-Changing Markets Where Pakistani Businesses Are Winning Big in 2025