
Analysis
Oil Falls to $70 as US-Iran Peace Talks Advance: Global Energy Markets
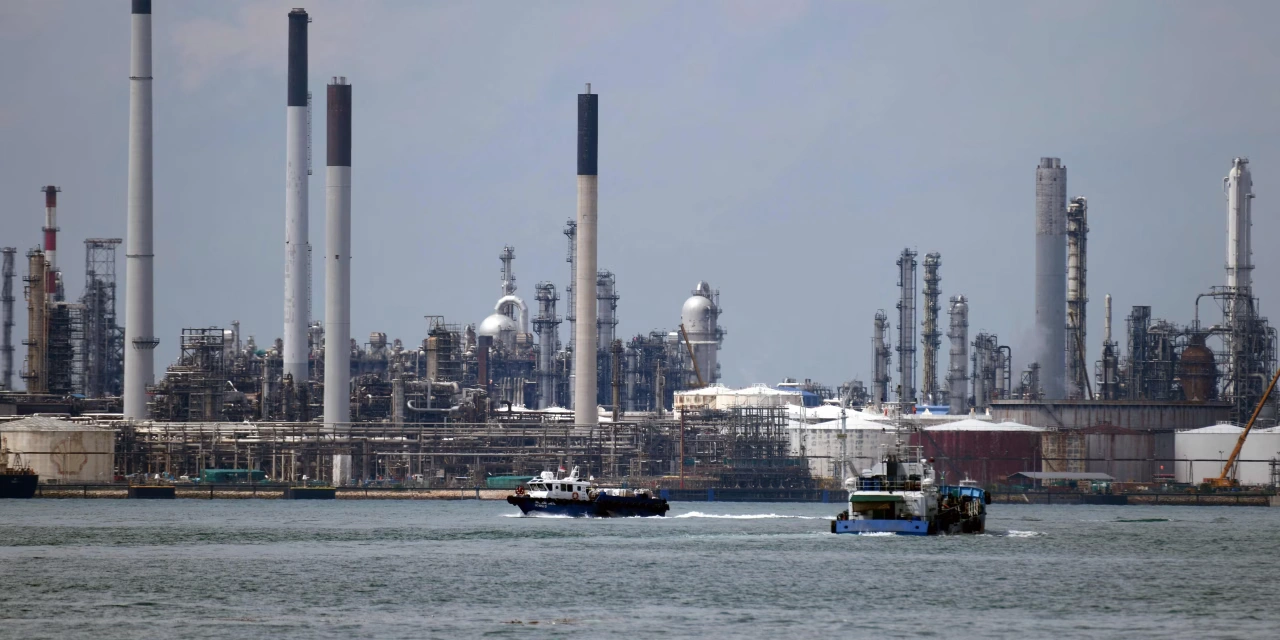
Oil prices hit their lowest level since the start of the Iran war as US-Iran peace talks progress and the Strait of Hormuz moves toward reopening. Here is a complete analysis of what this means for global energy prices, inflation, and the world economy.
The World Holds Its Breath at 21 Miles Wide
The Strait of Hormuz — a waterway barely 21 nautical miles wide at its narrowest navigable point, wedged between Iran and Oman — has held the global economy hostage since February 28, 2026. That was the day US and Israeli airstrikes against Iran triggered a closure that cut off roughly 20–25% of the world’s seaborne oil trade and approximately 20% of global LNG supplies — the largest energy supply disruption in modern history.
Now, as peace talks advance and a framework deal appears within reach, oil markets are beginning to price in relief — cautiously, nervously, and not without reason.
On June 24, 2026, international benchmark Brent crude futures fell 4.33% to settle at $73.74 per barrel — its lowest level since before US and Israeli airstrikes against Iran at the end of February. US WTI futures slid 3.92% to settle at $70.34 a barrel. President Trump confirmed that Iran had informed him there would be no tolls, insurance costs, or other charges for commercial ships passing through the Strait.
That is a long way down from the peak. At the height of the crisis, Brent had climbed above $150 per barrel. The journey back matters enormously for inflation, growth, and the global economic outlook.
How Bad Was the Crisis? The Numbers Tell the Story
The 2026 Strait of Hormuz closure represented an unprecedented peacetime disruption to global energy markets. At peak disruption, an estimated 14 million barrels per day of oil output was effectively shut in, representing approximately 14% of total global demand. Vessel traffic through the strait was diverted by over 90% as commercial operators suspended operations amid active hostilities.
The consequences cascaded across the global economy:
- The Dallas Federal Reserve modelled that the closure was expected to raise the average WTI oil price to $98 per barrel and lower global real GDP growth by an annualized 2.9 percentage points in Q2 2026.
- OPEC production fell more than 30% since the beginning of the war.
- Higher energy, fertilizer and transport costs intensified cost-of-living pressures worldwide, particularly for the most vulnerable developing economies.
- Pakistan, heavily reliant on imported oil, officially requested Saudi Arabia reroute oil supplies through the Red Sea port of Yanbu to bypass the closed strait.
In geopolitical terms, Asia absorbed approximately 84% of crude oil shipments through the Strait of Hormuz — making this fundamentally an Asian energy security crisis with global ramifications, from spiking LNG prices in Japan and South Korea to food inflation in import-dependent African and South Asian nations.
The Deal: What Has Actually Been Agreed?
The framework taking shape involves the United States lifting its blockade of Iranian ports in exchange for Iran ending its near-total closure of the Strait of Hormuz. However, oil market analysts caution that the “crude slide is entirely sentiment-driven” and that “the market is front-running the prospective reopening of the Strait of Hormuz and likely pricing in the best-case scenario for the normalisation of flows, which means the potential hiccups from logistics to renewed geopolitical tensions are not being adequately factored in.”
The reality is that even after a deal is signed, physical supply normalization will take far longer than markets assume. Experts estimate three to six months are required to get everything back to status quo, including time to bring production and refineries back online. Damaged Gulf infrastructure, mine-clearing operations in the strait, port backlog, and reactivating shuttered oil wells are not overnight tasks.
Price Scenarios: Where Does Oil Go From Here?
Wood Mackenzie’s scenario analysis provides the clearest framework for what comes next:
Quick Peace (base case, now most likely): Crude prices fall sharply following a deal, with Dated Brent easing to around $80 per barrel by end-2026 and declining further to $65 per barrel in 2027 as the oil market returns to oversupply. Global GDP growth slows from 3% in 2025 to 2.3% in 2026.
Partial Resolution (risk scenario): Oil and LNG supply shortages persist through Q3 2026, driving a shallow global recession in H2 2026. Global GDP growth falls below 2%.
Extended Disruption (tail risk): Brent crude could approach $200 per barrel by end-2026 if the Strait remains effectively closed — a scenario that would constitute the worst global recession since the 2008 financial crisis.
Markets are currently pricing heavily toward the Quick Peace scenario, which explains the sharp price decline this week. But the risk of diplomatic backsliding — evidenced by the already-contested interpretation of deal terms between Washington and Tehran — means volatility is far from over.
What This Means for Inflation and Central Banks
The fall in oil prices carries profound implications for global monetary policy. The Iran energy shock has been a primary driver of inflation running at 4.2% year over year in the United States — a key reason why new Fed Chairman Kevin Warsh’s first FOMC meeting resulted in nine of 18 officials projecting a rate hike in 2026.
If oil normalizes toward $70–80 and remains stable, the inflationary impulse from energy will fade significantly by Q4 2026, giving the Fed potential room to pause its hawkish posturing. Conversely, any diplomatic breakdown that sends oil back above $100 would turbocharge inflationary pressure and virtually guarantee rate hikes.
The Strait of Hormuz is no longer just an energy story. It is the single most important variable in global monetary policy for the second half of 2026.
FAQ
Q: Is the Strait of Hormuz open again? As of June 25, 2026, the Strait is operating under a partial quota system managed by Iran’s Revolutionary Guards Navy. A full commercial reopening is contingent on finalization of a peace framework. Full normalization of oil flows is expected to take 3–6 months after any deal.
Q: How much oil flows through the Strait of Hormuz? Before the crisis, approximately 20–21 million barrels of oil per day transited the Strait — roughly 20–25% of global seaborne oil trade and 20% of global LNG.
Q: Will oil prices fall further? Wood Mackenzie projects Brent crude easing to approximately $80 per barrel by end-2026 and $65 per barrel in 2027 under the Quick Peace scenario, as the oil market shifts back to oversupply.
Q: How has this affected Pakistan’s economy? Pakistan, as a major oil-importing nation, was severely impacted by energy price spikes and sought emergency rerouting of oil supplies via Saudi Arabia through the Red Sea port of Yanbu to bypass the strait closure.
Discover more from The Economy
Subscribe to get the latest posts sent to your email.


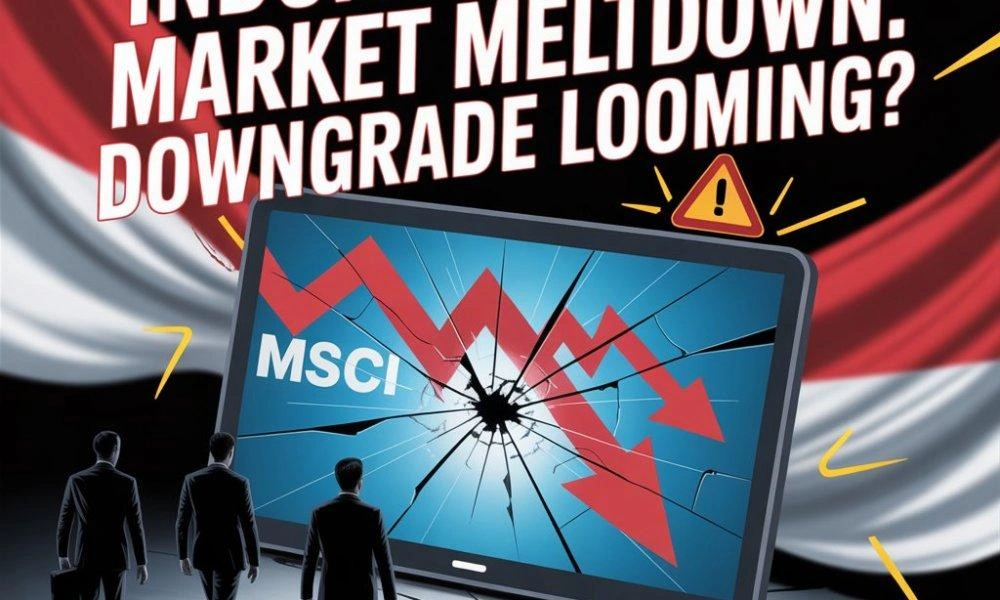
MSCI has extended its review of Indonesia’s emerging market status until November 2026. A downgrade to frontier market could trigger up to $60 billion in capital outflows from Southeast Asia’s largest economy. Here is everything you need to know.
A $1.5 Trillion Economy Facing a Classification Crisis
Indonesia has spent decades establishing itself as one of the world’s most important emerging markets. Now the country — Southeast Asia’s largest economy, with a GDP of about $1.5 trillion — risks losing that standing, potentially jeopardizing billions of dollars in foreign investment. The threat is not abstract. It is quantified, ongoing, and has already caused one of the worst stock market selloffs in Indonesian history.
In January 2026, index provider MSCI Inc. warned it might downgrade Indonesia’s equity market from “emerging” to “frontier.” Those classifications help determine how global investors allocate trillions of dollars across markets, influencing how easily governments and companies can raise capital. The announcement crystallized long-standing concerns over ownership concentration and market integrity, triggering immediate and severe market reaction.
MSCI’s January warning sent the Jakarta Composite Index into freefall, wiping out over $80 billion in market capitalization within days. The index has since fallen around 28% since the beginning of 2026 — one of the worst-performing major equity markets in the world.
What Is the Difference Between Emerging and Frontier Market Status?
These classifications are not mere labels. They determine where trillions of dollars of institutional capital flows. Emerging market status means that major global index funds — tracking indices used by pension funds, sovereign wealth funds, and institutional investors worldwide — include Indonesian assets in their portfolios. Frontier market status effectively removes Indonesia from the investable universe of most major institutional allocators.
The financial consequences of a downgrade would be immediate and severe. Analysts estimate that a full downgrade to frontier status could trigger foreign capital outflows ranging from $7.8 billion on the conservative end to as much as $60 billion on the dire end. Goldman Sachs estimated outflows of up to $13 billion in forced selling alone. This would cascade into a weaker rupiah, higher borrowing costs for the government and corporates, and slowing economic growth.
What Triggered the Warning? The “Deep-Fried” Governance Problem
MSCI’s concerns center on structural issues in Indonesia’s equity market that have worried analysts for years:
Ownership concentration: A small group of powerful conglomerates and tycoons control a disproportionate share of listed companies, limiting the “free float” available to ordinary investors.
Market integrity concerns: MSCI lowered Indonesia’s information flow criterion to “negative,” reflecting “structural issues in the opacity in shareholding structures and concerns about coordinated trading.”
Insufficient free float: Indonesia’s minimum free float requirement of 7.5% is well below the 15% MSCI now demands, and far below the 25% standard common in peers like India and Hong Kong.
The challenges run deeper than regulation. Indonesia’s President Prabowo Subianto has since taking office in October 2024 pursued high-spending populist policies that have pushed the fiscal deficit toward its legally mandated ceiling of 3% of GDP. The rupiah has depreciated by more than 14% since Prabowo took office. Investor confidence has been steadily eroding.
The November Deadline: What Happens Next
MSCI has extended its assessment period to November 2026, giving Indonesia a window to demonstrate meaningful progress on governance and transparency issues. The extension was greeted with a brief market rally — but the warning is explicit. If progress is deemed insufficient by November, MSCI “will consider a range of options for the appropriate treatment for the Indonesia market, potentially including a consultation on the reclassification.”
The Indonesian government’s regulatory response has been swift. New rules tightening market governance have been introduced. Plans to double the minimum free-float requirement to 15% are on the table. FTSE Russell maintained Indonesia’s Secondary Emerging status in April 2026 — a small positive signal.
Some analysts remain cautiously optimistic. Mirae Asset Sekuritas analyst Wilbert Arifin noted that of the 18 market accessibility indicators MSCI assessed, only the Information Flow indicator was downgraded — describing the “absence of broader deterioration” as “actually a more important signal.”
Others point out that the structural issues — tycoon-controlled markets, governance opacity, populist fiscal policies — cannot be fixed by November. They are embedded in Indonesia’s political economy.
The Broader Stakes: What a Downgrade Would Mean for Asia
Indonesia’s crisis is a warning sign for the entire emerging market ecosystem. As major economies like the United States and China increasingly compete for allies and supply chains, Southeast Asian nations have been positioning themselves as beneficiaries of supply chain diversification. A downgrade that signals governance failure and capital flight would undermine that positioning precisely when it matters most.
For global investors, Indonesia is a test case for a broader question: can populous, resource-rich developing nations modernize their financial markets fast enough to retain institutional capital during a period of intense global competition for investment?
The November 2026 deadline is not just about Indonesia’s stock market. It is about whether Southeast Asia’s largest economy can make good on its promise.
FAQ
Q: What is MSCI’s role in global finance? MSCI is the world’s most influential equity index provider. Its emerging market indices are tracked by trillions of dollars in institutional investment globally. When MSCI classifies or reclassifies a country’s market, it triggers automatic buying or selling by funds tracking those indices.
Q: How much has Indonesia’s stock market fallen? The Jakarta Composite Index (IHSG) has fallen approximately 28% year-to-date as of late June 2026, making it one of the worst-performing major equity markets in the world.
Q: What is a frontier market? Frontier markets are a step below emerging markets in the MSCI classification hierarchy — typically characterized by lower liquidity, higher transaction costs, and less institutional investor participation. Examples include countries like Vietnam, Kazakhstan, and Nigeria.
Q: When will MSCI make its final decision? MSCI extended its review to November 2026. If Indonesia does not demonstrate sufficient progress on market governance reforms by then, a formal reclassification consultation could be launched.
Discover more from The Economy
Subscribe to get the latest posts sent to your email.
AI
Micron’s $41.5 Billion Quarter: How AI’s Insatiable Memory Hunger Is Reshaping the Semiconductor Industry
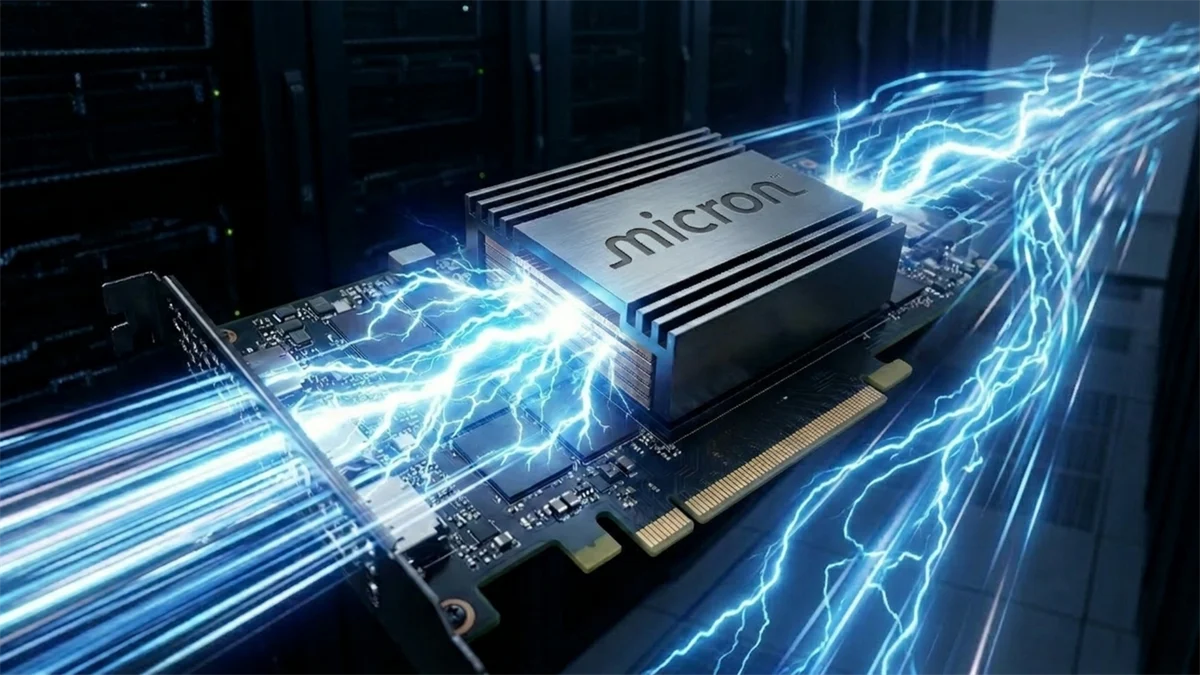
Micron Technology delivered a historic earnings blowout for Q3 fiscal 2026 — $41.46 billion in revenue, 84.9% gross margins, and a $50 billion Q4 outlook. Here’s what AI’s memory
One Quarter That Rewrote the Semiconductor Playbook
When Micron Technology reported its fiscal third-quarter results after the closing bell on June 24, 2026, it did not just beat Wall Street estimates — it shattered them. Micron posted adjusted earnings of $25.11 per share on revenue of $41.46 billion, both substantially above consensus expectations of $20.49 per share and $35.69 billion in sales. Shares surged 13–15% in after-hours trading.
The numbers are almost difficult to process in historical context. A year ago, Micron generated $9.30 billion in revenue in the same quarter. The company has now grown its quarterly revenue by 346% year over year — a trajectory that has no precedent in the modern semiconductor industry outside of a genuine structural demand revolution.
That revolution has a name: artificial intelligence.
The AI Memory Boom: Why Every Chatbot Needs a Chip
To understand Micron’s results, you need to understand why memory has become the strategic center of the AI economy. Large language models — the engines behind ChatGPT, Claude, Gemini, and every major AI application — require enormous amounts of fast, high-capacity memory to function. Every query processed, every image generated, every document analyzed passes through memory chips at extraordinary speeds.
High-Bandwidth Memory (HBM), the premium product at the heart of Micron’s AI-driven surge, stacks multiple memory chips vertically to deliver data to AI processors far faster than conventional DRAM. Demand for HBM has been so extreme that Micron’s HBM capacity for the entire year of 2026 has already been fully booked, with orders stretched to the end of the year.
This is not a temporary spike. It is a structural shift.
Breaking Down the Record Numbers
Revenue reached a record $41.5 billion, Micron’s fifth straight quarterly sales record. Gross margin climbed to 84.9% — a company record — helped by higher pricing and a favorable product mix. For context, gross margins of that magnitude are typically associated with luxury goods companies or dominant software platforms, not hardware manufacturers. The shift reflects just how dramatically Micron’s pricing power has grown.
The business unit breakdown tells the AI story clearly:
- Cloud Memory Business Unit: $13.77 billion in revenue (up from $7.75 billion the prior quarter), with an 83% gross margin
- Core Data Center: $11.52 billion (up from $5.69 billion the prior quarter)
- DRAM Revenue: $31.3 billion (versus expectations of $27.5 billion)
- NAND Storage Revenue: $9.9 billion
For Q4, Micron guided for approximately $50 billion in revenue and earnings per share of approximately $31 — guidance that implies further acceleration, not deceleration.
The Anthropic Deal and the Strategic Landscape
Buried in the earnings release was a detail with significant strategic implications: Micron announced a strategic supply agreement with Anthropic to provide the AI company with memory and storage chips. Anthropic — the company behind the Claude AI assistant and one of the world’s best-capitalized AI labs — joining Micron’s long-term customer list signals that memory supply agreements are becoming competitive assets in the AI race.
This is not merely a supply contract. It is a bet on the future architecture of AI infrastructure, where memory providers who can guarantee supply certainty become strategic partners, not commodity vendors.
The Ripple Effect: Consumer Tech Pays the Price
Micron’s extraordinary success for AI customers is, paradoxically, creating a painful squeeze for consumer electronics. The incredible demand from deep-pocketed data center builders has put pressure on electronics manufacturers who are battling to get their share of memory and storage chips for their devices. Video game consoles were among the first to take it on the chin, with Sony, Microsoft, and Nintendo each raising the prices of their systems.
Apple has signaled it will have to raise prices on some devices due to the shortage, and industry analysts have warned that laptop and smartphone sales could decline as consumers balk at higher prices. The AI economy is not costless — it redistributes wealth upward to chip manufacturers and hyperscalers while squeezing the consumer electronics ecosystem.
Market Implications: What This Means for Investors
Micron’s results validate several investment theses that have driven semiconductor stocks to extraordinary valuations in 2026:
1. AI demand is structural, not cyclical. Five consecutive quarterly records with accelerating growth are not a cycle — they represent a permanent upward shift in the baseline demand floor for memory.
2. Pricing power is durable. An 84.9% gross margin reflects a supply-constrained market where Micron holds enormous leverage over buyers.
3. Long-term supply agreements de-risk the model. CEO Sanjay Mehrotra highlighted “multi-year Strategic Customer Agreements” as a fundamental change to the business model — converting what was once a volatile cyclical business into something resembling a predictable subscription.
4. The memory shortage will ripple into consumer inflation. Higher device prices are coming, and they are effectively an AI infrastructure tax on consumers.
Key Numbers Summary
| Metric | Q3 FY2026 | Year-Over-Year Change |
|---|---|---|
| Revenue | $41.46 billion | +346% |
| Adjusted EPS | $25.11 | Massive beat |
| Gross Margin (adj.) | 84.9% | +45.9 ppts |
| Operating Cash Flow | $25.4 billion | Record |
| Free Cash Flow | $18.3 billion | Record |
| Q4 Revenue Guidance | ~$50 billion | Sequential growth |
FAQ
Q: Why is Micron’s revenue growing so fast? AI data centers require enormous quantities of high-bandwidth memory (HBM) to power large language models and other AI applications. Micron is one of only three major global DRAM suppliers (alongside Samsung and SK Hynix), and AI demand has massively outpaced supply capacity.
Q: What is HBM4? HBM4 (High-Bandwidth Memory 4th generation) is the latest generation of stacked memory chips designed specifically for AI processors. Micron has begun high-volume shipments of HBM4 for lead customer platforms as of Q3 2026.
Q: Will the memory chip shortage end soon? Industry analysts warn that supply shortages are likely to persist through 2027, as new fabrication facilities take years to build and qualify. This reinforces Micron’s pricing power for the foreseeable future.
Q: How does this affect average consumers? Memory shortages are causing price increases across consumer electronics — smartphones, laptops, and gaming consoles are all becoming more expensive as AI data centers absorb available chip supply.
Discover more from The Economy
Subscribe to get the latest posts sent to your email.
Analysis
Top 20 PSX Stocks for Investment in 2027: Your Complete Guide to Pakistan’s Best Investment Opportunities

The KSE-100 stands at 179,571 points as of June 24, 2026 — up 46% year-on-year. With SBP’s policy rate at 11.5% and inflation pressures expected to ease through FY27, selective PSX equities in banking, energy, technology, and real estate offer compelling risk-adjusted returns as we move into 2027. This guide covers all 20 picks, sector by sector, with price targets, risk factors, and a complete portfolio allocation framework for both beginners and experienced investors.
Table of Contents
- 2026 PSX Market Landscape: The Numbers You Must Know
- How We Selected These 20 Stocks
- Banking & Financial Services (Stocks 1–6)
- Energy & Oil/Gas (Stocks 7–9)
- Cement & Construction (Stocks 10–11)
- Fertilizer (Stocks 12–13)
- Technology & Telecoms (Stocks 14–15)
- Real Estate / REITs (Stocks 16–17)
- Consumer Goods & Pharmaceuticals (Stocks 18–19)
- Diversified Conglomerates (Stock 20)
- Portfolio Construction Framework
- Bonus: 5 Stocks to Watch (Not Yet Buy)
- Key Risks for 2027
- Beginner’s Fast Track: Start Here
- FAQ: 8 Questions Every Pakistani Investor Is Asking
2026 PSX Market Landscape: The Numbers You Must Know {#market-landscape}
578 clicks on our January guide. 90,386 impressions. And we’re just getting started.
The Pakistan Stock Exchange has done something extraordinary twice over — delivering back-to-back elite global performance while most investors were still debating whether to trust it. The benchmark KSE-100 Index closed at 179,571 points on June 24, 2026, gaining 1,878 points in a single session driven by buying interest across commercial banks, cement, fertilizer, oil and gas, and power generation stocks. Over the past 12 months, the index has surged 46%. From the April 8, 2026 low of 158,586, it has recovered sharply and is probing resistance at the 180,000-point level.
But the numbers that really matter for 2027 investors are not the index levels — they are the macroeconomic forces shaping what comes next.
Monetary Policy: A Rate Hike, Then a Pause — and Now a Pivot Opportunity
The SBP surprised markets on April 27, 2026, raising its benchmark policy rate by 100 basis points to 11.5% — its first hike since June 2023 — in response to the energy shock triggered by the Hormuz crisis. That rate has been held steady at the June 15, 2026 MPC meeting. Pakistan’s inflation surged from 7.3% in March to 10.9% in April and 11.7% in May 2026, driven primarily by transportation costs (up 36.8%) and housing and utilities (up 16.8%) — classic oil shock signatures, not structural demand-pull inflation.
The critical signal for investors: as the US-Iran peace framework takes hold and Brent crude retreats from its April peak of $113 toward the $77-80 range, inflation should moderate in H2 FY27. The SBP itself expects inflation to ease back toward the 5-7% target band over the medium term. That trajectory — inflation falling, rate cuts returning — is historically the single most powerful catalyst for PSX equity re-rating.
Forex Reserves: A Genuine Buffer
SBP foreign exchange reserves rose to $17.2 billion as of June 5, 2026, following successful completion of reviews under the IMF’s Extended Fund Facility (EFF) and Resilience and Sustainability Facility (RSF). The SBP projects reserves reaching $18 billion by end-June. This represents a transformation from the crisis lows of sub-$4 billion in 2023, and provides a credible shock absorber for external volatility.
GDP Growth: Holding Steady Under Pressure
Pakistan’s economy grew 3.7% in FY26 despite the Middle East conflict, supported by services, industrial expansion, and agriculture. Large-scale manufacturing expanded 6.5% during July-March FY26. The IMF’s programme remains on track. For equity investors, 3.7% GDP growth in an environment of external shocks is not a number to dismiss — it is a baseline that supports corporate earnings continuity.
The Investor’s Edge Entering 2027
Three macro tailwinds are converging: (1) oil prices declining from conflict highs, which directly improves corporate cost structures and squeezes inflation; (2) forex stability restoring confidence in PKR-denominated assets; and (3) an SBP that has signalled readiness to return to easing once inflation data cooperates. Patient investors who position in quality PSX equities now are buying the cycle trough — not the peak.
One honest caveat: the inflation shock has created real hardship for Pakistani households, and the economic recovery remains fragile. This is not a risk-free proposition. But risk and opportunity are two sides of the same coin at this stage of the cycle.
How We Selected These 20 Stocks {#methodology}
Every stock on this list passed a five-factor screening process. No shortcuts.
Financial Health: Three years of balance sheet analysis — consistency of profitability, manageable debt, strong free cash flow generation. Loss-making or highly leveraged companies did not make the cut regardless of their story.
Market Leadership: Sector leaders or credible second-placed challengers only. Companies with sustainable moats — scale, brand, technology, regulatory protection, or geographic reach — received priority over speculative names.
FY27 Growth Catalysts: Each stock needed at least two verifiable, dated drivers for the next 12-18 months. Vague “sector growth” reasoning was not accepted.
Valuation Discipline: We screened for stocks trading at reasonable P/E multiples relative to peers and growth prospects. Popular names trading at stretched valuations — regardless of quality — were de-prioritized.
Risk Assessment: Every pick’s exposure to inflation, rate policy, currency, regulatory change, and geopolitical spillover was evaluated. Stocks with concentrated or unmitigatable risks were excluded.
The result is a list spanning six sectors, combining blue-chip anchor positions with selective growth and income plays — structured for investors at every level.
Banking & Financial Services (Stocks 1–6) {#banking}
Pakistan’s banking sector is the engine of the KSE-100 and the sector most sensitive to the SBP rate cycle. With 11.5% the current policy rate and a return to cutting cycles anticipated as inflation normalizes, banks face a complex but ultimately positive FY27 environment: near-term NIM compression risk offset by credit growth and asset quality stability.

1. United Bank Limited (UBL) | Ticker: UBL
Current Market Position: UBL has cemented its place as the second most valuable listed company on PSX, with market capitalization approaching $3 billion. The stock has been a repeat index driver — contributing 920 points to the KSE-100 on June 24 alone alongside LUCK, PPL, FFC and MCB.
Why It’s a Top Pick for 2027: UBL operates over 1,765 branches nationwide with a diversified revenue mix across retail, corporate, treasury, and Islamic banking. Its six-fold market cap surge over two years reflects a fundamental re-rating, not speculative froth. The bank’s digital transformation has been among the most aggressive in the sector, positioning it to capture Pakistan’s rapidly expanding digital payments ecosystem estimated to process over PKR 100 trillion annually by 2027.
FY27 Catalysts:
- SBP rate cut cycle resumption expected H2 FY27 as inflation eases — boosts equity valuations and lending appetite
- Digital banking platform scaling, reducing branch cost burden and improving fee income
- Islamic banking window (UBL Ameen) growing double-digits, capturing market share from dedicated Islamic banks
Key Financial Metrics:
- Market Cap: ~$3 billion
- Dividend Yield: 6-8%
- 1-Year Return: 100%+
- ROE: Strong double-digit
Risk Factors: Rate hike cycle compresses net interest margins in the near term. Any deterioration in the corporate loan book amid economic uncertainty is a watchpoint. Competition from fully Islamic banks intensifying.
2027 Target Potential: 15-20% capital appreciation + 6-8% dividend yield
2. MCB Bank Limited (MCB) | Ticker: MCB
Current Market Position: MCB has delivered a 1-year change of 35%, and remains one of the most consistently profitable banks on the exchange. Market cap stands at approximately $1.2 billion, making it a large-cap anchor holding.
Why It’s a Top Pick for 2027: MCB’s focus on high-net-worth individuals and SME banking generates premium margins versus mass-market retail. It holds the highest asset quality metrics in the sector — consistently the lowest NPL ratio among major listed banks — a defensive characteristic that becomes premium in a volatile macro environment. MCB’s history of maintaining profitability across full economic cycles makes it the bank institutional investors quietly accumulate.
FY27 Catalysts:
- Upcoming earnings release with Q-on-Q improvement expected as treasury operations benefit from rate environment
- High ROE supports book value compounding even without multiple re-rating
- Dividend track record — one of the most reliable payers on PSX — attracts income investors in a volatile rate environment
Key Financial Metrics:
- P/E: Sub-10x (attractive vs. historical average)
- Dividend Yield: 8-10%
- NPL Ratio: Among sector’s lowest
Risk Factors: Limited branch expansion vs. larger peers constrains retail growth. Corporate loan concentration means individual large defaults have outsized impact.
2027 Target Potential: 12-18% appreciation + high dividend yield
3. Meezan Bank Limited (MEBL) | Ticker: MEBL
Current Market Position: Pakistan’s largest Islamic bank with market cap of PKR 923 billion (approximately $3.3 billion at current rates). MEBL reached its all-time high of Rs. 525 in April 2026.
Why It’s a Top Pick for 2027: Islamic banking is structurally the fastest-growing segment of Pakistan’s financial system — and Meezan has no meaningful conventional bank competitor in this space. The demographic tailwind is powerful: Pakistan’s 240+ million population skews young and increasingly prefers Shariah-compliant products. Meezan’s net income of PKR 22.31 billion in Q1 2026 represents consistent compounding. The bank’s dividend yield of 6.3% (2025) with a 55% payout ratio leaves significant room for growth reinvestment.
FY27 Catalysts:
- Islamic finance market share expansion as conventional banks struggle to match Meezan’s product depth
- Q3 FY26 earnings release (August 14, 2026) expected to confirm trajectory
- Takaful and Islamic wealth management verticals are still early-stage — significant optionality
Key Financial Metrics:
- Market Cap: PKR 923B / ~$3.3B
- Dividend Yield: 6.3%
- 1-Year Market Cap Growth: +78.62%
- Employees: 21,310
Risk Factors: At this size, growth rates will naturally moderate. Regulatory changes to Islamic banking framework could create compliance costs. Geographic concentration in urban markets.
2027 Target Potential: 15-22% upside
4. Habib Bank Limited (HBL) | Ticker: HBL
Current Market Position: Pakistan’s largest bank by assets and deposits, with market cap of approximately PKR 474 billion. HBL operates the country’s largest international banking network with presence across multiple continents.
Why It’s a Top Pick for 2027: HBL’s overseas operations provide geographic diversification that no domestic bank can match. International branches capture Pakistan’s massive remittance flows — over $30 billion annually — which are both a direct revenue source and a foreign exchange stabilizer for the country. Its government ownership stake provides implicit backing. The dividend yield of 5-9% combined with international diversification makes HBL the blue-chip anchor of institutional PSX portfolios.
FY27 Catalysts:
- Remittance corridor growth as Pakistan diaspora in Gulf and Europe continues sending record inflows
- Digital banking investment reducing cost-to-income ratio over medium term
- Government backing provides effective floor on valuation during market stress
Key Financial Metrics:
- Market Cap: ~PKR 474B
- Dividend Yield: 5-9%
- Assets: Pakistan’s largest
Risk Factors: Sovereign securities exposure means HBL is sensitive to government rating and fiscal dynamics. International operations face jurisdiction-specific regulatory risk.
2027 Target Potential: 10-15% + dividends
5. Bank Alfalah Limited (BALF) | Ticker: BALF
Current Market Position: Bank Alfalah has emerged as a consistent index contributor — appearing prominently in recent market session reports as a heavyweight driver. The bank has aggressively expanded its digital banking and branchless banking operations.
Why It’s a Top Pick for 2027: Bank Alfalah’s Alfalah Mobi and digital channels have seen user growth outpacing the sector, positioning it at the intersection of traditional banking and fintech — a rare combination among listed banks. Its tie-up with Abu Dhabi Group (its majority shareholder) provides access to international capital and strategic guidance unavailable to locally-owned peers.
FY27 Catalysts:
- Mobile banking penetration growth as Pakistan’s smartphone user base crosses 100 million
- International remittance product expansion leveraging Abu Dhabi Group relationships
- Consumer credit growth as inflation eases and purchasing power recovers
Key Financial Metrics:
- Dividend Yield: 5-7%
- Digital banking users: Growing double-digit YoY
Risk Factors: Consumer banking concentration means NPL sensitivity to household income stress. Marketing investment in digital creates near-term cost pressure.
2027 Target Potential: 12-18% appreciation
6. National Bank of Pakistan (NBP) | Ticker: NBP
Current Market Position: NBP holds market cap of approximately $1.84 billion as Pakistan’s largest state-owned commercial bank, making it the government’s primary banking arm.
Why It’s a Top Pick for 2027: NBP trades at the deepest discount to book value among major banks — a classic value play for investors willing to hold through near-term turbulence. The government’s commitment to improving state enterprise performance, combined with NBP’s unrivalled branch network in underserved rural and semi-urban markets, creates a compelling turnaround opportunity. The bank’s exposure to government salary disbursements, pension payments, and tax collection makes it structurally indispensable.
FY27 Catalysts:
- Governance reform programme under government’s SOE privatization and improvement agenda
- Rural banking market — significantly underpenetrated — represents decades of growth runway
- Any improvement in return on equity from current depressed levels has significant valuation impact
Key Financial Metrics:
- Market Cap: ~$1.84B
- Trades at discount to book value
- Dividend potential: Improving
Risk Factors: Government influence over lending decisions creates asset quality risk. Political interference in management is a recurring concern.
2027 Target Potential: 18-28% (value recovery upside — higher risk, higher reward)
Energy & Oil/Gas (Stocks 7–9) {#energy}
Pakistan’s energy sector enters FY27 with a complex backdrop: Brent crude easing from its Hormuz crisis peak (which briefly hit $126.41), domestic gas supply constraints persisting, and a government committed to reducing circular debt. For equity investors, the key thesis is compelling dividend yields from cash-generative producers plus exploration optionality.
7. Oil and Gas Development Company (OGDC) | Ticker: OGDC
Current Market Position: OGDC is Pakistan’s most valuable company by market capitalization at approximately $4 billion+. It controls over 40% of Pakistan’s awarded exploration acreage, making it the cornerstone of the country’s domestic energy production.
Why It’s a Top Pick for 2027: OGDC’s combination of current cash flows, dividend yield, and exploration optionality is unmatched on the exchange. As the largest E&P company, it benefits from economies of scale that smaller producers cannot replicate. Government majority ownership ensures regulatory stability. With international oil prices stabilizing in the $75-90 range post-Hormuz, OGDC’s production economics remain highly profitable on a unit-cost basis.
FY27 Catalysts:
- New exploration discoveries across awarded acreage (high-impact upside)
- Stabilizing international oil prices supporting margin visibility
- Government’s energy security push incentivizing domestic production over imports
Key Financial Metrics:
- Market Cap: $4B+ (PSX’s largest)
- Dividend Yield: 6-8%
- Exploration Acreage: Pakistan’s largest
Risk Factors: Gas pricing policy disputes with government reduce margin predictability. Exploration wells are binary — failed wells write off capital. Oil price volatility directly impacts profitability.
2027 Target Potential: 8-13% appreciation + 6-8% dividend yield
8. Pakistan Petroleum Limited (PPL) | Ticker: PPL
Current Market Position: PPL holds market cap exceeding $1.63 billion and featured among June 24’s top index contributors alongside UBL, LUCK, FFC and MCB — a sign of strong institutional demand.
Why It’s a Top Pick for 2027: PPL’s asset base of high-quality, low-cost producing gas fields generates strong, predictable free cash flow. Its joint ventures with international oil companies (IOCs) bring technical sophistication and risk-sharing unavailable to standalone domestic operators. PPL’s proven reserve base provides long-dated production visibility that underpins dividend sustainability.
FY27 Catalysts:
- Gas demand growth from industrial recovery in H2 FY27
- Potential upward revision to gas well-head prices under SBP framework
- International joint venture discoveries providing exploration upside
Key Financial Metrics:
- Market Cap: $1.63B
- Dividend Yield: 7-9%
- 1-Year Return: ~40%
Risk Factors: Gas pricing disputes are the sector’s chronic headache. Reserve replacement requires continuous capital expenditure.
2027 Target Potential: 10-15% + generous dividends
9. Mari Petroleum Company Limited (MARI) | Ticker: MARI
Current Market Position: MARI posted a 113% one-year return — the highest among PSX’s top 10 companies by market cap — with market cap at approximately $2.7 billion.
Why It’s a Top Pick for 2027: Mari’s combination of producing assets and an aggressive exploration programme in frontier acreage offers one of the most attractive risk/reward profiles in the sector. Its Sui gas field operations and associated infrastructure give it a first-mover advantage in some of Pakistan’s most productive producing regions. After a 113% run, some mean-reversion risk exists — but the fundamental earnings engine remains strong.
FY27 Catalysts:
- Production growth from existing fields with optimized recovery techniques
- Frontier exploration results — any discovery here is a material stock catalyst
- Gas pricing environment improving as circular debt reduction progresses
Key Financial Metrics:
- Market Cap: $2.7B
- 1-Year Return: 113%
Risk Factors: After a 113% run, valuation risk is higher than peers. Exploration is inherently uncertain.
2027 Target Potential: 8-12% (more moderate after massive run; better as hold than new entry)
Cement & Construction (Stocks 10–11) {#cement}
Pakistan’s construction sector benefits from CPEC Phase II infrastructure, the government’s Naya Pakistan Housing Programme, and post-flood reconstruction demand. Cement stocks are cyclical but the long cycle here remains positive.
10. Lucky Cement Limited (LUCK) | Ticker: LUCK
Current Market Position: Pakistan’s largest cement manufacturer with market cap of $1.83 billion. LUCK appeared among June 24’s top index contributors with 920 collective points added by the LUCK-UBL-PPL-FFC-MCB group.
Why It’s a Top Pick for 2027: Lucky’s vertically integrated operations and international presence (Congo, Iraq) differentiate it from pure domestic plays. Its 34% earnings growth in 2024 demonstrates operational leverage. As Pakistan’s infrastructure pipeline reaccelerates in FY27 with IMF-backed fiscal consolidation reducing uncertainty, construction demand is the natural beneficiary.
FY27 Catalysts:
- CPEC Phase II construction ramp-up in H1 FY27
- Low-cost housing schemes creating steady volume demand
- International operations providing PKR-independent revenue stream
Key Financial Metrics:
- Market Cap: $1.83B
- 1-Year Earnings Growth: 34%
- Geographic Diversification: Pakistan + Congo + Iraq
Risk Factors: Energy costs are cement’s largest variable cost — any reversal in oil/coal price decline hurts margins. Overcapacity among sector players can trigger price competition.
2027 Target Potential: 12-18% upside
11. D.G. Khan Cement Company Limited (DGKC) | Ticker: DGKC
Current Market Position: DGKC is one of the sector’s large-cap players, with plants strategically located near key limestone reserves in D.G. Khan — a geographic advantage that keeps input costs structurally lower than peers.
Why It’s a Top Pick for 2027: DGKC’s cost structure advantage translates into above-sector margins during cyclical downturns, making it the defensive cement play. The company has reduced debt materially over the past two years, improving financial flexibility. Its strategic investment in power generation reduces its exposure to grid electricity tariff volatility — a critical differentiator as industrial electricity costs remain elevated.
FY27 Catalysts:
- Debt reduction freeing cash for dividends and capex
- Self-generated power reducing per-unit production cost
- Southern Pakistan infrastructure projects (ports, highways) driving regional demand
Key Financial Metrics:
- Cost Structure: Among sector’s lowest
- Captive Power: Partially insulated from tariff hikes
- Debt Profile: Improving
Risk Factors: Concentrated geographic exposure. Competition from expanding Lucky Cement capacity.
2027 Target Potential: 10-16% growth potential
Fertilizer (Stocks 12–13) {#fertilizer}
Pakistan’s agricultural economy requires expanding fertilizer use to meet food security targets. The sector’s demand is structurally tied to government policy on agriculture — a sector that consistently receives priority.
12. Fauji Fertilizer Company (FFC) | Ticker: FFC
Current Market Position: FFC holds market cap of $1.96 billion and posted a 140% one-year return on the back of 81% profit growth. It featured prominently in June 24’s index rally — a sign of continued institutional preference.
Why It’s a Top Pick for 2027: FFC dominates Pakistan’s urea market with the country’s largest production capacity. December 2025 urea sales hit an all-time high of 1,356,000 tonnes, demonstrating the depth of agricultural demand. The company’s vertical integration — from ammonia to urea — gives it cost advantages that take years to replicate. Its dividend policy is among the most generous on the exchange, making it ideal for income-oriented investors.
FY27 Catalysts:
- Agricultural focus in FY27 budget supporting fertilizer demand
- Government subsidies on urea maintaining affordability and volume
- Expansion into food, DAP and power segments diversifying revenue
Key Financial Metrics:
- Market Cap: $1.96B
- 1-Year Return: 140%
- Profit Growth (FY24): 81%
- December 2025 Urea Sales: All-time high
Risk Factors: Government pricing policy on fertilizer is the key swing factor. Gas supply disruptions can halt production. After a 140% run, valuation needs monitoring.
2027 Target Potential: 12-18% (post-rally, more moderate but fundamentals intact)
13. Engro Fertilizers Limited (EFERT) | Ticker: EFERT
Current Market Position: EFERT is a major fertilizer producer operating under the Engro Corporation umbrella, with market cap in the $1-1.5 billion range and a recent single-session gain of 10.0% demonstrating strong momentum.
Why It’s a Top Pick for 2027: EFERT’s state-of-the-art production facilities and Engro’s operational culture give it an efficiency edge that smaller producers cannot match. Its distribution network — one of the most extensive in Pakistan’s agri-input market — creates a durable moat. The company benefits from Engro Corporation’s group-level balance sheet strength and access to capital at favorable terms.
FY27 Catalysts:
- Agricultural credit expansion supporting farmer purchasing power for inputs
- New product launches in specialty fertilizers targeting premium crop segments
- Working capital position improved vs. prior year, reducing financing costs
Key Financial Metrics:
- 1-Session Gain: +10% (institutional demand signal)
- Production: State-of-the-art facilities with recent efficiency upgrades
Risk Factors: Gas supply constraints can limit production in peak demand periods. Competition from FFC on pricing and distribution coverage.
2027 Target Potential: 12-18% upside
Technology & Telecoms (Stocks 14–15) {#technology}
Pakistan’s IT sector is the economy’s fastest-growing export earner, with ICT exports growing robustly and a government that has prioritized the digital economy. Listed technology plays are still few in number — but the ones that exist offer genuine growth at reasonable multiples.
14. NetSol Technologies Limited (NETSOL) | Ticker: NETSOL
Current Market Position: NetSol Technologies (also listed on NASDAQ as NTWK) reported record quarterly revenue in Q3 FY2026, with revenue of PKR 3.57 billion in Q1 CY2026 — up 48.83% year-over-year. The LTM revenue is PKR 12.64 billion, up 40.82% annually.
Why It’s a Top Pick for 2027: NetSol is a globally operating software company with its largest development centre in Lahore — and its clients are blue-chip multinationals in automotive finance across Asia-Pacific and Europe. Its Transcend Finance platform recently went live with a tier-one US auto captive finance company in China under a $10 million+ contract. A multi-million-dollar renewal with a UK tier-one multinational bank confirms the quality of its client relationships. For investors, this is rare: a Pakistani-listed company generating the majority of its revenues in USD, insulating it from PKR depreciation risk.
FY27 Catalysts:
- China market expansion — Transcend Finance platform gaining traction with OEM-linked captive finance companies
- AI-enabled product suite (it is now marketing itself as an “AI-enabled solutions” provider) commanding premium pricing
- NASDAQ listing (as NTWK) improves access to international institutional investors
Key Financial Metrics:
- LTM Revenue: PKR 12.64B (+40.82% YoY)
- EBITDA: PKR 3.12B; EBITDA Margin: 11.49%
- Employees: 1,220
- 52-Week Range: Rs. 87.66 – Rs. 168.60
Risk Factors: Revenue concentration in auto/leasing finance verticals means sector downturns in client industries have direct impact. USD revenue creates translation gains during PKR weakness but base costs are PKR — margin volatility is real. After a pullback from highs, technical setup needs monitoring.
2027 Target Potential: 20-35% (highest growth potential on the list; higher risk commensurate)
15. Pakistan Telecommunication Company Limited (PTCL) | Ticker: PTC / PTCA
Current Market Position: PTCL is trading at PKR 68.19 (Class A shares), with a 52-week range of Rs. 21.21 to Rs. 70.00 — meaning investors who bought at the 52-week low have seen a 221% return. Market cap stands at PKR 344 billion.
Why It’s a Top Pick for 2027: PTCL’s privatization to Etisalat (now e&, Abu Dhabi’s international telecom giant) marked a turning point. Under e& management, PTCL is executing a digital transformation that is producing genuine results — Q1 2026 net income of PKR 3.07 billion, more than double the prior quarter’s PKR 1.43 billion. Its broadband infrastructure (FTTH rollout and 5G preparation) positions it for the data economy Pakistan is building. Earnings report expected July 15, 2026 is the next major catalyst.
FY27 Catalysts:
- FTTH (fibre-to-the-home) rollout monetization as subscriber additions accelerate
- Enterprise ICT services growing as Pakistani businesses digitize operations
- 5G spectrum allocation expected in FY27 — first-mover positioning as state telco
Key Financial Metrics:
- Market Cap: PKR 344B
- Q1 2026 Net Income: PKR 3.07B (+115% QoQ)
- 52-Week Return from Low: +221%
- Earnings Release: July 15, 2026
Risk Factors: Intense competition from Jazz and Zong in mobile data. Infrastructure capex is heavy and ongoing. Regulatory risk from PTA on pricing.
2027 Target Potential: 15-25% appreciation
Real Estate / REITs (Stocks 16–17) {#reits}
Pakistan’s REIT market is still nascent — but that is exactly the opportunity. Two listed REITs offer income investors a rare combination: real estate exposure, Shariah-compliance (for DCR), and income distribution requirements mandated by SECP.
16. Dolmen City REIT (DCR) | Ticker: DCR
Current Market Position: DCR is Pakistan’s first listed REIT and holds a market cap of PKR 80.875 billion. Current price is PKR 36.37-36.39, with a dividend yield of 7.04% and AAA(rr) rating — the highest available for REIT schemes. The annualized dividend yield based on September 2025 quarterly distributions stands at 25.20% of the 2026 unit price on an annualized basis from the recent quarter.
Why It’s a Top Pick for 2027: Dolmen Mall Clifton operates at 90%+ occupancy with 130 retail outlets anchored by Hyperstar and international brands (Mango, Next, Nike, Nine West). Rental income is the stable, inflation-indexed revenue stream that equity investors rarely get access to directly. DCR’s Shariah-compliance opens it to Islamic investors who cannot hold conventional bank shares — widening its investor base structurally. For income investors, a 7%+ yield on a AAA-rated, legally required distribution instrument is difficult to beat in the current market.
FY27 Catalysts:
- Rental income renegotiation cycles typically provide 10-15% annual increases in a 10-11% inflation environment
- Occupancy stability above 90% confirms consumer spending resilience despite macro pressures
- SECP’s REIT framework expansion expected to attract new institutional investors to the sector
Key Financial Metrics:
- Market Cap: PKR 80.875B
- Dividend Yield: 7.04%
- Rating: AAA(rr)
- Occupancy: 90%+
- Shariah-compliant: Yes
Risk Factors: Concentrated in two properties (Dolmen Mall Clifton + Harbor Front). Any sustained decline in retail footfall (economic downturn) directly hits rental income. Capital appreciation is limited compared to equity stocks.
2027 Target Potential: 6-10% capital appreciation + 7%+ income yield = total return of 13-17%
17. TPL Properties Limited (TPLP) | Ticker: TPLP
Current Market Position: TPL Properties is the commercial real estate arm of the TPL Group, operating premium office and retail space in Karachi’s Dolmen City complex. TPL Corp (TPL) was the volume leader at PSX in the week of June 22, 2026 — a sign of retail and institutional interest in the entire TPL ecosystem.
Why It’s a Top Pick for 2027: TPLP provides exposure to Pakistan’s growing commercial real estate demand at the premium end — Grade-A office space in Karachi. As international businesses and multinationals establish or expand Pakistan operations (particularly in the tech and finance sectors), demand for quality commercial space structurally outpaces supply. TPLP’s premium location — Sky Tower, East Wing, Dolmen City — gives it pricing power that secondary location operators cannot match.
FY27 Catalysts:
- Commercial real estate demand growth from tech companies, financial services firms, and MNC expansions
- FDI inflows increasing post-IMF programme stabilization driving Grade-A office demand
- Potential REIT conversion providing liquidity event and re-rating
Key Financial Metrics:
- Premium location: Dolmen City, Clifton, Karachi
- Tenant mix: Commercial, financial, and multinational corporations
Risk Factors: Less established income distribution framework than DCR. Developer concentration risk. Real estate market sensitivity to interest rates and economic activity.
2027 Target Potential: 15-22% appreciation potential
Consumer Goods & Pharmaceuticals (Stocks 18–19) {#consumer}
Defensive plays for portfolio balance — companies whose revenues persist regardless of economic cycles, providing ballast when cyclical sectors correct.
18. Nestlé Pakistan Limited (NESTLE) | Ticker: NESTLE
Current Market Position: Nestlé Pakistan holds market cap exceeding $1 billion, backed by the global Nestlé corporation — the world’s largest food and beverage company.
Why It’s a Top Pick for 2027: Nestlé’s portfolio (Nido, Everyday, Maggi) has spent decades building brand loyalty that transcends economic cycles. Multinational parentage gives access to global innovation pipelines, ensuring continuous product launches ahead of local competitors. For investors seeking downside protection, Nestlé’s earnings visibility is among the highest on the exchange. Its consistent dividend track record appeals to conservative investors who need PSX exposure without cyclical volatility.
FY27 Catalysts:
- Pakistan’s growing middle class increasing premium dairy and nutrition product consumption
- E-commerce channel expansion giving direct access to urban consumers
- Pricing power exercised successfully through inflation period — margins defending
Key Financial Metrics:
- Market Cap: $1B+
- Dividend Consistency: Multi-decade track record
- Parent: Global Nestlé — world’s largest food company
Risk Factors: High P/E multiple limits capital appreciation upside. Rupee depreciation raises imported input costs. Local brand competition intensifying on price.
2027 Target Potential: 8-12% steady growth + dividends
19. Abbott Laboratories Pakistan (ABOT) | Ticker: ABOT
Current Market Position: Abbott Pakistan holds market cap of $371 million, engaged in manufacturing, importing, and marketing pharmaceutical, diagnostic, nutritional, diabetic care, and consumer products.
Why It’s a Top Pick for 2027: Pakistan’s pharmaceutical exports growth hit a two-decade high of 34% in FY25, and Abbott’s diversified portfolio across pharmaceuticals, diagnostics, nutritionals, and diabetes care gives it multiple growth vectors simultaneously. The global Abbott parent ensures pipeline access — products and technologies not available to domestic pharmaceutical manufacturers. Pakistan’s expanding middle class, increasing health awareness, and rising chronic disease prevalence create decades of structural demand growth.
FY27 Catalysts:
- Diabetes care products — Pakistan has one of the world’s highest Type 2 diabetes prevalence rates — structurally growing market
- Pharmaceutical export growth benefiting from rupee competitiveness and global demand for generics
- Nutritional supplements and diagnostic products expanding into Tier-2 cities
Key Financial Metrics:
- Market Cap: $371M
- Revenue Diversification: Pharma + Diagnostics + Nutritionals + Diabetes Care
- Sector Tailwind: Pakistan pharma exports at 34% 2-decade high
Risk Factors: DRAP price controls on essential medicines limit pricing power. Generic competition erodes older product margins. Rupee impact on imported finished goods.
2027 Target Potential: 12-16% appreciation
Diversified Conglomerates (Stock 20) {#conglomerates}
20. Engro Corporation Limited (ENGRO) | Ticker: ENGRO
Current Market Position: Engro Corporation is Pakistan’s premier conglomerate with holdings spanning fertilizers (EFERT), energy (Engro Energy), petrochemicals, food, and increasingly digital/fintech ventures.
Why It’s a Top Pick for 2027: Owning Engro is owning a diversified bet on Pakistan’s economy — with professional management, a track record of value creation through incubation and selective divestiture, and a corporate culture that attracts top talent. When one sector faces headwinds, Engro’s portfolio diversification cushions the blow. Its food business is growing rapidly in dairy and packaged foods, while energy investments are contributing meaningfully. For investors who want Pakistan upside without sector concentration, Engro is the one-stock answer.
FY27 Catalysts:
- Engro Foods IPO or monetization event — potential value unlock
- Energy transition investments (LNG, renewables) gaining revenue traction
- Digital financial services ventures early-stage but strategically important
Key Financial Metrics:
- Portfolio: Fertilizers + Energy + Petrochemicals + Foods + Digital
- Management: Among Pakistan’s highest-regarded executive teams
- Diversification: No single business unit >40% of earnings
Risk Factors: Conglomerate discount means P/E never fully reflects sum-of-parts value. Complex structure makes fundamental analysis harder for retail investors.
2027 Target Potential: 10-16% growth
Portfolio Construction Framework {#portfolio}
You don’t need all 20. You need the right combination. Here’s the allocation architecture:
| Portfolio Type | Stocks | Allocation |
|---|---|---|
| Core Anchors | UBL, MCB, MEBL, OGDC, PPL | 45-50% |
| Growth Engine | PTCL, NETSOL, FFC, EFERT, LUCK | 25-30% |
| Income / Defensive | DCR, NESTLE, ABOT, HBL | 15-20% |
| Value/Contrarian | NBP, TPLP, DGKC, MARI | 10-15% |
Allocation Rules:
- Maximum 30% in any single sector — no exceptions
- No single stock above 15% of portfolio
- Review and rebalance quarterly — trigger when any position moves ±5% of its target weight
- Reinvest dividends for compounding benefit unless income is needed
For Conservative Investors (Low Risk Tolerance): Focus on UBL, MCB, HBL, OGDC, DCR, NESTLE — 6 stocks across 4 sectors. Prioritize dividend yield. Expected total return: 12-16% annually.
For Balanced Investors: Build the core anchor basket, add PTCL, FFC, and LUCK for growth. Expected total return: 15-20%.
For Aggressive Investors: Full 20-stock exposure including NETSOL, NBP (value play), TPLP, and MARI. Accept 30-40% drawdown risk for 25-35% upside potential.
Bonus: 5 Stocks to Watch But Not Yet Buy {#bonus}
These names are on the radar but require one more earnings confirmation or a price pullback before entry:
- K-Electric (KEL): Volume leader on PSX in recent sessions (112M shares traded June 24). Circular debt resolution is the catalyst — watch for government announcement.
- Pakistan State Oil (PSO): 7/7 analyst Strong Buy rating but pending clarity on circular debt receivables.
- Colgate-Palmolive Pakistan (COLG): Strong brand, multinational backing — wait for a 10-15% pullback from current levels.
- WorldCall Telecom (WTL): A high-volume speculative play — not for conservative investors but watch volume patterns for signal.
- Systems Limited (SYS): Pakistan’s largest IT company by revenue — a core holding once valuation normalizes after the recent run.
Key Risks for 2027 {#risks}
Inflation Persistence: SBP warns inflation will remain in double digits through parts of FY27. If energy prices re-spike (another Hormuz episode), rate cuts will be delayed and equity multiples will face pressure.
PKR Depreciation: Despite improved reserves, PKR is sensitive to current account deterioration. A resumption of rupee weakness increases import costs for companies dependent on foreign inputs.
Political Uncertainty: Pakistan’s political environment remains fluid. Policy reversals or institutional uncertainty can spike risk premiums quickly.
Global Recession Risk: If US-led recession materializes in H2 2026, Pakistani exports (particularly IT services and textiles) face demand compression. Remittances could also soften.
Geopolitical Relapse: The US-Iran peace framework remains preliminary. Any relapse into conflict would re-spike oil prices and reverse Pakistan’s improving macro trajectory in weeks.
Climate/Monsoon Risk: NDMA warnings of a wetter-than-normal monsoon season in 2026 (up to 26% above normal) create flood risk for agricultural output and physical infrastructure.
Beginner’s Fast Track: Start Here {#beginners}
If you have never bought a share in your life, this section is for you. Skip it if you are already a PSX investor.
Step 1: Open a Brokerage Account Register with a SECP-licensed broker. The largest options include AKD Securities, Topline Securities, JS Global, and Arif Habib Limited. You need a CNIC, bank account, and completed KYC form. The process takes 3-5 working days.
Step 2: Start With Three Stocks Do not try to buy all 20 at once. Begin with UBL, OGDC, and DCR — one bank, one energy company, one REIT. These three give you immediate sector diversification, dividend income, and manageable complexity.
Step 3: Invest Fixed Amounts Monthly The most proven strategy for beginners is rupee-cost averaging: invest a fixed amount (say PKR 10,000-20,000) every month regardless of market levels. Over 12-24 months, this smooths your entry price and removes the emotional burden of timing decisions.
Step 4: Never Invest Money You Need Within Three Years PSX stocks can and do fall 30-40% during corrections. Only invest capital that can stay invested through volatility.
Step 5: Read Before You React When the market falls sharply, read — do not sell. Check if the business fundamentals of your holdings have changed. If they haven’t, the price drop is noise, not signal.
FAQ: 8 Questions Every Pakistani Investor Is Asking {#faq}
Q1: What is the best PSX stock to buy right now in 2027?
No single stock is universally “best” — the answer depends on your risk profile. For a conservative investor, UBL offers the combination of market leadership, digital banking growth, and dividend yield that is hard to beat. For a growth investor willing to accept higher volatility, NETSOL’s USD-denominated revenue base and 40%+ revenue growth make it compelling. For income investors, DCR’s 7%+ distribution yield on a AAA-rated instrument deserves serious consideration.
Q2: How much should I invest in PSX stocks?
For Pakistani residents, a starting point is allocating 20-40% of your investable savings to equities — never more than you can afford to hold for three years without needing the money. International investors looking at Pakistan as a frontier market allocation should limit exposure to 5-15% of overall equity portfolios. Start smaller than you think you need to, add as you build conviction and familiarity.
Q3: Is the KSE-100 at 179,571 points too high to invest?
Markets always feel expensive at new highs. But the relevant question is not the absolute index level — it is the earnings multiple relative to growth prospects and regional peers. Pakistan’s banking sector, for example, still trades at single-digit P/E ratios compared to double-digit multiples in comparable emerging markets. The index level alone is not a reason to stay out.
Q4: How does the SBP policy rate affect PSX stocks?
When the SBP raises rates (as it did in April 2026), two things happen simultaneously: fixed-income instruments like T-Bills and PIBs become more attractive relative to stocks, and bank NIMs in the near term benefit but broader corporate borrowing costs rise. When rates fall — which the market expects once inflation normalizes — equity valuations re-rate upward as discount rates drop. The current 11.5% rate with expected future cuts is actually a positive setup for patient equity investors who buy now and hold through the cycle.
Q5: Which PSX sector will perform best in 2027?
Based on the macro trajectory — falling inflation, potential rate cuts, improving forex position — banking stocks are positioned for the strongest re-rating as rate cuts resume and NIMs normalize. Technology (NETSOL, PTCL) offers structural growth independent of the rate cycle. REITs offer the most predictable income. A balanced allocation across all three captures different return drivers.
Q6: What is a REIT and why is DCR on this list?
A REIT (Real Estate Investment Trust) is a listed fund that owns income-generating properties and is legally required to distribute the majority of its rental income to shareholders. DCR owns Dolmen Mall Clifton and Harbor Front in Karachi, collects rent, and distributes it quarterly. For investors who want real estate exposure without buying property, DCR offers a liquid, SECP-regulated, AAA-rated alternative with a 7%+ yield.
Q7: How do I evaluate if a PSX stock is overvalued or undervalued?
Start with the Price-to-Earnings (P/E) ratio — this tells you how many years of current profits you are paying for. Pakistan’s banking sector P/E of 7-10x is attractive vs. regional peers at 12-15x. Complement this with dividend yield (higher is generally better for income stocks), Return on Equity (ROE — how efficiently management uses shareholder capital), and book value (for banks, price-to-book below 1x signals potential undervaluation). Never use just one metric.
Q8: How do I start investing in PSX as a beginner?
Open an account with a SECP-registered broker (AKD, Topline, JS Global, Arif Habib), complete KYC with CNIC and bank account, fund your account, and buy your first shares through their trading platform or mobile app. Most brokers have minimum investments of PKR 5,000-10,000. Start with blue-chip stocks from this list (UBL, OGDC, DCR), invest monthly, and hold for at least 12-24 months before judging performance. Pakistan’s market rewards patience far more than timing.
A Final Word to Investors at Every Level
The PSX story in 2027 is not about finding a lucky ticker — it is about understanding the macro cycle and positioning quality holdings ahead of the inflection point. Pakistan is moving from crisis management to controlled recovery. Its forex reserves are the strongest in years. Its IMF programme is on track. Its inflation surge is real but primarily energy-driven — the kind of shock that resolves when the underlying supply disruption eases.
The 20 stocks profiled here represent companies with genuine competitive advantages, identifiable growth catalysts, and management teams that have navigated difficult cycles before. They are not guaranteed winners. No PSX stock is. But they offer the best risk-adjusted entry points available in the market today, across banking, energy, technology, real estate, consumer staples, and conglomerates.
Invest in 5-7 of them to start. Spread across sectors. Think in 3-year horizons, not 3-week price moves. And bookmark this page — we update it quarterly with fresh data.
Pakistan is not an easy market. But easy markets don’t produce 46% annual returns.
Disclaimer: This article is for informational purposes only and does not constitute investment advice. All investments carry risk, including potential loss of principal. Conduct your own research and consult with SECP-registered financial advisors before making investment decisions. Past performance does not guarantee future results. All data sourced from publicly available information as of June 2026.
Discover more from The Economy
Subscribe to get the latest posts sent to your email.

Indonesia’s $1.5 Trillion Economy on the Edge: chances of MSCI Downgrade

Oil Falls to $70 as US-Iran Peace Talks Advance: Global Energy Markets

Micron’s $41.5 Billion Quarter: How AI’s Insatiable Memory Hunger Is Reshaping the Semiconductor Industry

Alan Greenspan Dead at 100: The Rise, Reign, and his Complicated Legacy

Top 20 PSX Stocks for Investment in 2027: Your Complete Guide to Pakistan’s Best Investment Opportunities

AI Power Without Governance: Geopolitical Race for Artificial Intelligence Is Outrunning the World

Turkey’s Bid for Middle East Leadership: How Ankara Is Filling the Vacuum Left by Iran’s Weakening

US Household Debt Hits $18.8 Trillion as Student Loan Defaults Surge

UK in Political and Economic Flux: Reeves Faces Demotion, OBR Gets New Chair, EG Group Eyes US Listing

How Oil ETFs, Meme Stocks, and Options Became the New American Dream

Denver Home Prices Are Falling — Is This Housing Relief or Economic Warning Sign?

How the 2026 Iran War Reshaped the Global Economy

US Inflation Hits 4.2%: A Three-Year High Squeezing American Households and Cornering the Fed

Iran Nuclear Deal in Limbo: Trump Claims Inspection Agreement, Tehran Denies It

China Overhauls the World’s Biggest Surveillance Network with Advanced AI

KPMG Australia CEO Resigns After Whistleblower Claims Exposed Investigation Failures

PwC China Partner Payouts Cut Amid Evergrande Audit Fraud

Broadcom Market Value Loss: Revenue Forecast Disappoints

Pakistan Budget FY 2026-27: Relief, Prospects, and the Tightrope Walk

Investors Pile Into Bullish Dollar Bets as ‘US Exceptionalism’ Trade Returns

Here’s How Much It’ll Cost You to Be Part of SpaceX’s Record-Breaking $75 Billion IPO

Nasdaq Tumbles 4% as Chip and Memory Stocks Sink: A $1.2 Trillion Wipeout

Japanese Mid-Sized Firms Flock to Southeast Asia for Growth

Smash Capital Leads $200M Funding for Allen Control Systems

How to Fix Pakistan’s Debt Economy: A Structural Blueprint

Democrats Draw a Red Line Around Military AI — And the Pentagon Is Already Pushing Back

New Investment Super-Cycle: AI, Green Energy & Re-Shoring

Chip Stocks Race Toward Biggest Gains Since Dotcom Era on AI Demand
-

 Markets & Finance6 months ago
Top 15 Stocks for Investment in 2026 in PSX: Your Complete Guide to Pakistan’s Best Investment Opportunities
-

 Analysis4 months ago
Top 10 Stocks for Investment in PSX for Quick Returns in 2026
-

 Analysis5 months ago
Brazil’s Rare Earth Race: US, EU, and China Compete for Critical Minerals as Tensions Rise
-

 Analysis4 months ago
Johor’s Investment Boom: The Hidden Costs Behind Malaysia’s Most Ambitious Economic Surge
-

 Banks5 months ago
Best Investments in Pakistan 2026: Top 10 Low-Price Shares and Long-Term Picks for the PSX
-

 Investment6 months ago
Top 10 Mutual Fund Managers in Pakistan for Investment in 2026: A Comprehensive Guide for Optimal Returns
-

 Global Economy6 months ago
15 Most Lucrative Sectors for Investment in Pakistan: A 2025 Data-Driven Analysis
-

 Global Economy6 months ago
Pakistan’s Export Goldmine: 10 Game-Changing Markets Where Pakistani Businesses Are Winning Big in 2025