
Governance
How Governments Are Increasingly Taxing the Rich — And Why It’s Working Better Than You Think


Tax systems are more progressive than the headlines suggest. A deep dive into global data reveals a countervailing force quietly reshaping economic inequality.
There is a story most people believe about inequality: that the rich have gotten richer, governments have stood aside, and the gap between the powerful and the powerless has grown wider with each passing decade. It is a compelling narrative. It has fueled populist movements from Paris to Pennsylvania. And it is, in important ways, true.
But it is only half the story.
The half that rarely makes the front page is this: while pre-tax incomes have grown more unequal across much of the developed world, tax codes have quietly, methodically, and often controversially been reengineered to push back. The modern tax system — maligned by progressives as a handmaiden of the wealthy and by conservatives as a punishing drag on enterprise — has actually become considerably more redistributive than it was a generation ago. Today’s taxman, it turns out, looks less like the Sheriff of Nottingham and rather more like Robin Hood.
The Inequality Surge — And the Silent Counter-Surge
The raw numbers on pre-tax inequality are stark. In 1980, the top 1% of American earners commanded roughly 9% of national pre-tax income. By 2022, that share had climbed to 16% — nearly double. Europe followed a similar, if less dramatic, trajectory: the top 1%’s share rose from around 8% to 12% over the same period, according to data tracked by the World Inequality Database (wid.world, DA 70).
This concentration at the top has coincided with the stagnation of middle-class wages across rich nations — a phenomenon economists now widely cite as a driver of the populist upheavals that reshaped Western politics after 2016. When people feel the system is rigged, they vote accordingly.
Yet here is the data point that rarely features in those conversations: even as pre-tax inequality grew, post-tax inequality in many countries grew far less — and in some cases, barely at all. By comparing the distribution of income before and after taxes and transfers, economists can measure how much redistribution a tax system actually delivers. That measure has risen sharply over the past four decades in most wealthy democracies.
The Numbers Behind the Narrative
A rigorous analysis of post-tax income distributions, drawing on OECD Taxation and Inequality data (oecd.org, DA 90), reveals the scale of the shift. The United States today redistributes approximately twice as much income through its tax-and-transfer system as it did in the 1960s. Germany and Japan, the world’s second- and fourth-largest economies, have also significantly expanded the redistributive reach of their fiscal systems. Britain and Canada are not far behind.
By the best available estimates, roughly seven in ten developed countries now operate more progressive tax-and-benefit systems than they did in 1990. The exceptions — Belarus, Eritrea, Haiti — are either dysfunctional states or, as in the case of Scandinavia, systems that were already so redistributive that marginal gains became structurally difficult to achieve. Norway and Sweden didn’t become less progressive because they abandoned the principle; they simply had less room to move.
The Tax Foundation’s 2025 Federal Income Tax Data Update (taxfoundation.org, DA 80) offers a granular look at the American case. The top 1% of U.S. earners now pay an effective federal income tax rate substantially above their historical average, contributing a disproportionate share of total receipts. Progressivity in the U.S. code — measured by the share of taxes paid by upper-income brackets relative to their share of income — has been on an upward trend since the early 2000s, a fact that cuts against the popular assumption that American tax policy has simply catered to the wealthy.
How Progressive Tax Benefits Are Actually Delivered
The mechanics matter. Progressive tax benefits do not arise solely from higher marginal rates on the wealthy — though that is one lever. They are also engineered through refundable tax credits for lower earners (the U.S. Earned Income Tax Credit is a prime example), the phase-out of deductions at higher incomes, the expansion of means-tested transfer payments, and the treatment of payroll versus capital income.
The U.S. Census Bureau’s 2025 report (census.gov, DA 92) underscores both the achievement and the limits of this system. Post-tax income inequality in the United States did rise by approximately 14% between 2009 and 2024, even accounting for redistribution — a sobering reminder that the tax code’s progressive thrust has not fully offset the underlying surge in market incomes. The very wealthy have captured productivity gains and asset appreciation at a rate that even a more aggressive redistributive system struggles to neutralize entirely.
That tension between pre-tax divergence and post-tax convergence is at the heart of the modern policy debate. Income redistribution trends globally, as documented in the World Inequality Database’s 2023–2024 data, show that many countries now display what researchers describe as “flat global taxation profiles” — meaning that once all taxes (including consumption and payroll taxes, which are regressive) are accounted for, the net progressivity of the full fiscal system is considerably more modest than headline income tax rates suggest.
Governments Taxing the Rich: What Works, and What Doesn’t
The global experiment in taxing higher incomes more aggressively has generated both evidence and controversy. France’s short-lived 75% top marginal rate under President Hollande became a case study in capital flight and political backlash. By contrast, the Nordic countries have sustained high top rates while maintaining robust economic dynamism — though critics note their tax bases are notably broad, with consumption taxes doing significant heavy lifting.
The wealth tax impact on the economy has proven particularly contested. Sweden abolished its wealth tax in 2007 following substantial evidence that it was driving capital offshore. Spain reintroduced a form of it in 2022, with mixed results. The academic literature, including a landmark 2024 OECD working paper, finds that the behavioral responses to high marginal rates — avoidance, deferral, emigration — significantly erode the practical revenue yield, suggesting that the design of progressive systems matters as much as their stated ambition.
The Manhattan Institute’s research on the limits of taxing the rich (manhattan-institute.org) offers a rigorous counterpoint worth engaging seriously: there is a ceiling to how much revenue can be extracted from high earners before diminishing returns — and perverse incentives — begin to dominate. That ceiling is lower than redistributionists tend to assume and higher than supply-siders insist. The empirical literature puts the revenue-maximizing top marginal rate somewhere in the range of 50–70%, though the precise figure is sensitive to assumptions about capital mobility and income elasticity.
The Political Economy of Redistribution
There is a deeper irony embedded in this story. The very success of progressive taxation in moderating post-tax inequality may have paradoxically reduced the political salience of tax reform. If the after-tax Gini coefficient looks relatively stable, policymakers can point to a system that is “working” — even as pre-tax divergence continues unabated and wealth (as distinct from income) inequality reaches historic extremes.
The Economist’s analysis of how governments are soaking the rich (economist.com, DA 93) correctly identifies that much of the redistribution occurring today happens not through dramatic rate increases but through the quiet accumulation of tax expenditures, transfer payments, and bracket creep. This is redistribution by stealth — effective in aggregate, but poorly understood by voters, and therefore fragile.
That fragility matters. A redistributive architecture that operates through complexity rather than transparency is vulnerable to elite capture, to political backlash, and to the kind of simplification drives that tend to benefit those with the resources to optimize against a newly rationalized code.
Looking Forward: Policy Implications for 2025 and Beyond
The data presents a nuanced verdict. Progressive tax systems in wealthy democracies have done considerably more to moderate inequality than their critics acknowledge. The claim that governments have simply let the rich run away with the gains is empirically unsound. Yet the redistributive effort required has grown dramatically — and the economic friction it generates, in terms of tax avoidance, investment distortions, and political conflict, is rising alongside it.
Several policy directions appear most promising based on the available evidence:
Broadening the base while maintaining progression. Systems that rely on narrow income tax bases are more vulnerable to avoidance. Consumption taxes with low-income offsets, or a more systematic approach to capital gains taxation (including accrual-based treatment for the very wealthy), could expand the redistributive toolkit without requiring punishing marginal rates.
Targeting wealth as well as income. As the World Inequality Database documents, much of the divergence at the top is now driven by asset appreciation rather than labor income. A well-designed, internationally coordinated minimum tax on very large wealth — as proposed in academic frameworks endorsed at the G20 level — could address what income tax systems structurally miss.
International coordination to limit base erosion. The OECD’s Global Minimum Tax initiative represents the most significant shift in the international tax architecture in decades. Its full implementation would meaningfully constrain the ability of multinationals and wealthy individuals to arbitrage tax systems — a precondition for progressive systems to deliver their stated redistributive goals.
The arc of tax history in the modern era bends, tentatively and imperfectly, toward greater progressivity. Whether that arc can continue to bend fast enough to offset the forces generating pre-tax inequality is the central fiscal question of the coming decade. Governments have proven more Robin Hood than Sheriff of Nottingham. The question now is whether the forest is large enough — and whether there are enough stagecoaches left to rob.
Sources: World Inequality Database (wid.world); OECD Taxation and Inequality 2024 (oecd.org); U.S. Census Bureau Income and Poverty Report 2025 (census.gov); Tax Foundation Federal Income Tax Data 2025 (taxfoundation.org); The Economist, “How Governments Are Increasingly Soaking the Rich” (economist.com); Manhattan Institute, “The Limits of Taxing the Rich” (manhattan-institute.org)
Discover more from The Economy
Subscribe to get the latest posts sent to your email.


Governance
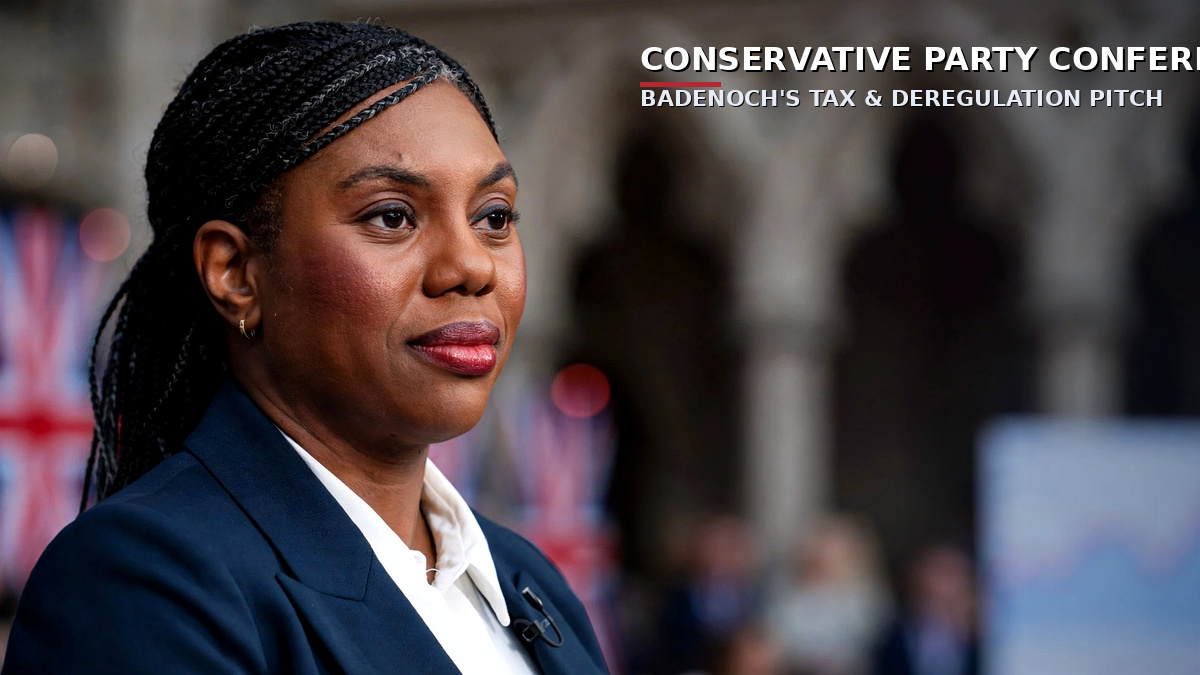
Conservative Party Conference 2026: What Badenoch’s Tax and Deregulation Pitch Means for the UK Economy
Key Takeaways
- The conference is opposition theatre with real market-adjacent consequences. The Conservatives can’t change a single tax rate this week, but their pitch shapes how investors, developers and businesses read the next election.
- The headline is deregulation. Shadow chancellor Andrew Griffith promised “the most ambitious deregulation project in a generation”, including scrapping the Future Homes Standard, replacing Section 106 and the Community Infrastructure Levy with one charge, and abolishing Natural England and the Environment Agency.
- The tax pledges are specific but uncosted. Griffith said the party would scrap Labour’s levy on high-value homes and its packaging tax, and he committed to tax simplification as a mission for every Treasury minister.
- The backdrop is unforgiving. The UK 10-year gilt yield was about 5.4% at the end of September and the 30-year briefly approached 6%, according to market data, with the Budget due on October 28.
- Credibility is the currency. After 2022, any unfunded tax promise is judged first by bond markets and only second by voters.
Political conferences have a strange job. They are partly pep rally, partly job interview and partly policy laboratory. For the Conservative Party gathering in Birmingham this week, the interview is with two audiences at once: voters who rejected the party in 2024, and bond investors who still remember how the 2022 mini-budget ended.
That second audience is the one that moves prices. So what did the Conservatives actually announce, what might it do to the economy if it ever became law, and what should businesses, homeowners and investors watch for between now and the Budget?
Here is the practical read, with the caveat that everything below remains a proposal from the opposition benches.
What Happened in Birmingham
Kemi Badenoch opened the conference on Sunday, October 4, by publishing an almost 100-page document called The Right Way. In it she warned that living standards have stalled and that regulation has accumulated faster than anyone can remove it, per Press Association reporting. The document also acknowledges failures in earlier Conservative approaches to net zero, immigration and the way Brexit was delivered, as RTÉ reported.
On Monday, October 5, Griffith followed with the economic detail. According to the text of his speech, he framed the country as having a debt problem, a tax problem and a growth problem, and promised to scrap the Family Farm and Family Business inheritance tax, Labour’s packaging tax and its levy on high-value homes.
The Proposals at a Glance
| Proposal | Who it affects | Likely economic channel | Biggest open question |
|---|---|---|---|
| Scrap the Future Homes Standard | Housebuilders, buyers, energy bills | Cheaper construction, higher running costs | Does lower build cost reach buyers? |
| Replace Section 106 and CIL with a single charge | Developers, local councils | Faster approvals, simpler levies | Who funds local infrastructure? |
| Abolish stamp duty (existing policy) | Home movers, property market | More transactions, upward price pressure | Cost to the Exchequer |
| Abolish Natural England and the Environment Agency | Farmers, builders, regulators | Fewer permitting delays | Environmental enforcement capacity |
| Scrap extended producer responsibility for packaging | Manufacturers, retailers | A claimed £1.5 billion cost relief | Who pays for waste collection? |
| Scrap the high-value homes levy | Owners of expensive property | Tax relief for a narrow group | Revenue replacement |
| Back a third Heathrow runway | Aviation, logistics, construction | Long-run capacity and investment | Planning, cost and climate |
| Review Making Tax Digital and IR35 | Small firms, freelancers | Lower compliance burden | Details are still missing |
The Housing Trade-Off Nobody Mentions on Stage
The most concrete number in the package comes from a 2023 Birmingham City Council document the party’s researchers pointed to. It found that heat pumps, better efficiency and solar panels could add £30,789 to the cost of building a detached home. The same document estimated those technologies could cut £2,715 a year from energy bills, effectively paying for themselves in roughly 11 years.
Read that carefully. Scrapping the standard can lower the sticker price of a new home, but it may raise the lifetime cost of living in it. Whether buyers come out ahead depends on mortgage rates, energy prices and how long they stay put.
That is the pattern across the package. Almost every proposal moves a cost from one column to another, rather than deleting it.
The Market Backdrop: Why Bond Investors Are Watching
Here is the context that makes this more than a debate about red tape.
- The UK 10-year gilt yield rose to about 5.39% on October 5, according to Trading Economics, after a global bond sell-off pushed it to the highest levels since 2007.
- The 30-year yield touched roughly 6%, the first time since 1998.
- The Bank of England held Bank Rate at 3.75% in September, as noted by IFA Magazine, while markets price some tightening ahead.
- Chancellor John Healey, appointed by Prime Minister Andy Burnham on July 20, has said fiscal discipline will anchor the October 28 Budget.
A rule of thumb quoted in market commentary is that every quarter-point rise in gilt yields can erase billions of pounds of the Chancellor’s headroom. Higher yields make every tax-cutting promise harder to fund.
The Ghost in the Room: 2022
You cannot discuss Tory tax cuts without mentioning the mini-budget. In 2022 the government announced what Fortune described as the biggest set of unfunded tax cuts in half a century, and gilt markets reacted violently.
Griffith is plainly aware of the comparison. He framed himself as a chancellor who wants to cut taxes only when the country can afford it, and his package leans on deregulation and simplification rather than headline rate cuts. Voters and investors will test whether the arithmetic really works.
What Rivals Said
The reactions map the political terrain.
- Labour’s chair, Bridget Phillipson, said the Conservatives wanted to take the country back to a politics that let people down, and pointed to 14 years of government.
- The Liberal Democrats’ Daisy Cooper called the pledges “fantasy-land” financial promises.
- Reform UK’s Robert Jenrick said the Tories were copying his party’s policies, and contrasted them with Reform’s pledge to raise the income-tax personal allowance from £12,570 to £15,000.
The crowded right flank matters. A party that looks too cautious loses voters to Reform, and a party that looks reckless loses the bond market.
What This Means for Businesses, Homeowners and Investors
Nothing here changes your tax bill today. But the direction of travel is worth tracking.
If you run a business
Watch the Budget for signals on compliance costs. Proposals to review Making Tax Digital and IR35 and to scrap the packaging levy would matter, but only if they survive contact with Treasury costings.
If you own or plan to buy property
The stamp duty and new-build changes, if enacted, would affect transaction volumes and construction costs. Mortgage pricing, however, is driven by gilt yields, so the bond market will shape your costs more than any conference speech.
If you invest in UK assets
Treat the conference as a read on political risk. The relevant questions are how credible the fiscal framework looks, whether pledges are costed, and how the gilt market reacts on and after Budget day. This isn’t investment advice.
A Three-Question Test for Any Opposition Economic Plan
Conference season produces dozens of announcements, and most won’t survive contact with a Treasury spreadsheet. Here’s a quick filter you can apply to this package, or to any other.
1. Is it costed?
A pledge with a price tag can be argued with. A pledge without one can only be believed or doubted. With gilt yields already high, the market’s default setting is doubt. Watch whether the party publishes figures, and whether independent forecasters accept them.
2. Who ends up paying?
Abolishing a levy rarely abolishes the cost it was funding. Replacing Section 106 and CIL with a single charge, for example, still has to pay for roads, schools and drainage somewhere. The same goes for packaging waste, where scrapping the producer-responsibility scheme would lift a claimed £1.5 billion burden from businesses but leave the question of who funds collection and recycling.
3. Can it be delivered quickly?
Deregulation sounds fast and often isn’t. Abolishing two regulators and folding their work into a government department means legislation, transition and staff decisions. The party says it will set out plans “line by line,” which is the right instinct, because detail is what turns a conference slogan into a credible first-hundred-days timetable.
Apply the test and the package splits into two groups. Simplification and review proposals, such as Making Tax Digital and IR35, are cheap to promise and quick to reform. Structural changes to housing standards and environmental regulators carry larger consequences and bigger uncertainty. Markets will price the second group more cautiously, and rightly so.
Asked & Answered
Did the Conservatives announce any tax cuts at the 2026 conference?
They announced pledges to scrap several taxes and levies, including Labour’s high-value homes levy and its packaging tax, and confirmed existing policies such as abolishing stamp duty. None can take effect unless the party wins power.
What is the Conservatives’ deregulation plan?
Shadow chancellor Andrew Griffith called it the most ambitious in a generation. It includes scrapping the Future Homes Standard, replacing Section 106 and CIL with a single charge, abolishing Natural England and the Environment Agency, and removing packaging responsibility rules.
Would these policies lower house prices?
The party argues they would reduce building costs and boost supply. Economists would want to see how much of the saving reaches buyers, and how stamp duty abolition affects demand. The outcome is uncertain.
How do gilt yields affect the Conservatives’ plans?
Higher yields raise the government’s borrowing costs and shrink fiscal headroom, which makes unfunded tax cuts harder to defend. That is why bond-market credibility is central to the Conservative pitch.
When is the next major economic event for the UK?
The Autumn Budget is scheduled for October 28, 2026, and the Bank of England’s next decisions will also shape borrowing costs.
Discover more from The Economy
Subscribe to get the latest posts sent to your email.
Markets & Finance
Analytical Review of The Economist’s “What is the Right Tax System for the 21st Century?”
Core Premise & Scope
The Economist correctly diagnoses the structural breakdown of 20th-century tax systems across advanced economies. As sovereign debt loads surge, long-term bond yields remain elevated, demographic aging inflates entitlements, and defense and climate commitments expand, standard fiscal architectures are failing. The article argues that current systems rely too heavily on distortive income and labor taxes while ignoring immobile wealth, land, and environmental negative externalities.
Critical Analytical Gaps
While The Economist identifies key symptoms, its analysis exhibits four primary operational gaps:
- Failure to Address the AI Labor Tax Erosion: High-income nations derive over 40–60% of total tax revenues from Personal Income Tax (PIT) and Social Security Contributions (SSCs). As artificial intelligence and autonomous workflows displace high-wage cognitive labor, standard income tax bases will erode. The Economist treats labor taxation as static rather than declining.
- Abstract Land & Wealth Taxation Without Transition Economics: Advocating for Land Value Taxes (LVT) and property tax overhauls is theoretically sound but politically non-viable without explicit transitional mechanisms (such as tax credits against capital gains or phased revenue-neutral shifts).
- Over-reliance on OECD Consensus Enforcement: The piece assumes smooth global coordination via the OECD Inclusive Framework. In reality, jurisdictional profit-shifting and implementation friction between market nations and headquarters hubs create major enforcement leaks.
- Omission of Cash-Flow Expenditure Architectures: The analysis fails to evaluate Destination-Based Cash-Flow Taxation (DBCFT), which removes incentives for corporate inversion while exempting marginal investment from capital distortion.
Designing the Optimal Tax System for the 21st Century
Tax codes across the developed world are relics of a 1950s industrial economy. Built on the assumption of immobile domestic corporations, fixed physical factories, and stable wage labor, 20th-century tax models create massive deadweight losses, disincentivize capital formation, and fuel wealth inequality.
A modern tax architecture must maximize economic efficiency and neutrality while maintaining progressive distribution and fiscal solvency. Achieving this requires shifting the tax base away from productive inputs (labor and investment) toward unearned economic rents, immobile assets, and negative externalities.
       TRADITIONAL TAX BASE                   21ST-CENTURY TAX ARCHITECTURE
┌─────────────────────────────────┐       ┌─────────────────────────────────┐
│ • High Marginal Income Taxes   │       │ • Land Value Taxation (LVT)     │
│ • Corporate Income Tax (CIT)   │  ───► │ • Progressive Expenditure Tax   │
│ • Payroll & SSC Distortions    │       │ • Pigouvian Carbon Pricing      │
│ • Capital Gains Penalties       │       │ • Destination Cash-Flow Model   │
└─────────────────────────────────┘       └─────────────────────────────────┘
Structural Failures of Current Fiscal Architectures
Modern sovereign states face a structural triad of fiscal pressures:
- Demographic Entitlement Creep: Aging populations reduce the working-age tax base while accelerating expenditures on public pensions and healthcare.
- Labor Income Erosion: Technological displacement and the growth of independent digital work dismantle traditional payroll tax collection mechanisms.
- Capital Mobility & Base Erosion: Intangible assets (IP, algorithms, digital platforms) allow multinational entities to shift taxable profits across borders, undermining standard corporate income taxes.
According to data from the Urban-Brookings Tax Policy Center, high marginal tax rates on capital and labor depress long-run economic growth by creating deadweight loss wedges between pre-tax returns and post-tax rewards.
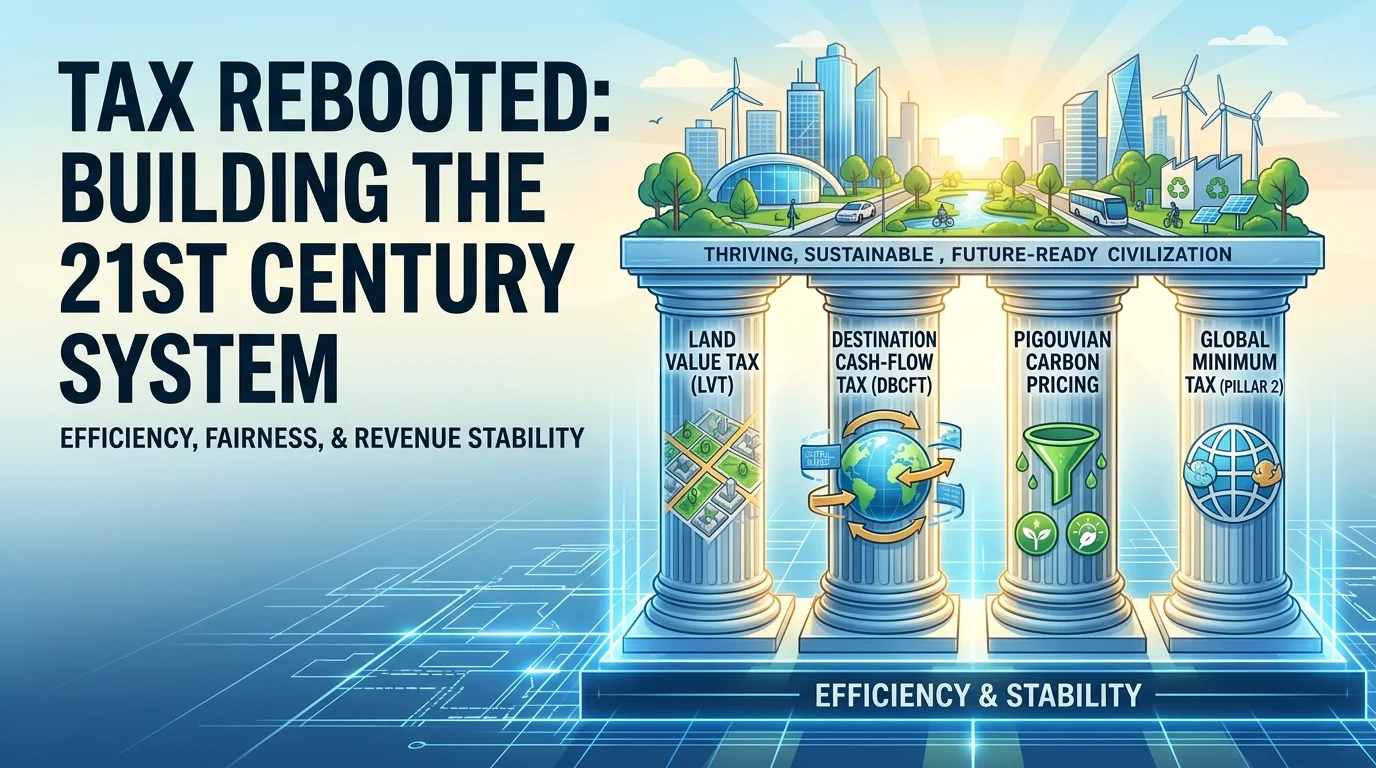
The Four Pillars of the Modern Tax System
                  ┌─────────────────────────────────────────┐
                  │    21st Century Tax Architecture        │
                  └────────────────────┬────────────────────┘
                                       │
        ┌──────────────────┬───────────┴───────────┬──────────────────┐
        ▼                  ▼                       ▼                  ▼
┌───────────────┐  ┌───────────────┐       ┌───────────────┐  ┌───────────────┐
│  Land Value   │  │  Destination  │       │   Pigouvian   │  │  Global Min   │
│ Tax (LVT)     │  │  Cash-Flow    │       │ Carbon Pricing│  │  Pillar 1/2   │
└───────────────┘  └───────────────┘       └───────────────┘  └───────────────┘
1. Land Value Taxation (LVT)
Land is inelastic in supply. Taxing the unimproved value of land creates zero economic deadweight loss because land cannot relocate or shrink in response to taxation.
- Abolish Standard Property Taxes on Improvements: Traditional property taxes penalize building construction and urban development. Taxing only the underlying land value incentivizes efficient land use and infill development.
- Recapture Unearned Location Value: Urban land values appreciate primarily due to public infrastructure (transit, utilities, public safety) and community growth. An LVT captures these economic rents for public revenue without taxing private capital improvements.
2. Progressive Destination-Based Consumption Tax
Replacing corporate income taxes and high personal income brackets with a progressive cash-flow consumption tax removes the double-taxation penalty on savings and investment.
- Destination-Based Cash-Flow Tax (DBCFT): Tax is levied where goods or services are consumed, rendering corporate tax avoidance via offshore profit-shifting obsolete.
- Full Expensing of Capital Investments: Businesses immediately deduct all capital expenditures, removing investment distortions and accelerating productivity growth.
- Individual Progressive Consumption Tax: Individuals report total income minus net savings. The remaining spending is taxed at progressive rates, shielding low-income households via prebates or personal allowances.
3. Pigouvian Externality Pricing
Taxes should actively discourage activities that impose unpriced costs on society. Pigouvian levies convert social harms into direct fiscal revenue.
- Upstream Carbon Taxation: Implementing a border-adjusted carbon tax prices environmental damage directly into energy and goods production. As outlined in the IMF Fiscal Policy Frameworks, pricing carbon provides market signals for green technology transitions while generating revenue to offset lower income taxes.
- Resource and Congestion Levies: Variable tolling on urban roadways and extraction fees on finite natural resources internalize spatial and environmental costs.
4. Coordinated Multilateral Corporate Minimum Taxes
To address profit-shifting by digital multinationals, international tax law must transition from physical presence rules to destination-based profit allocation.
- Implementation of OECD Pillar 1 & Pillar 2: Adopting a global minimum corporate tax rate of 15% eliminates race-to-the-bottom tax competition, as detailed in the OECD Global Tax Framework.
- Formula Apportionment for Digital Services: Allocating multinational taxable income based on sales destination and active user bases ensures fair revenue distribution without requiring physical offices.
Comparative Analysis of Tax Regimes
| Tax Model | Economic Efficiency | Distributional Equity | Evasion Resilience | Administrative Complexity |
| Traditional Income & Corporate Tax | Low (High deadweight loss, double taxation of savings) | Moderate (Progressive on paper, vulnerable to deductions) | Low (Prone to offshore shifting and tax shelters) | High (Requires extensive compliance and auditing) |
| Wealth & Inheritance Taxation | Low-Moderate (Risks capital flight and valuation disputes) | High (Targets accumulated asset concentration) | Low (Capital moves to non-reporting jurisdictions) | Very High (Requires complex annual asset valuations) |
| Land Value Taxation (LVT) | Maximum (Zero supply distortion on unimproved land) | High (Progressive; land ownership is heavily concentrated) | Maximum (Immobile physical asset) | Low (Requires transparent cadastral land valuation) |
| Destination Cash-Flow Consumption Tax | High (Promotes investment, eliminates capital penalties) | High (Progressive spending tiers + prebates) | High (Border adjustments eliminate transfer pricing) | Moderate (Relies on border adjustments and financial transaction data) |
Mitigating AI-Driven Disruption to Public Finance
As AI tools and automation displace labor income, tax systems relying on payroll fees face declining receipts. Attempting to tax AI directly through “robot taxes” slows innovation and distorts technical adoption.
┌────────────────────────────────────────────────────────────────────────┐
│                        AI DISRUPTION & TAX BASE                        │
├──────────────────────────────────┬─────────────────────────────────────┤
│  Flawed Approach: Robot Taxes    │  Optimal Approach: Cash-Flow Tax    │
├──────────────────────────────────┼─────────────────────────────────────┤
│ • Penalizes technology adoption  │ • Taxes economic output at spending │
│ • Arbitrary definition of "robot" │ • Captures AI super-normal rents    │
│ • Slows productivity growth      │ • Neutral to technology choice      │
└──────────────────────────────────┴─────────────────────────────────────┘
The solution is to decouple public revenues from labor payrolls altogether:
- Shift Base to Corporate Cash-Flow and Land: As capital yields an increasing share of national income relative to wages, taxation must target corporate economic rents and land values rather than wage receipts.
- Eliminate Payroll Tax Caps: Remove income thresholds on social insurance contributions to maintain equity during structural shifts in high-earner distributions.
- Expand Universal Citizen Dividends: Fund social safety nets using revenues generated from Pigouvian carbon taxes and land value capture rather than taxing wage transactions.
Political Execution & Transition Roadmap
Reforming a tax code requires managing transition shocks to prevent capital flight or political paralysis.
Phase 1: Stabilization (Years 1-2)
├── Introduce upstream Carbon Tax with dividend returns
└── Enact OECD Pillar 2 15% global minimum tax

Phase 2: Base Shift (Years 3-5)
├── Replace local property taxes with Land Value Tax (LVT)
└── Allow 100% immediate expensing for business investments

Phase 3: Structural Realignment (Years 6-10)
├── Consolidate Personal Income Tax into Progressive Consumption Tax
└── Phase down distortionary corporate income tax rates
- Revenue-Neutral Phase-In: Pair new Land Value Taxes and carbon levies with immediate rate reductions on wage income and full capital expensing for businesses.
- Granular Tax Prebates: Mitigate regressivity in consumption taxes by distributing monthly advance rebates to low-and-middle-income households.
- International Harmonization: Secure treaty compliance through the IMF International Tax Reform Guidelines, ensuring uniform adoption of destination-based rules across major trading blocs.
Discover more from The Economy
Subscribe to get the latest posts sent to your email.

On Monday, September 28, President Trump announced from the Oval Office what the White House calls the largest steel plant in U.S. history. The price tag is $15 billion, the backer is an Indian industrial group, and the target date is 2030. Here’s what’s confirmed and what’s still unanswered.
Key Takeaways
- Cost and timing: The White House says production begins in 2030 and the project creates more than 2,000 U.S. jobs. lanacion
- Builder: Mesabi Metallics, a Minnesota company owned by India’s Essar Group, is building it. fox35orlando
- Output: A White House official told CBS the plant should make 7.5 million or more tons of steel a year, with 1,750 permanent jobs in Iowa. CBS News
- Politics: The event highlighted Iowa as a battleground where Republicans face competitive midterm races. wsbtv
- Open questions: Exact location, financing structure and the 2030 timeline remain unproven.
What Was Announced
Trump unveiled the project alongside steel executives, commerce officials and Iowa Republicans. The Wall Street Journal reported the plan first. Iron ore will come from a $2.5 billion mine Mesabi developed on Minnesota’s Mesabi Range. wdbowsbtv
CBS News reported that Mesabi had not yet said where in Iowa the plant would go. One syndicated report described it as a proposed plant in eastern Iowa, so treat location claims cautiously until the company confirms a site. CBS Newsfox35orlando
| Detail | What’s reported |
|---|---|
| Investment | $15 billion |
| Builder | Mesabi Metallics (owned by India’s Essar Group) |
| Start of production | 2030 (projected) |
| Capacity | 7.5M+ tons/year (White House official, via CBS) |
| Jobs | 2,000+ U.S. jobs overall; 1,750 permanent in Iowa |
| Raw material | $2.5B Minnesota iron ore mine |
| Status | “Largest in U.S.” is a White House claim |
Why Now? Tariffs and the Midterms
The announcement landed under 40 days before the November midterms, in a state where governor and Senate races are tight. AP’s reporting tied the timing directly to Republican efforts to energize voters there.
The policy backdrop matters just as much:
- Trump raised steel and aluminum import tariffs to 50% earlier this year. lanacion
- In June he approved Nippon Steel’s takeover of U.S. Steel, a deal Biden blocked and Trump had initially opposed. lanacion
- At the event, Trump credited the 50% tariffs for a steel industry “roaring back to life.” wsbtv
The plant is the latest piece of a trade strategy built on protecting domestic metals. Tariffs make new U.S. capacity more attractive because they raise the price of imports it competes with.
The Foreign-Capital Twist
An Indian conglomerate funding “the nation’s biggest” U.S. steel plant sits awkwardly with an “America First” message. The White House framed it as prioritizing American workers over foreign labor. The ownership question is a fair one for readers: the jobs and the plant are American, while the capital and parent company are not. That’s common in U.S. manufacturing, but it’s rarely announced from the Oval Office. wftv
What It Means for Steel Markets and Investors
This section is analysis, not reporting.
Supply: 7.5 million tons a year would be a meaningful addition to domestic capacity, but not until 2030. Nothing about steel prices changes this year because of it.
Integration: Pairing a mine with a mill is vertical integration. It insulates a producer from iron ore swings and could lower unit costs if executed well.
Tariff dependence: The economics lean on protection. If tariffs are lowered after an election or a trade deal, a plant built on today’s price assumptions faces a different market. Investors should ask what the plant’s break-even looks like without a 50% wall.
Competitors: Incumbent U.S. producers face a well-capitalized new entrant in four years. That’s a long-term negative for their pricing power and a short-term signal that the sector attracts capital.
What Wealth Managers and Industrial Buyers Should Watch
Projects of this size pull money into adjacent sectors. Here are the places to look:
| Area | Why it matters |
|---|---|
| Equipment and engineering firms | Mega-projects generate multi-year contracts |
| Industrial software and automation | New plants buy control systems, ERP and predictive-maintenance tools |
| Regional banks and municipal bonds | Local infrastructure, housing and utilities expand around large employers |
| Energy and utilities | A steel mill is a major power customer |
| Logistics and rail | Ore moves from Minnesota to Iowa, steel moves to customers |
Five Questions That Will Decide Whether This Gets Built
- Where exactly will it go?
- Site selection drives permitting, power and water.
- How is it financed?
- $15 billion needs debt, equity and likely incentives.
- Who buys the steel?
- Offtake agreements make projects bankable.
- Will the tariff regime hold?
- Policy risk is the biggest swing factor.
- Can the timeline hold?
- A 2030 start leaves little room for delays on a first-of-its-kind facility.
The plant is a real announcement with real money behind it, but it’s also a campaign-season event for a battleground state. The confirmed facts are the investor, the price, the capacity target and the 2030 goal. The unconfirmed ones, especially location and financing, will determine whether the “largest steel plant in U.S. history” gets built on schedule. Watch for Mesabi’s own filings and site announcements over the coming months.
Discover more from The Economy
Subscribe to get the latest posts sent to your email.

KOSPI Crash October 2026: What Korea’s Chip Selloff Reveals

CoreWeave Stock 2026: CRWV, AI Infrastructure Debt and the Selloff Explained

OP-ED:The AI Race Has No Single Winner — And Pakistan Must Choose Its Own Future

VA Disability Rates Increase 2027: The Confirmed 3.6% COLA Explained

US–China AI Export Controls in 2026: Chips, Testing Rules and Corporate Risk

World Trade in 2026: Tariffs, Supply Chains and the Cost of Fragmentation

Global Economy Outlook 2026–27: What to Watch Ahead of the IMF October Report

Strait of Hormuz in 2026: Why Shipping Risks Matter for Oil, Insurance and Food Prices

US–China Critical Minerals Competition in 2026: Who Controls the Supply Chain?

Oil and Diesel Prices in October 2026: How Supply Shocks Can Reach Inflation

AI Chip Demand in 2026: What TSMC, Nvidia and Data-Center Spending Reveal

Q3 2026 Earnings Season: The Bank, AI and Consumer Signals That Really Matter

Treasury Yields in 2026: Why Higher Bond Rates Matter for Stocks, Mortgages and Savings

KOSPI 2026: Why South Korean Stocks Turned Volatile and What AI Investors Should Watch

World’s Largest Economies: Ranking the Top Global Powers

Global Pension Systems Ranked: The World’s Best and Worst Retirement Frameworks

Elon Musk’s Next Moves: Disrupting the 2026 Global Economy

Crude Oil & Petroleum Market Analysis: OPEC+ Decisions and Price Forecasts

Pakistan Economy 2026: Inside the SBP’s Balancing Act

GasBuddy Market Insights: How Crude Price Shifts Impact Local Fuel Cost Averages

Global Equity Market Divergence: US Tech vs. European Dividend Stocks vs. Asian Growth

IMF & World Bank Global Economic Outlook: Growth Forecasts Across Europe and Asia

Bitcoin Price Forecast 2026–2027: Will the 4-Year Cycle Hold?

Silver Price Today: Why the Xi-Trump AI Standoff Is Fueling a Safe-Haven Rally

The Future of Silicon: Supply Chain Vulnerabilities in the 2026 Tech Sector

Asian Stock Markets 2026: Japan, China, Pakistan & More

Stagflation vs. Soft Landing: How Central Bank Rates Are Reshaping European and Asian Economies

SpaceX IPO: How Aerospace Is Reshaping Tech Startup News
-

 Markets & Finance9 months ago
Top 15 Stocks for Investment in 2026 in PSX: Your Complete Guide to Pakistan’s Best Investment Opportunities
-

 Analysis8 months ago
Johor’s Investment Boom: The Hidden Costs Behind Malaysia’s Most Ambitious Economic Surge
-

 Analysis8 months ago
Top 10 Stocks for Investment in PSX for Quick Returns in 2026
-

 Banks9 months ago
Best Investments in Pakistan 2026: Top 10 Low-Price Shares and Long-Term Picks for the PSX
-

 Analysis8 months ago
Brazil’s Rare Earth Race: US, EU, and China Compete for Critical Minerals as Tensions Rise
-

 Investment9 months ago
Top 10 Mutual Fund Managers in Pakistan for Investment in 2026: A Comprehensive Guide for Optimal Returns
-

 Global Economy10 months ago
15 Most Lucrative Sectors for Investment in Pakistan: A 2025 Data-Driven Analysis
-

 Global Economy10 months ago
Pakistan’s Export Goldmine: 10 Game-Changing Markets Where Pakistani Businesses Are Winning Big in 2025