
Analysis
European Cars Made in China: The Identity Crisis

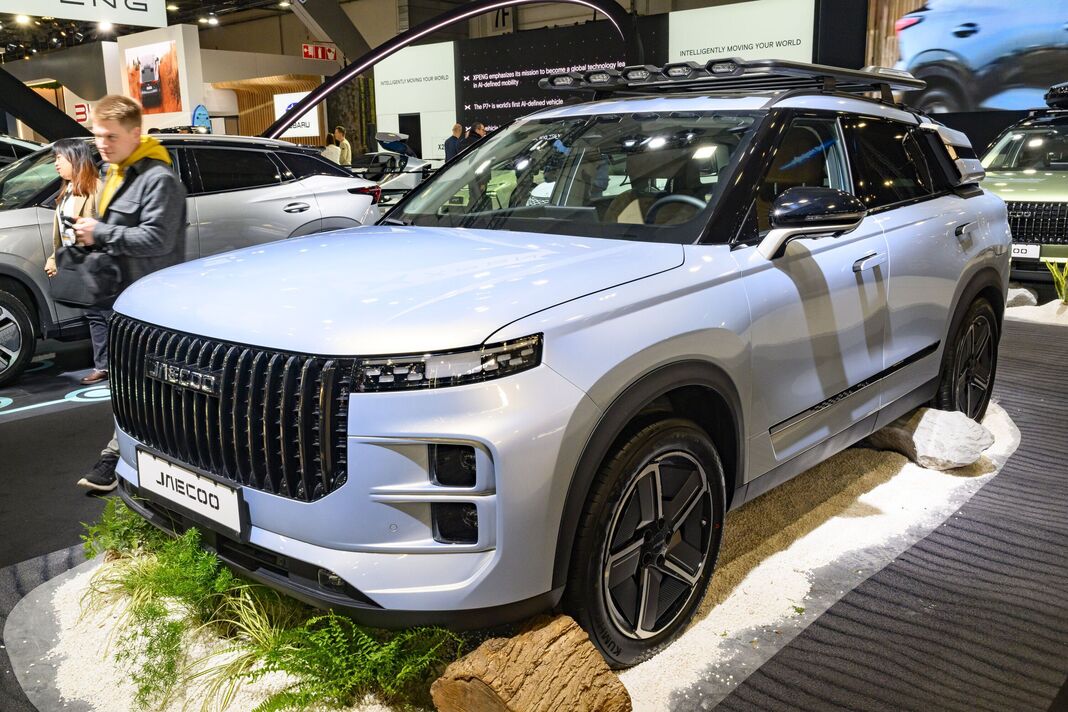
European cars made in China — from BMW’s Mini to Volvo’s EX30 — are caught between a cost logic that made them viable and a political climate determined to unmake it.
The Mini Aceman rolling off the production line at Zhangjiagang, Jiangsu, is a perfectly German car in almost every respect — designed in Munich, engineered by BMW, badged with the Union Jack heritage that its brand has traded on for six decades. The factory, however, belongs to Great Wall Motor. The batteries are Chinese. And starting in late October 2024, every one of those small electric crossovers exported to Europe arrived carrying a 20.7% countervailing duty on top of the EU’s standard 10% import levy. That tension — between where a brand lives in the consumer’s imagination and where it is physically built — now sits at the centre of the most consequential trade dispute in the European automotive industry’s recent history.
European brands manufacture cars in China to exploit a cost advantage in battery and component supply chains that can reach 90% cheaper than European equivalents. BMW, Volvo, and Polestar established Chinese factories to serve the local market and reduce production costs for global export — a strategy now under pressure from EU tariffs of up to 20.7% and proposed local-content rules requiring 70% EU-made components for subsidy eligibility.
For the better part of a decade, manufacturing European-brand vehicles in China was an elegant solution to two converging pressures: the extraordinary cost advantage of Chinese battery and component supply chains, and the imperative to establish a local footprint in the world’s largest car market. The logic was impeccable. A BMW iX3 built in Shenyang through the BMW Brilliance joint venture could reach European showrooms at a price its Leipzig-built equivalent could not match. A Volvo EX30 assembled in Zhangjiakou gave Geely-owned Volvo a sub-€40,000 electric entry point that repositioned the Swedish brand for a new generation of buyers.
That arithmetic is now being systematically dismantled. According to Bloomberg analysis, Chinese brands accounted for 11% of all electrified car sales in Europe across 2025, more than doubling their share from 2024 — and that figure rises to roughly one in seven when non-Chinese brands manufacturing in China are counted alongside them. The competitive pressure is real. So, increasingly, is the policy backlash.
Which European Cars Are Made in China — and Why It Happened
The roster of European cars made in China is longer and more distinguished than most European consumers realise. BMW produces both the electric Mini Cooper and the Mini Aceman at Zhangjiagang through Spotlight Automotive, a joint venture with Great Wall Motor established in 2018. Reuters reported in February 2026 that BMW is now in active negotiations with the European Commission over a minimum-price model that could replace the tariff entirely — mirroring a precedent set weeks earlier when Volkswagen’s Cupra brand secured the EU’s first-ever tariff exemption for its Tavascan SUV, built in China and now cleared to enter Europe under a minimum import price and annual quota arrangement.
Volvo, owned by China’s Geely Group since 2010, operates three Chinese factories and for years exported its compact EX30 from Zhangjiakou to every major market worldwide. The EX90 SUV, the EM90 people-carrier, and the S90 saloon are still assembled in China. Polestar — the Geely-backed performance brand spun out in 2017 — builds its entire model range on Chinese soil: the Polestar 2 in Zhejiang, the Polestar 3 in Chengdu, the Polestar 4 in Ningbo.
€2 billion — estimated annual EU tariff revenue from China-made EVs. Roughly 80% is collected from Chinese brands; the remainder from BMW, Mini, Tesla, Volvo, and other Western manufacturers producing in China. Source: CEPR, January 2026.
The deeper structural reason for this geography is cost. Chinese battery manufacturing retains a roughly 90% price advantage over European equivalents, according to a March 2026 Transport & Environment analysis — meaning that building an EV in Chengdu and shipping it westward was, for years, materially cheaper than building it in Ghent even after accounting for logistics. BMW, in its plainest internal admissions to British officials, delayed investment in Mini’s Oxford plant for electric production citing precisely this calculus. “Market uncertainty” was the official framing; competitive cost disadvantage was the substance.
Renault produced its Dacia Spring — Europe’s cheapest electric car — in China through a Dongfeng joint venture until tariff pressure forced a pricing recalculation. The broader picture is one of a decade-long industrial migration that European policymakers tolerated, then encouraged, then abruptly decided to reverse.
Why EU Tariffs Hit European Brands as Hard as Chinese Ones
What tariffs apply to European cars made in China?
European-branded vehicles manufactured in China face the same countervailing duties as their Chinese-owned competitors, because the EU’s anti-subsidy investigation was geographic, not proprietary. Any battery-electric vehicle built in China and exported to the EU is subject to the additional levy, regardless of whether the parent company is headquartered in Shanghai or Stuttgart. BMW Brilliance Automotive — the joint venture that produces the iX3 and Mini models — was designated a “co-operating company” in the EU probe, earning a 20.7% additional duty rate. Geely, as Volvo’s parent, faced an 18.8% rate on its Chinese-built models, lifting Volvo’s total import duty from 10% to nearly 29%.
“A price floor keeps consumer prices artificially high, effectively transferring income from European consumers to Chinese producers — and European brands bear that cost too.”
— Centre for Economic Policy Research, January 2026
The proposed workaround — replacing tariffs with minimum import prices — is not obviously better for the brands caught in the middle. CEPR economists warned in January that a price floor would simply transfer surplus from European consumers to Chinese and Western producers alike, without altering the underlying competitive dynamics. BMW shareholders might welcome the margin preservation; BMW buyers almost certainly would not.
EU Additional Countervailing Duties on China-Made EVs (on top of standard 10%)
| Brand / Group | Additional Duty | Status |
|---|---|---|
| BYD Group | +17.0% | In force since Oct 2024 |
| Geely Group (incl. Volvo, Polestar) | +18.8% | In force since Oct 2024 |
| BMW Brilliance (incl. Mini, iX3) | +20.7% | Under minimum-price negotiation |
| SAIC Group (incl. MG) | +35.3% | In force since Oct 2024 |
| VW Cupra Tavascan | 0% | Exempted Feb 2026 (min. price + quota) |
The Cupra Tavascan precedent is worth dwelling on. Volkswagen’s willingness to accept a price floor — effectively committing to sell its China-made SUV at a minimum threshold — represents the first successful navigation of this new regulatory terrain by a Western brand. It won’t be the last. BMW’s parallel negotiations with Brussels signal that the minimum-price model is becoming the de facto template for resolving the inherent awkwardness of European brands penalising themselves through their own supply chain choices.
The Industrial Accelerator Act and the 70% Threshold That Changes Everything
Even with tariff exemptions in play, the policy ground beneath European-brand China manufacturing is shifting more fundamentally. On 4 March 2026, EU Industry Commissioner Stéphane Séjourné unveiled the Industrial Accelerator Act — Brussels’ most ambitious industrial policy intervention since the Green Deal. The legislation, tabling a 70% EU-content requirement for electric vehicles, would directly condition public financial support for vehicle purchases on where they are made. Cars built in China by any company — including BMW, Volvo, and Polestar — would be ineligible for subsidy-backed purchase schemes in the EU’s member states.
That is not a marginal threat. Public incentive schemes have been central to EV uptake across Germany, France, and the Netherlands. Strip those incentives from China-sourced models and the competitive case for keeping production there collapses almost entirely — at least for the European market.
70% — EU content requirement for EVs under the Industrial Accelerator Act. The threshold would exclude any China-manufactured vehicle — European-branded or otherwise — from public purchase subsidies across EU member states. Source: Euronews, March 2026.
Volvo has already read this signal. Belgian production of the EX30 began in Ghent in April 2025, transferring the model out of Chinese manufacturing and into the IAA’s safe harbour. The switch cut waiting times from up to eight months to roughly 90 days, and it sidestepped the 28.8% combined duty that was eating into margins on every China-shipped unit. The EX40 is expected to follow into Ghent production in 2026. What looked like an expedient tariff dodge is now something more structural: a reorientation of where Volvo’s European product range is actually manufactured.
BMW’s trajectory is more complicated. The Mini Cooper and Aceman remain in Zhangjiagang, and BMW has delayed the Oxford electrification investment repeatedly. If the Industrial Accelerator Act passes in its current form, retaining that China production for European sales becomes very difficult to justify. China’s Ministry of Commerce threatened formal retaliation on 27 April 2026, arguing that the IAA’s local-content requirements violate WTO principles — a complaint Brussels has heard before and, on past evidence, is prepared to absorb.
The Case for Keeping Production in China — and Why It Still Has Force
The protectionist momentum in Brussels is real. It doesn’t follow that re-shoring European-brand production from China is straightforwardly desirable — or even achievable at a price European consumers will accept.
Transport & Environment’s own modelling, cited in its March 2026 report, suggests that European battery manufacturing could close the cost gap with China to around 30% if the continent scales production aggressively. That is a significant reduction from the current 90% gap. It is also still a 30% disadvantage — one that will be passed on to car buyers unless subsidised away through the same public funds the IAA seeks to redirect.
The arithmetic hasn’t changed. Only the politics has.
Polestar’s first-quarter 2026 results showed widening losses and deteriorating gross margins even as volume grew, with tariffs cited as a direct contributor. Moving production to South Korea and the United States — as Polestar is attempting — addresses the political problem but not the cost one. Building elsewhere is simply more expensive.
There is also a subtler argument that European policymakers tend to dismiss: the jobs created by European-brand China manufacturing are not zero. BMW’s Shenyang operations employ tens of thousands of workers, and the component supply chains feeding Volvo’s Chinese plants generate economic activity across Geely’s sprawling industrial network. When Chinese officials argue that the IAA’s local-content rules would “harm European consumers and global industry alike,” they’re not entirely wrong — though their primary motivation is self-evidently not European consumer welfare.
The more honest version of the counterargument is a timing one. If European battery manufacturing is still 30% more expensive than Chinese supply in 2026, mandating 70% EU content now means mandating higher car prices now. The transition costs are front-loaded. The competitive payoff — a Europe that can actually build the components its automotive industry needs — is, at best, a decade away.
A Decade’s Logic, One Season’s Politics
What is unfolding is not simply a trade dispute. It is the reckoning for a strategic calculation that made financial sense for much of the 2010s: that European brands could manufacture in China, capture its cost advantages, serve its domestic market, and remain primarily European companies in any sense that mattered to regulators or consumers. That assumption has proved fragile in both directions at once. Chinese domestic demand for European brands has softened as homegrown competitors improved. And European regulators, alarmed by the pace of Chinese brand expansion at home, have decided that the implicit subsidy flowing to European-brand China manufacturing can no longer be tolerated.
Volvo’s Ghent pivot, BMW’s Brussels negotiations, Cupra’s minimum-price precedent — these are not isolated events. They are the first movements of a much larger industrial reshuffling, one that will take years to complete and whose final cost — to consumers, to brands, to the workers on both sides — remains genuinely uncertain.
The badge still says Munich. But for how much longer the factory says China is now a political question as much as an economic one.
Discover more from The Economy
Subscribe to get the latest posts sent to your email.



Navigating Mortgage and Loan Refinancing in a High-Yield Environment
Global public debt crossing critical thresholds has kept central bank policies volatile, resulting in fluctuating US Treasury yields throughout 2026. For homeowners and commercial property holders burdened by previous high-interest borrowing cycles, finding optimal refinance windows has become a high-stakes financial puzzle. Stalled disinflation and stubborn employment numbers mean rate cuts are incremental, requiring borrowers to act with precision.
Timing your mortgage or commercial loan refinance in this environment requires a deep understanding of yield curve movements and lender risk appetites.
Decoding 2026 Refinance Dynamics
The 10-Year Treasury Yield Benchmark
Mortgage rates continue to track closely with the 10-year US Treasury yield. When macroeconomic anxiety spikes debt issuance, yields rise, tightening consumer borrowing capacity. Savvy borrowers monitor weekly Treasury auctions to lock in rates during brief dip windows.
Hybrid ARMs and Alternative Structures
With fixed rates remaining elevated, 7/1 and 10/1 adjustable-rate mortgages (ARMs) have surged in popularity. These products offer lower initial monthly payments, giving borrowers breathing room until central bank easing cycles fully materialize.
| Loan Product | Current Rate Range | Best For | Key Risk Factor |
| 30-Year Fixed Mortgage | 6.2% – 6.8% | Long-term predictability | Higher initial monthly outlay |
| 7/1 Hybrid ARM | 5.5% – 5.9% | Short-term ownership / flipping | Rate reset risk after year 7 |
| Commercial Refinance | 7.0% – 8.2% | Corporate asset restructuring | Strict DSCR lender covenants |
Actionable Steps for Successful Refinancing
To maximize your chances of securing favorable refinance terms in a volatile market, follow a disciplined preparation strategy.
Boost Your Credit Score Immediately: Lenders in 2026 are applying stringent credit tiering; a 20-point increase can drop your APR by a crucial quarter-point.
Shop Regional Credit Unions: Smaller financial institutions often offer portfolio loans with more flexible underwriting than major national banks.
Calculate the Break-Even Point: Ensure your total closing costs are recouped through monthly savings within 24 months of closing.
“Market Strategist View: Refinancing in 2026 is an exercise in opportunistic timing. Borrowers must maintain immaculate financial profiles ready to strike the moment Treasury yields dip.”
Mastering the complexities of today’s debt environment ensures you can successfully lower your debt service costs and protect your long-term financial stability.
Discover more from The Economy
Subscribe to get the latest posts sent to your email.

The days of pulling generic auto insurance quotes based purely on your zip code and age are officially over. In 2026, insurance comparison engines are powered entirely by generative AI and real-time telematics. These platforms digest thousands of live data points—ranging from your driving smoothness via connected vehicle sensors to real-time traffic congestion patterns—to generate hyper-personalized premiums instantly.
For consumers, this evolution represents both a massive opportunity for savings and a hidden trap for penalty pricing. Understanding how AI algorithms evaluate risk is essential for anyone looking to lower their monthly auto insurance premiums.
How AI Comparison Engines Evaluate Your Risk Profile
Behavioral Telematics and Connected Cars
Modern cars stream performance data directly to insurance aggregators. Generative AI models analyze braking sharpness, acceleration curves, cornering G-forces, and phone distraction metrics. Drivers who maintain smooth, defensive habits are rewarded with dynamic rate cuts of up to 40% compared to traditional rating tiers.
Predictive Traffic and Weather Modeling
AI tools now cross-reference your daily commute route with predictive weather and accident probability models. If your standard parking location or driving corridor has a statistically higher incidence of uninsured motorist claims, your quotes will reflect that hyper-local risk assessment.
| Comparison Factor | Traditional Rating Model | 2026 Generative AI Model | Impact on Premium |
| Mileage & Usage | Annual estimated odometer reading | GPS tracking & live trip duration | High (up to 35% savings) |
| Driving Behavior | MVR driving record & accidents | Real-time braking, speed, & G-force | Critical (determines tier) |
| Vehicle Tech | Make, model, and safety rating | ADAS calibration & repair cost data | Moderate |
Strategies to Lower Your AI-Driven Insurance Quote
To outsmart the algorithm and secure the lowest possible premium in 2026, drivers must proactively manage their digital footprint on insurance platforms.
Opt-In for Telematics Trial Periods: Many insurers offer immediate 15% discounts just for installing their driving app; let it track safe habits for 30 days to lock in permanent savings.
Scrub Unverified Public Records: Ensure your motor vehicle report is free of clerical errors that AI risk models misinterpret as reckless behavior.
Compare AI Aggregators: Use platforms that integrate multi-carrier API feeds rather than single-brand comparison sites to find the best risk-adjusted rate.
“Industry Note: AI-driven pricing rewards transparency and precision. Drivers who actively manage their telematics data consistently out-save those relying on legacy quote calculators.”
Embracing AI comparison tools allows savvy policyholders to customize coverage limits precisely to their driving habits, eliminating wasted premium spend while ensuring robust protection.
Discover more from The Economy
Subscribe to get the latest posts sent to your email.

Despite decades of bans and strict handling mandates, asbestos remains a silent killer across legacy manufacturing plants, shipyards, and modern green-energy infrastructure retrofits. In 2026, regulatory changes by the EPA and tightened occupational health standards have triggered a fresh wave of mesothelioma litigation. Manufacturers attempting to fast-track industrial transitions are encountering catastrophic oversight, exposing workers to legacy toxins and opening corporate parent companies to unprecedented liability.
Navigating a mesothelioma claim in 2026 requires understanding how modern industrial supply chains intersect with historical exposure. Trusts established decades ago are being audited under stricter transparency laws, altering payout ratios and accelerating fast-track settlements for terminally ill plaintiffs.
Modern Industrial Exposure Hotspots
Green Retrofitting and Renewable Energy Infrastructure
A primary source of 2026 asbestos exposure occurs during the decommissioning and retrofitting of older industrial facilities for renewable energy production. Workers insulating electrical grids, modernizing HVAC systems, or upgrading manufacturing floors frequently disturb encapsulated asbestos materials that were improperly documented or ignored during facility audits.
Automotive and Aerospace Supply Chains
With advanced manufacturing booming, workers handling specialized friction materials, gaskets, and heat shields face ongoing risks. Supply chain tracing has become more sophisticated, allowing legal teams to pinpoint exact corporate entities responsible for raw material distribution across multinational borders.
| Industry Sector | Primary Exposure Risk | Legal Venue / Trust | Avg. Claim Value Range |
| Green Energy Retrofit | Disturbed insulation, pipe lagging | Federal Tort / Manufacturer Trust | $1.2M – $3.5M |
| Shipbuilding & Marine | Boiler insulation, structural seals | Asbestos Bankruptcy Trusts | $800K – $2.4M |
| Automotive Manufacturing | Brake components, high-heat gaskets | Third-Party Product Liability | $600K – $1.8M |
Securing Maximum Compensation: Steps for Plaintiffs
Time is of the essence in mesothelioma cases. Plaintiffs and their families must act decisively to secure financial recovery before statutes of limitations expire.
Retain Specialized Counsel: Work exclusively with national mesothelioma law firms possessing deep historical databases of asbestos-containing products.
Audit Employment History: Document every job site, supervisor name, and equipment brand encountered throughout your career.
Expedite Medical Filings: Secure a formal pathological diagnosis quickly to qualify for expedited trust fund distribution and priority trial settings.
“Expert Insight: Modern asbestos litigation is no longer just about historical tracking; it is about holding modern corporations accountable for failing to conduct rigorous environmental safety audits before initiating industrial retrofits.”
By combining meticulous work history reconstruction with aggressive multi-trust filings, victims can secure substantial financial relief to cover specialized immunotherapy and family support.
Discover more from The Economy
Subscribe to get the latest posts sent to your email.

Crypto Daily Outlook: Bitcoin, Altcoins, and the Future of Decentralized Finance

Anthony Scaramucci’s Crypto Prediction: Why MicroStrategy’s Move Is Bitcoin’s “iPhone Moment”

Best Dividend Stocks 2026: European & Asian Blue Chips

World Bank & IMF Reports 2026: Why the “3% Growth” Consensus Is Actually a Debate

Elon Musk’s Boring Company Hits $23B Valuation After UAE-Led $3 Billion Series D

Middle East War Economics 2026: Oil Prices & Energy Markets

PSX Forecast 2026: KSE-100, IMF Reviews & Geopolitics

Asian Markets Outlook 2026: China, Japan & Singapore Stocks

Global Economy 2026: IMF Growth, Inflation & Private Credit

Current Account Deficit (CAD) : Causes and Impact

Balance of Payments (BOP)

The Falkland Islands Dispute: Sovereign Wealth, Offshore Drilling, and Market Impacts

Gross Domestic Product (GDP): Nominal vs. Real

What is Inflation and the Consumer Price Index (CPI)?

State Farm’s $5B Dividend 2026: Who Qualifies & Payout Dates

US-China Relations in Q3 2026: Trade Tariffs and Supply Chain Risks

Gold’s Wild 2026: From a Record $5,600 Peak to a 24% Crash and Back Toward $4,500

Oil Surges as Strait of Hormuz Traffic Collapses Again

The Rocket That Won’t Quit: Inside SpaceX’s Falcon 9 Launch Machine

Bank of England Set to Hold Rates Through Year-End, Reuters Poll Shows

SpaceX Starship Flight 14: First Orbital Attempt & Starlink V3 Launch Explained

The 2026 Crypto Regulatory Shift: What It Means for Institutional Investors

AI Chip Stocks 2026: The Best Semiconductor Investments Beyond Marvell

Retail Earnings Week: What Home Depot, Target & Walmart Reveal

AI-Powered Training: The Next Multi-Billion Dollar Ecosystem in Fitness

Top 30 Stocks for Investment in PSX for Massive ROI in 2026

Russia’s Black Sea Oil Exports Fall for a Fifth Straight Week

Tween Back-to-School Trends 2026: What’s Driving the $85B Season
-

 Markets & Finance8 months ago
Top 15 Stocks for Investment in 2026 in PSX: Your Complete Guide to Pakistan’s Best Investment Opportunities
-

 Analysis7 months ago
Johor’s Investment Boom: The Hidden Costs Behind Malaysia’s Most Ambitious Economic Surge
-

 Analysis7 months ago
Top 10 Stocks for Investment in PSX for Quick Returns in 2026
-

 Analysis7 months ago
Brazil’s Rare Earth Race: US, EU, and China Compete for Critical Minerals as Tensions Rise
-

 Banks8 months ago
Best Investments in Pakistan 2026: Top 10 Low-Price Shares and Long-Term Picks for the PSX
-

 Investment8 months ago
Top 10 Mutual Fund Managers in Pakistan for Investment in 2026: A Comprehensive Guide for Optimal Returns
-

 Global Economy9 months ago
15 Most Lucrative Sectors for Investment in Pakistan: A 2025 Data-Driven Analysis
-

 Global Economy9 months ago
Pakistan’s Export Goldmine: 10 Game-Changing Markets Where Pakistani Businesses Are Winning Big in 2025