
Oil Markets
China’s Oil Shock Absorber: How Beijing Kept Crude Prices Half of What Analysts Predicted


Analysts predicted oil above $200 during the Hormuz crisis. China’s intervention kept prices roughly half that. Fortune and Bloomberg explain how Beijing did it — and why the strategy has limits that markets have not fully priced in.
The $200 Oil That Never Arrived
When Iranian forces declared the Strait of Hormuz closed in early March 2026, the analytical consensus in energy markets shifted rapidly toward a catastrophic scenario. The Strait carries 27% of globally traded crude oil and petroleum products (Congressional Research Service, 2026). Iran had demonstrated both the capability and willingness to enforce that closure through attacks on shipping. A sustained blockade, analysts projected, could push Brent crude to $150, $175, or even above $200 per barrel — levels not seen since the 1970s oil shocks in real terms.
Brent reached approximately $113 at its peak in April. That is a severe price spike by any historical standard — a 100%-plus rise from January levels of around $56. But it is emphatically not $200. And the primary reason it is not $200, according to reporting from Fortune and Bloomberg, is China (Fortune, June 2026).
How Beijing managed to suppress oil prices to roughly half of what the most bearish forecasters projected — and why analysts warn that capability has limits — is one of the most consequential and under-analysed stories in global energy markets this year.
Key Takeaways
- Analyst consensus during the Hormuz closure was for Brent crude to potentially breach $200/barrel
- China’s strategic reserve releases, demand management, and alternative supply sourcing kept prices around $100–113 at their peak
- China receives approximately one-third of its total oil imports via the Strait of Hormuz
- Beijing is reportedly running out of its ability to continue suppressing oil price volatility through reserves alone
- The longer-term consequence may be a permanent reshaping of Asian energy supply chains away from Gulf dependence
China’s Structural Exposure and Its Response
China is not merely a passive participant in global oil markets. It is, by a significant margin, the world’s largest crude oil importer, and the Strait of Hormuz occupies a central role in its energy security architecture. Approximately one-third of China’s total oil imports — representing about 3–4 million barrels per day — transits the Strait of Hormuz (Wikipedia / 2026 Hormuz Crisis). The disruption of that supply was not an abstract geopolitical concern for Beijing; it was a direct threat to industrial production, electricity generation, and economic stability.
China’s response operated on multiple fronts simultaneously. The most immediate was the release of strategic petroleum reserves — a buffer that Beijing has been systematically expanding since the early 2000s precisely in anticipation of supply disruptions. China’s strategic reserve capacity, estimated at approximately one billion barrels by the time of the conflict, provided a multi-month cushion that allowed Chinese refineries to maintain throughput without paying spot prices at the elevated levels that would otherwise have cleared the market (Wikipedia / Hormuz Crisis).
Simultaneously, Beijing accelerated the diversification of its spot purchasing toward West African, Russian, and Central Asian supply — suppliers not exposed to the Strait bottleneck. Russia, whose pipeline export routes run overland through Central Asia and whose Pacific coast ports access Chinese markets without Middle East transit, saw a significant increase in contracted volumes. The rapid rerouting of demand is a function of commercial relationships that China’s National Petroleum Corporation and Sinopec have been cultivating for precisely this scenario for over a decade.
Demand Management: The Hidden Tool
Less visible but equally important was demand-side management. China’s centralised economic planning apparatus has tools that market economies simply do not possess. When spot crude prices spiked, Chinese industrial regulators directed state-owned enterprises in energy-intensive sectors — aluminum smelting, steel production, cement manufacturing — to reduce output or shift to pre-accumulated inventory rather than purchase at market prices.
This is not a price mechanism adjustment; it is a direct administrative intervention in the quantity of oil demanded. By reducing industrial throughput in sectors where the marginal cost of a production pause is relatively low, Beijing effectively shifted the demand curve downward during the period of peak supply disruption — suppressing the equilibrium price without directly intervening in international markets.
The geopolitical complexity of this strategy should not be overlooked. China’s demand management created cover for an implicit diplomatic position: Beijing was neither supporting the U.S.-led international effort to reopen the Strait nor openly backing Tehran’s closure. It was simply managing its own economic exposure — a position that Xi Jinping could maintain with public statements calling the Strait’s openness “in the common interest of regional countries and the international community” while privately doing whatever was necessary to insulate the Chinese economy from the worst consequences (Wikipedia / Hormuz Crisis).
Why the Strategy Has Limits
Fortune’s analysis is clear: China’s oil shock absorption cannot continue indefinitely, and cannot protect global markets much longer at current intensity (Fortune, June 2026).
The strategic petroleum reserve, however large, is a finite buffer. It is designed to cover weeks or a few months of disruption — not a sustained multi-year reorientation of global supply chains. Every barrel released from reserve must eventually be replaced, and replacement purchases at a time of market tightness push prices back up. If the Hormuz situation were to deteriorate again after a partial reopening, China’s reserve cushion would be materially depleted compared to its pre-crisis level.
The administrative demand management approach also carries economic costs that compound over time. Cutting aluminum or steel output during a supply shock is tolerable for weeks. Sustained output reductions damage trade relationships, create delivery failures on international contracts, and impose real economic costs on the downstream industries that depend on those materials. At some point, the cost of demand suppression exceeds the cost of simply paying higher oil prices.
The most durable consequence of the crisis is not what China did in the short term — it is what it is now doing structurally. Long-term supply agreements with non-Gulf producers, accelerated domestic refinery investment, expanded strategic reserve capacity, and intensified electric vehicle and renewable energy adoption are all being fast-tracked as direct lessons of the 2026 disruption. Those investments will reduce China’s Hormuz dependency over a five-to-ten-year horizon — permanently altering the geopolitical leverage that control of the Strait confers.
What This Means for Global Oil Prices
The two-sided implication for global energy markets is stark. In the near term, as the Hormuz deal is implemented and Chinese reserve releases wind down, the physical oil market will need to find a new equilibrium without Beijing’s suppressive effect. The natural clearing price — in the absence of further disruption — is likely in the $75–90 Brent range, reflecting OPEC-plus production discipline, recovering non-Gulf supply, and the partial demand destruction caused by the price spike.
In the medium term, China’s structural shift away from Gulf dependency represents a secular demand reduction for Hormuz-routed barrels. That reduction, distributed across a five-to-ten year transition, is manageable for Gulf producers who can reroute via pipeline (Saudi Arabia, UAE) but is structurally damaging for those who cannot (Iraq, Kuwait, Qatar).
For energy investors, the China oil story of 2026 offers a counterintuitive insight: the country that was most exposed to the supply disruption also proved to be the most effective damper on the price shock. That capability will not disappear — but it will not be unlimited either. The next disruption will test reserves and administrative levers that are now partially depleted, and the price response, when it comes, may be harder to contain.
Discover more from The Economy
Subscribe to get the latest posts sent to your email.


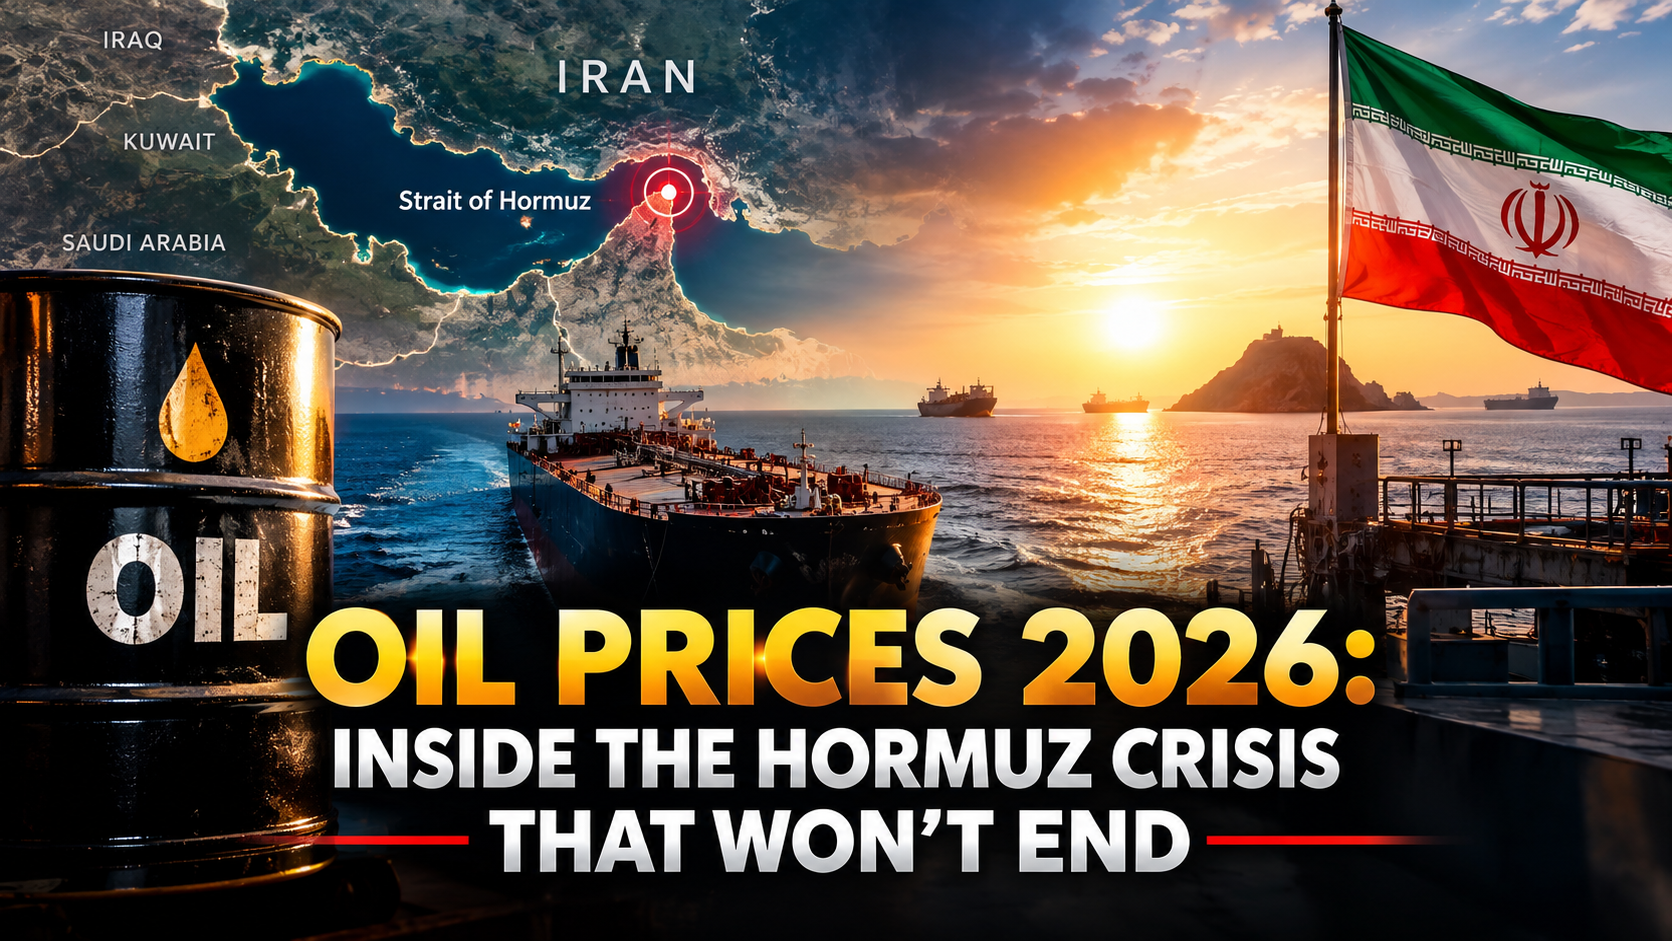
Why are oil prices so volatile in 2026? Nearly every major oil-price swing in 2026 traces back to a single chokepoint: the Strait of Hormuz, through which roughly a fifth of the world’s oil and liquefied natural gas flows, according to Reuters reporting carried by the Express Tribune. Since war broke out between the U.S., Israel, and Iran at the end of February 2026, the strait’s status — open, restricted, or effectively closed — has driven Brent crude through some of the widest swings the market has seen in years.
The Timeline: From $63 to $126 and Back
Featured Snippet Target: Brent crude averaged around $63.85 per barrel in a February 2026 analyst survey conducted just before war broke out; by March, after Iran effectively restricted Hormuz traffic, the same survey’s forecast jumped to $82.85 — a 30% increase representing the steepest one-month forecast revision in the Reuters oil poll’s history since 2005 — with prices briefly touching levels near $126 for Brent and nearly $120 for WTI at the conflict’s most acute phase.
That initial shock was followed by a genuine de-escalation. By late June, Brent fell to $73.76 a barrel — its lowest level since before the Iran war began — after reports emerged that tankers were again passing through Hormuz following a ceasefire, according to Energynomics. J.P. Morgan analysts cut their Brent forecast for the second half of 2026 to an average of $86 in the third quarter and $80 in the fourth, while a broader Reuters poll of 31 economists lowered its full-year 2026 Brent forecast to $84.50 per barrel, down from $90.44 the prior month — the first downward revision analysts had made since the conflict began, driven by the normalization of Hormuz shipping traffic.
Why the Calm Didn’t Last
That de-escalation proved temporary. By early August, oil prices were rising again on renewed concerns over Hormuz’s reopening plans, as Iran — working alongside Oman — proposed banning vessels deemed “hostile” from the strait while imposing heavy fines on rule violators, pushing Brent back up to $83.29 a barrel, according to Reuters coverage. By mid-September, tensions had escalated further still: Brent settled at $104.61 and WTI at $100.05 on September 12, having touched multi-month highs near $107-$109 earlier in the week, driven by renewed maritime security concerns spanning both the Strait of Hormuz and the Red Sea, according to PSU Connect.
That September spike also coincided with tight refining margins pushing derivative products like US diesel to historic highs — a sign that the oil-market stress has been feeding through into downstream fuel costs even during periods when crude itself wasn’t setting fresh records.
The Scenario Analysis That Kept Shifting
Throughout the year, major banks published scenario-based forecasts that essentially functioned as a real-time gauge of how seriously markets were taking the risk of a prolonged Hormuz closure. Goldman Sachs, in an April note, laid out an “adverse view” in which Brent would average above $100 a barrel through the second half of 2026 if the strait remained closed for another month, with a more extreme scenario — involving a longer closure and lost regional production — pushing Brent to $120 in the third quarter and $115 in the fourth, according to Fortune. Barclays similarly raised its 2026 Brent forecast to $100 from $85 in early May, estimating the oil market was running a supply deficit of around 6.6 million barrels per day at the time, a gap the bank warned was likely to widen the longer disruptions continued, according to Kitco.
The Knock-On Effects Across the Global Economy
Oil’s 2026 volatility hasn’t stayed contained to energy markets. Elevated and unpredictable crude prices have been cited repeatedly as a contributing factor behind mortgage-rate stickiness in the U.S. (via broader inflation pressure), the Federal Reserve’s more hawkish policy stance under new Chair Kevin Warsh, and Pakistan’s central bank holding its policy rate steady at 11.5% in September specifically because of “further increase in already elevated global commodity prices” tied to the conflict, according to the State Bank of Pakistan’s official September monetary policy statement. Fitch Ratings has separately pointed to Iran-conflict-driven oil prices as a factor pressuring global mortgage rates and building costs across its 2026 Global Housing and Mortgage Outlook.
The Bottom Line
Oil in 2026 has behaved less like a market responding to steady supply-and-demand fundamentals and more like a real-time barometer of Strait of Hormuz risk — surging past $126 at the conflict’s peak, falling to pre-war lows near $74 during the June ceasefire, and climbing back above $100 by September as tensions resurfaced. Every major bank forecast published during the year has effectively been a bet on how long Hormuz disruptions would last, and each time the strait’s status has changed, those forecasts have needed revising within weeks rather than months.
Next step: Anyone tracking oil-price exposure — whether for investment, business cost planning, or simply understanding inflation’s trajectory — should treat Strait of Hormuz shipping-traffic reports, not headline crude prices alone, as the leading indicator: traffic data has consistently moved days ahead of the price swings themselves throughout 2026.
Discover more from The Economy
Subscribe to get the latest posts sent to your email.
GasBuddy forecast sub-$3 gas for 2026. The national average is $4.33. Inside the forecast that broke, and what drivers should expect through Q4.
Executive Summary / Key Takeaways
- The US national average for regular gasoline was $4.329 per gallon on 15 September 2026 — up from $4.07 a week earlier, $3.85 a month earlier and $3.14 a year earlier.
- GasBuddy’s annual outlook, published before the Middle East conflict, projected a 2026 national average of $2.97 — the first sub-$3 year since the pandemic — and a December average of $2.83.
- The gap between forecast and reality is roughly $1.35 a gallon, and the cause is entirely geopolitical.
- Houthi attacks shut a crucial Saudi crude pipeline bypassing the Strait of Hormuz in September 2026; WTI has traded near $102–103 and Brent near $107.
- AAA reports prices inching toward the year’s record high of $4.56, set on 21 May 2026.
1. Introduction & Immediate Context
In late 2025, GasBuddy published one of the more confident fuel forecasts in recent memory. The national average would fall to $2.97 in 2026, the first sub-$3 year since the pandemic and roughly 13 cents below the 2025 average, marking a fourth straight year of decline. Prices would peak in spring in the low $3.20 range as refiners switched to summer blends, then ease to an average of $2.83 in December. Diesel would average $3.55, down from $3.62. US drivers would spend $11 billion less on gasoline than in 2025, with the average household paying about $2,083 for the year.
Patrick De Haan, GasBuddy’s head of petroleum analysis, summarised it at the time: it was not a return to ultra-cheap fuel, but for the first time in a long while the wind was clearly behind drivers’ backs.
Nine months later, the national average is $4.329 per gallon, per AAA data compiled on 15 September 2026. Understanding why that forecast failed is more useful to commuters and logistics managers than any point prediction about the fourth quarter.
2. Core Market Analysis
2.1 Forecast versus outcome
| Metric | GasBuddy 2026 forecast | Actual (Sept 2026) | Gap |
|---|---|---|---|
| National average, regular | $2.97/gal (annual) | $4.329/gal (15 Sep) | +$1.36 |
| Spring peak | Low $3.20s | $4.56 record (21 May) | +$1.36 |
| December projection | $2.83/gal | — | Pending |
| Diesel average | $3.55/gal | — | Pending |
| Household annual spend | ~$2,083 | Materially higher | — |
2.2 What actually moved
Crude is the largest single cost in a gallon of gasoline, so pump prices generally track WTI and Brent with a one-to-two week lag. WTI has been trading near $103.30 and Brent near $107.56, per market data compiled alongside AAA averages.
The proximate trigger was infrastructure, not demand. Attacks by Iran-backed Houthi rebels shut down a crucial crude pipeline in Saudi Arabia that bypasses the Strait of Hormuz, according to Trading Economics market reporting. Saudi Arabia has indicated it could restore around half of the damaged East-West pipeline’s capacity within days and resume full operations within six weeks, while offering additional cargoes through ship-to-ship transfers near Oman.
US gasoline futures have held above $3.45 a gallon, close to their highest level in eight weeks. Gasoline itself fell to $3.46 on 18 September, down 1.22% on the day, but is up 6.43% over the past month and up 76.03% compared with the same time last year.
2.3 The domestic supply picture is not the problem
This is the part most local coverage gets backwards. EIA data showed US gasoline inventories unexpectedly rising for a second consecutive week, increasing by 800,000 barrels in the week ending 11 September, as refineries continued operating at elevated capacity — 96.8%, slightly lower than prior weeks — while delaying non-essential work. Demand rose by 300,000 barrels per day even as pump prices climbed.
Inventories building while prices rise is the signature of a crude-cost-driven move rather than a domestic shortage. The forward risk is maintenance: approaching seasonal fall refinery work remains a threat to refined-product supplies, and refiners have been deferring non-essential work to keep runs high. Deferred maintenance is borrowed capacity, and it gets repaid in October and November.
Earlier in the month, AAA reported that the Labor Day weekend set a record at the pump, with the national average at $4.14 — the first time it has exceeded $4 on Labor Day, against a previous record of $3.82 set in 2012. Gasoline demand had decreased from 9.04 to 8.92 million barrels per day, and crude inventories at 424.5 million barrels sat 1% above the five-year average. Prices rose anyway.
3. Structural Drivers and Competitor Gaps
Why state-level dispersion is widening. California’s regular gasoline reached $6.001 per gallon against Indiana at $3.586 — a spread of nearly $2.42. The drivers are the nation’s highest state gas taxes, a unique cleaner-burning CARB fuel blend that few refineries produce, and limited pipeline supply that isolates the state’s market. The top ten most expensive markets as reported by AAA were California ($6.08), Washington ($5.57), Hawaii ($5.48), Nevada ($5.19), Oregon ($5.11), Alaska ($5.07), Idaho ($4.85), Utah ($4.81), Illinois ($4.78) and Michigan ($4.75).
Crude shocks amplify dispersion rather than distributing evenly. Markets with constrained refining and unique blend requirements have the least ability to substitute supply, so the same $10 crude move produces a larger pump-price move in an isolated market than in a well-supplied one. Price-comparison apps deliver the most savings precisely in these markets, because station-level variance rises alongside regional variance.
What a forecast can and cannot do. GasBuddy’s outlook explicitly listed seasonal demand, refinery maintenance, hurricane season and geopolitical tensions as sources of fluctuation. The failure was not the analysis of the fundamentals — easing global economic pressure and added refining capacity were real — but that a supply-route disruption of this scale sits outside any statistical distribution built on normal conditions. Consumers reading annual fuel forecasts should treat them as conditional on geopolitical stability, not as point estimates.
The EV comparison held steady. The national average per kilowatt hour at a public EV charging station stayed at 42 cents through the period, unchanged week over week. When liquid fuel moves 76% year-on-year and electricity does not, the relative operating-cost calculation for fleet operators shifts materially — a second-order effect that will show up in 2027 procurement decisions.
4. Key Implications for Stakeholders
Daily commuters. The practical saving available from station-level price comparison rises with regional dispersion, and dispersion is currently near its widest. In high-variance markets the difference between the cheapest and most expensive station on a routine route can exceed 25 cents a gallon.
Logistics managers. Diesel was forecast at $3.55 for 2026 on pre-conflict assumptions. Any fuel-surcharge schedule or freight contract built on that number needs revisiting. The relevant forward risk through Q4 is deferred refinery maintenance, not crude.
Retail traders. Inventories rising while prices rise is a clean signal that the move is imported from crude rather than generated domestically. Watch Saudi East-West pipeline restoration progress — a six-week full-restoration timeline, if met, is the most likely source of relief.
Household budgeters. At $4.33 against a $3.14 average a year ago, the annual household fuel bill is running far above the roughly $2,083 projected. Budgets set in January on the sub-$3 forecast are materially understated.
5. Frequently Asked Questions
Q1: What is the national average gas price right now?
The US average for regular gasoline was $4.329 per gallon on 15 September 2026, up from $4.07 a week earlier and $3.14 a year earlier, according to AAA data.
Q2: Why did GasBuddy’s 2026 forecast miss?
The forecast of $2.97 per gallon was built on easing global economic pressure and expanded refining capacity, before Middle East conflict and attacks on a key Saudi pipeline bypassing the Strait of Hormuz pushed crude above $100 a barrel.
Q3: Why is California gas so much more expensive?
California combines the nation’s highest state gas taxes, a unique CARB cleaner-burning blend that few refineries produce, and limited pipeline access that isolates its market — currently producing a regular price near $6.00 against Indiana’s $3.59.
Q4: Will gas prices fall in late 2026?
That depends primarily on Saudi pipeline restoration, which the kingdom indicated could reach full capacity within six weeks. The countervailing risk is deferred seasonal refinery maintenance, which refiners have been postponing to keep runs near 97%.
Discover more from The Economy
Subscribe to get the latest posts sent to your email.
Key Takeaways
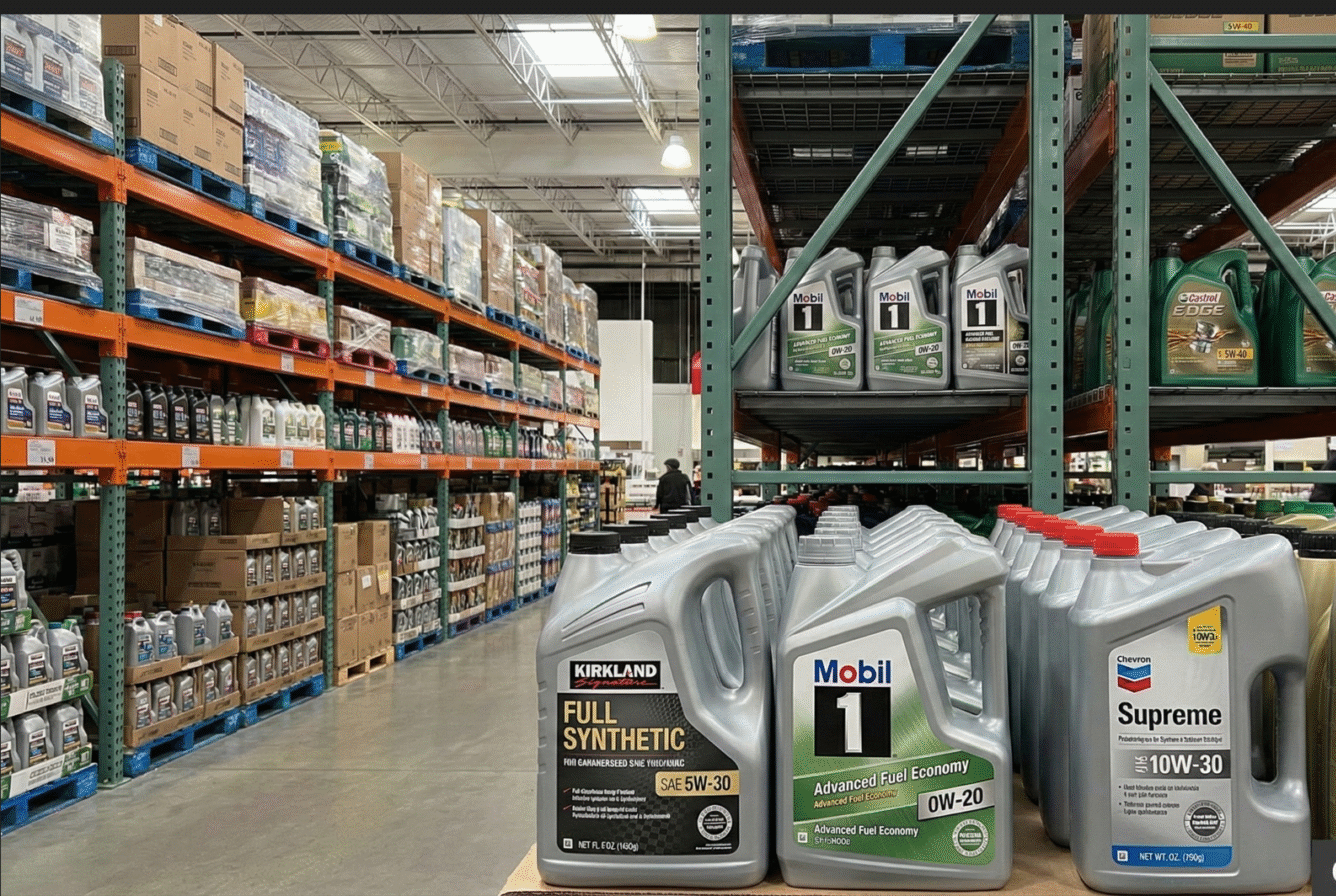
- Costco’s rationing of Kirkland Signature motor oil is a visible symptom of an industry-wide problem: the Independent Lubricant Manufacturers Association (ILMA) says roughly 44% of the US Group III base oil supply has been sidelined by Middle East conflict disruptions.
- Automakers Toyota and Nissan have already issued dealer guidance on oil-grade substitutions and allocation limits for low-viscosity synthetic formulations like 0W-8 and 0W-16, the grades most exposed to the shortage.
- Group III base oil prices have climbed to more than $10 per gallon, historically elevated levels, with some reports citing spot prices nearly tripling versus pre-conflict baselines.
- ILMA does not expect conditions to fully normalize until at least mid-2027, meaning this is a multi-quarter supply disruption rather than a temporary shelf-stocking issue.
- Retail-level “shortage” so far looks more like rising prices and shrinking selection than empty shelves nationwide — Costco’s rationing is currently one of the more extreme individual-retailer responses, not evidence that all synthetic oil is disappearing.
Costco’s decision to cap Kirkland Signature motor oil purchases made headlines, but it’s only the most visible data point in a much larger, months-long supply crunch that’s been building since the US-Iran conflict began disrupting Middle Eastern base-oil production and shipping. The real question for drivers isn’t whether one warehouse club is rationing — it’s whether all synthetic motor oil is headed toward sustained price increases and tighter supply, and the answer, based on the fullest available industry data, is a qualified yes.
The Scope of the Problem: It’s Not Just Costco
Executives at major lubricant and auto-parts companies — including Shell, Valvoline, and O’Reilly Automotive — have warned investors directly about cost pressure and supply-chain strain affecting synthetic motor-oil production. ILMA has characterized the situation as a “global base oil supply crisis,” attributing it to refinery outages and shipping disruptions through the Strait of Hormuz that have tightened the supply of Group III base oils — the refined lubricant feedstock used in most modern synthetic motor oil.
According to ILMA’s most detailed accounting, roughly 44% of US Group III base oil supply has been affected by the disruption, with the lightest viscosity grades — the 0W-20, 0W-16, and 0W-8 formulations increasingly required by modern, fuel-efficient engines — the most exposed. Group III base oil prices have climbed past $10 per gallon, a historically elevated level, with some reporting describing spot prices as having nearly tripled from pre-conflict baselines.
Automakers Are Already Rationing — Not Just Retailers
Perhaps the most telling sign that this is a supply-side, not retailer-side, problem: automakers themselves have begun rationing. Toyota has sent service departments guidance on substituting oil grades for certain hybrid models, while both Toyota and Nissan dealers reportedly received internal communications warning that allocations of genuine, factory-specified synthetic oils could become difficult to maintain consistently — particularly for lighter-viscosity grades like 0W-8 and 0W-16 used in newer, fuel-efficient engines.
A leaked memo reportedly circulated to AutoZone store managers in the Southeast described the situation bluntly, warning of “the largest supply shortage of lubricating fluids in the modern history of America” and cautioning that overall product availability could shrink by as much as 40%. Separately, industry sources indicated that Mobil and Shell informed both Costco and Walmart that they lacked sufficient packaged product to fulfill orders, raising the prospect of bare shelves in motor-oil sections at major retailers.
How Bad Is It At the Retail Level, Really?
Despite the alarming internal warnings, independent lubricant-industry analyst Tom Glenn, publisher of JobbersWorld, has cautioned against characterizing the situation as a full “broad retail shortage” — at least as of the disruption’s earlier stages. Consumer-quantity purchases (5-quart jugs at retailers like Walmart, AutoZone, and Amazon) had not been systemically constrained as of mid-2026, even as wholesale and dealer-allocation levels tightened significantly and prices rose 15–30% above 2025 baselines. Glenn’s assessment: “availability is beginning to matter as much as — and in some cases more than — price,” as suppliers increasingly operate defensively to protect access to approved synthetic formulations.
Costco’s explicit two-box, seven-day rationing policy, alongside its nearly doubled Kirkland Signature pricing, represents one of the more aggressive individual-retailer responses documented so far — suggesting either tighter supplier allocations specific to Costco’s bulk-purchase model, or a proactive anti-hoarding measure ahead of anticipated further tightening.
Price and Supply Snapshot
| Indicator | Pre-Conflict Baseline | Mid-2026 Status |
|---|---|---|
| Group III base oil price | Historically stable | $10+/gallon, up sharply |
| US Group III supply affected | 0% | ~44% |
| Retail 5-quart jug prices | Baseline | +15–30% |
| Kirkland Signature 10-qt box | ~$30 | $57.99 (rationed) |
| Expected normalization | N/A | Not before mid-2027 |
Which Vehicles Are Most Affected?
The shortage disproportionately affects owners of newer, fuel-efficient vehicles that require low-viscosity synthetic grades — particularly 0W-8, 0W-16, and 0W-20 formulations common in recent Toyota, Nissan, and other Asian-brand models. Owners of older vehicles using more conventional viscosity grades (5W-30, 10W-30) are somewhat less exposed, since those formulations rely less heavily on the specific Group III feedstock under the most severe supply pressure, though pricing pressure is being felt across nearly all synthetic categories.
Why This Matters: A Multi-Quarter Problem, Not a Blip
The most important data point for consumers planning ahead is ILMA’s own timeline: the association does not expect conditions to fully normalize until at least mid-2027, tying the recovery directly to when Middle East shipping and refining disruptions ease. That means this isn’t a short-term shelf-stocking hiccup tied to one retailer’s supply contract — it’s a structural, multi-quarter supply constraint that will likely keep upward pressure on oil-change pricing at dealerships, quick-lube chains, and DIY retail purchases well into 2027, regardless of whether any single retailer like Costco lifts its rationing policy sooner.
Frequently Asked Questions
Will all synthetic motor oil prices double, not just Costco’s?
Prices industry-wide have risen 15-30% at the consumer level as of mid-2026, with wholesale Group III base oil costs up far more sharply. Costco’s near-doubling of its Kirkland Signature product is among the more extreme individual cases rather than an industry-wide universal figure, but continued upward pressure across brands is expected through at least mid-2027.
Why are Toyota and Nissan rationing motor oil to dealerships?
Both automakers rely heavily on low-viscosity synthetic oil grades (0W-8, 0W-16) for newer, fuel-efficient engines, and these are the grades most exposed to the Group III base-oil supply disruption tied to the US-Iran conflict’s impact on Middle East shipping and refining.
When will the motor oil shortage end?
The Independent Lubricant Manufacturers Association does not expect conditions to fully normalize until at least mid-2027, meaning drivers should expect elevated prices and periodic availability issues for the coming several quarters.
Discover more from The Economy
Subscribe to get the latest posts sent to your email.

Solar Panel Installation Cost in 2026: Why the Math Changed Overnight

Business Insurance: What Coverage You Actually Need and What It Costs in 2026

Auto Insurance Quotes: How to Get the Lowest Rate Without Losing Coverage

Huntington Online Banking: Full Features, Fees, and How It Compares in 2026

Apply for a Bank Account Online: What You Need and How Long It Actually Takes

World’s Largest Economies: Ranking the Top Global Powers

Business Loan: A Complete 2026 Guide to Rates, Types, and Qualifying

Fast Invoice Factoring: How to Turn Unpaid Invoices Into Cash Within 24 Hours

Investment Banking Services: What They Cost and How to Choose the Right Firm in 2026

Structured Settlement Loan: What “Cash Now” Offers Actually Cost You

DUI Attorney: Why Your First Call After an Arrest Should Never Be to the Court

Personal Injury Lawyer: A Complete Guide to Filing Your Claim in 2026

Commercial Vehicle Accident Lawyer: Holding Companies Accountable Beyond the Driver

Inside the White House Feud: How Trump’s Allies Are Painting Anthropic’s Dario Amodei as the Face of ‘AI Doomerism’

Top 30 Stocks for Investment in PSX for Massive ROI in 2026

SpaceX Starship Flight 14: First Orbital Attempt & Starlink V3 Launch Explained

Oil Prices Break $100 in 2026: Middle East Conflict & Energy Markets

Fidelity Investments Review 2026: SPAXX Yields & Zero-Fee Funds

AI Chip Stocks 2026: The Best Semiconductor Investments Beyond Marvell

BRICS+ Cross-Border Payments 2026: Interoperability Explained

Tween Back-to-School Trends 2026: What’s Driving the $85B Season

10-Year Treasury Yield Hits 4.80%: What It Means for Rates & Portfolios

Shein Clothes Quality & Safety in 2026: What Lab Tests Show

China’s US$10.8 Billion Trade Shortcut: Why the Pinglu Canal Matters

MRVL Earnings 2026: Why Marvell Sank Despite Beating Estimates

IMF & World Bank 2026 Global Economic Outlook: Growth, Inflation, Debt

Middle East War Economics 2026: Oil Prices & Energy Markets

High-CPM Finance Niches 2026: Publisher Monetization Blueprint
-

 Markets & Finance9 months ago
Top 15 Stocks for Investment in 2026 in PSX: Your Complete Guide to Pakistan’s Best Investment Opportunities
-

 Analysis7 months ago
Johor’s Investment Boom: The Hidden Costs Behind Malaysia’s Most Ambitious Economic Surge
-

 Analysis7 months ago
Top 10 Stocks for Investment in PSX for Quick Returns in 2026
-

 Banks8 months ago
Best Investments in Pakistan 2026: Top 10 Low-Price Shares and Long-Term Picks for the PSX
-

 Analysis8 months ago
Brazil’s Rare Earth Race: US, EU, and China Compete for Critical Minerals as Tensions Rise
-

 Investment9 months ago
Top 10 Mutual Fund Managers in Pakistan for Investment in 2026: A Comprehensive Guide for Optimal Returns
-

 Global Economy9 months ago
15 Most Lucrative Sectors for Investment in Pakistan: A 2025 Data-Driven Analysis
-

 Global Economy9 months ago
Pakistan’s Export Goldmine: 10 Game-Changing Markets Where Pakistani Businesses Are Winning Big in 2025