
Global Trade
US-China Trade Competition 2026: Supply Chain Relocation Guide

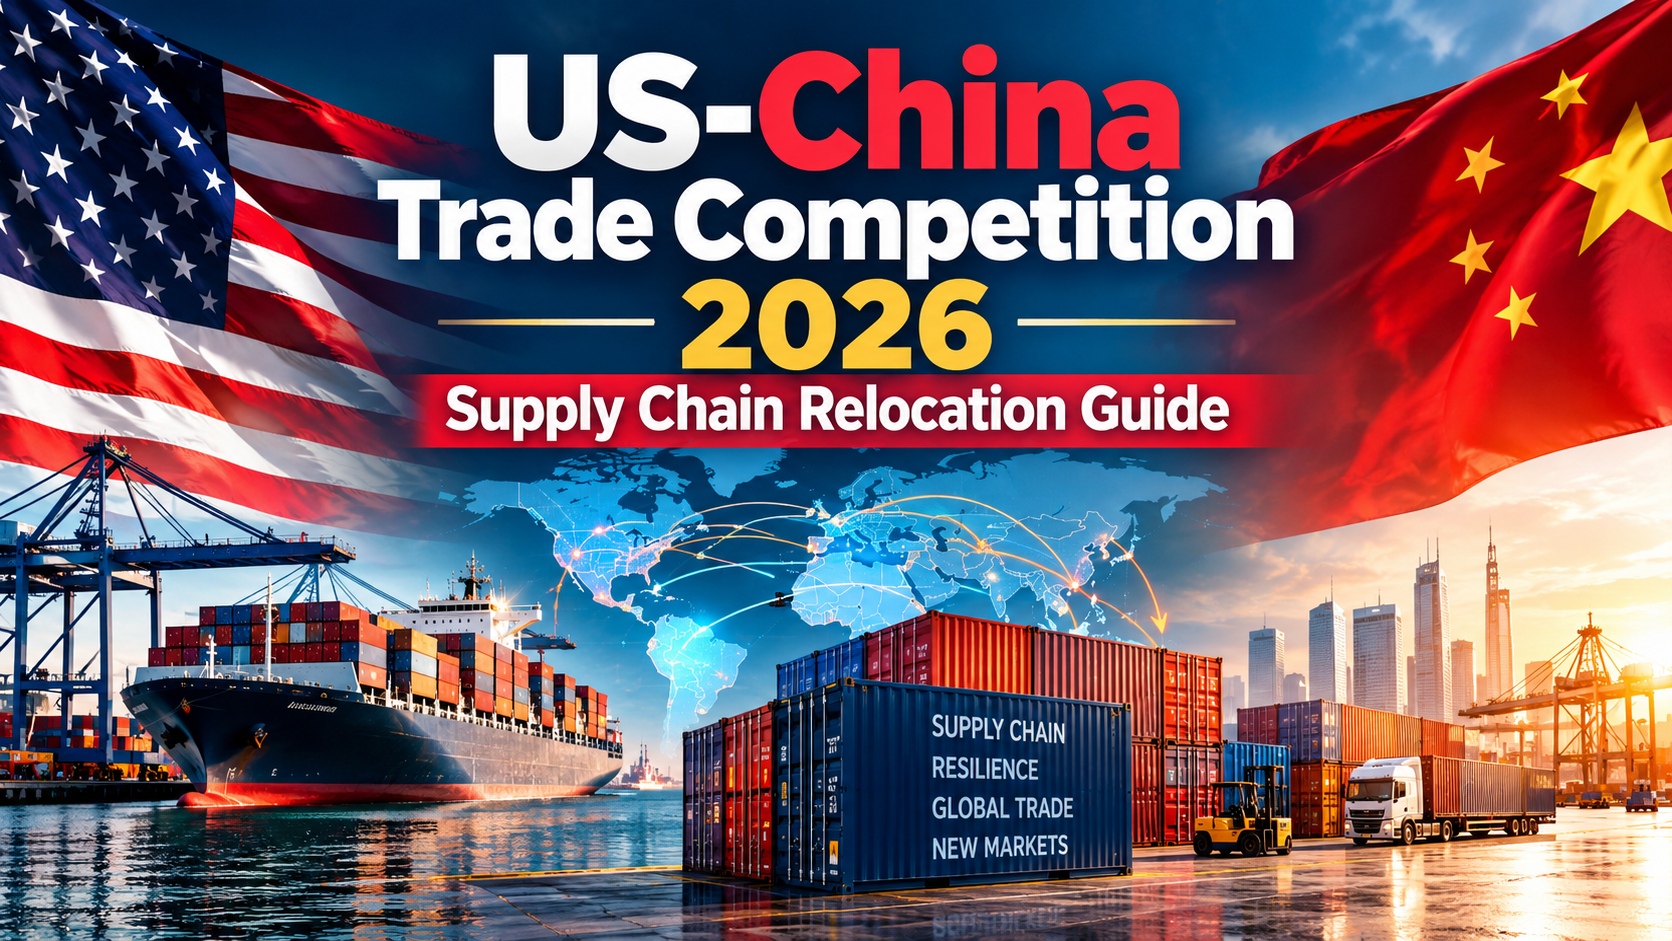
US-China trade relations in 2026 present a genuine paradox that every business with cross-border exposure must now navigate: trade is thawing in specific categories like soybeans and metals following the Trump-Xi meeting and their shared commitment to “a constructive relationship of strategic stability,” while the technology war over AI chips and export controls continues hardening in parallel. For middle-power economies positioning themselves for foreign direct investment inflows, this bifurcation — cooperative in commodities, adversarial in strategic technology — is creating the most significant supply chain relocation opportunity of the decade, with countries from Vietnam to Mexico to India competing directly for capacity that multinationals are moving out of China.
Key Takeaways
- Bilateral US-China goods trade exceeded $575 billion in 2024, even as both governments erected substantial new barriers — the relationship remains too large to exit cleanly but too fraught to navigate without a dedicated compliance framework.
- Electric vehicles from China now face a 100% U.S. tariff, with solar cells and other strategic categories subject to similarly punitive rates.
- Company survey data shows 21% of firms have deepened localization of products and services (unchanged from 2025), while 19% plan to source or assemble components outside China — down two percentage points from the prior year, suggesting relocation momentum may be plateauing rather than accelerating further.
- European firms cut investment in China by 46% between 2021 and 2023, with U.S. multinationals in strategic sectors (semiconductors, software, telecommunications) similarly reducing staff, sales, and assets while reallocating R&D toward politically aligned locations.
- China’s own manufacturing exports to Vietnam, Singapore, and Thailand show rising GVC participation between 2015–2023, revealing that China is not simply losing ground to relocation — it is actively embedding itself upstream in third-country supply chains that officially appear as “non-China” origin.
The Strategic Stability Paradox: What’s Actually Thawing and What Isn’t
The October Trump-Xi meeting produced a genuine, if narrow, de-escalation. Both leaders articulated a shared vision of “a constructive relationship of strategic stability” intended to bring enhanced certainty and predictability to the global economy — but the underlying structural competition has not reversed. China’s own Fifteenth Five-Year Plan (2026–2030), formally adopted in March 2026, continues to prioritize China’s independent economic strategy rather than integration on Western terms, even as tactical trade friction eases in specific categories.
| Trade Dimension | 2026 Status |
|---|---|
| Commodities (soybeans, industrial metals) | Thawing — improved bilateral flow post Trump-Xi meeting |
| AI chips and advanced semiconductors | Hardening — export controls expanding, no reversal signal |
| Electric vehicles | Adversarial — 100% U.S. tariff in place |
| Critical minerals/rare earths | China’s primary leverage point in negotiations |
| Investment screening (both directions) | Tightening — NDAA FY2026 restricts U.S. tech investment in China |
| Taiwan-related military posture | Hardening in parallel with tech tensions |
The Legal and Regulatory Architecture Reshaping Bilateral Investment
Several concrete measures now govern the boundaries of the relationship:
- National Defense Authorization Act for FY2026 (P.L. 119-60) restricts certain U.S. technology investment in China, codifying provisions originally established in a prior administration’s executive order.
- Commerce Department rules from 2025 restrict use of PRC-connected technology in vehicles, addressing data-security concerns tied to Chinese state ties to Chinese firms.
- TikTok’s restructuring: U.S. operations are now run by a joint venture majority-owned and controlled by U.S. persons, with ByteDance and affiliates capped at a 20% stake.
- China’s own defensiveness around high-value supply chain inputs: Chinese industry leaders have explicitly stated the need to “clarify which industrial chains…should be strictly controlled for relocation,” reflecting Beijing’s selective, opportunistic approach to which links in its supply chains it allows to move overseas.
Where the “Great Reallocation” Actually Stands in 2026
Harvard Business School research (Alfaro and Chor) tracking over 5,300 product categories confirms that U.S. imports from China have fallen to near-2001 levels — the year China entered the WTO. But the more sophisticated finding from recent global value chain (GVC) research complicates the simple “decoupling” narrative: China’s manufacturing exports to Vietnam, Singapore, and Thailand have shown sustained rising GVC participation between 2015 and 2023, particularly in machinery and transport equipment. This means a growing share of Chinese value-added content is being embedded upstream in partner economies’ re-exported goods — China is not merely circumventing direct export restrictions to the U.S., but actively integrating itself into the core production stages of third-country supply chains.
The Practical Implication for Middle Powers
This creates a genuinely nuanced opportunity-and-risk profile for countries positioning themselves as relocation destinations:
| Middle Power Positioning Strategy | Opportunity | Risk |
|---|---|---|
| Pure final-assembly relocation (limited local value-add) | Fast to establish, immediate tariff-avoidance benefit for clients | Vulnerable to “substantial transformation” scrutiny and transshipment crackdowns |
| Deep value-chain integration with genuine local manufacturing | More durable, attracts higher-quality FDI | Requires years of capacity-building; slower to capture near-term relocation demand |
| Politically “clean” structuring (minimal Chinese ownership/inputs) | Preferred by U.S. investors demanding clean structures | Higher cost of capital, more complex offshore engineering required |
U.S. investors increasingly demand “clean” structures — supply chains with minimal traceable Chinese ownership or input content — while Chinese firms face higher costs of capital and more complex offshore engineering to route around restrictions. Third-country hubs are becoming more politically sensitive precisely because they can resemble evasion rather than genuine relocation, particularly if allied governments coordinate their restrictions; where the U.S. and its partners build matched restrictions, firms lose the ability to route activity through jurisdictions with looser rules, while divergent partner policies push China to accelerate indigenous substitutes instead.
Critical Minerals: China’s Primary Remaining Leverage Point
Among all the variables shaping 2026–2027 US-China dynamics, China’s export controls on rare earths and critical minerals are explicitly identified as Beijing’s most significant leverage point in bilateral negotiations. This connects directly to the broader commodity rivalry that receives far less public attention than the technology war but carries equally significant consequences — the 2026 energy storage boom has strengthened lithium demand specifically, linking geopolitical competition directly to the energy transition’s materials, storage, and grid infrastructure supply chains. Even as Washington and Beijing formally “de-risk” in advanced technology, the two economies remain deeply intertwined through commodity flows that are far harder to sever quickly than semiconductor supply chains.
Company-Level Survey Data: Relocation Momentum May Be Plateauing
China-Briefing’s 2026 survey of multinational sentiment reveals a nuanced and somewhat counterintuitive picture:
| Metric | 2025 | 2026 |
|---|---|---|
| Firms deepening localization of products/services | 21% | 21% (unchanged) |
| Firms planning to source/assemble outside China | 21% | 19% (down 2pp) |
| Top reasons cited for moving capacity outside China | Trade tensions, risk management, U.S. tariffs | Same three factors remain dominant |
This data suggests a possible plateau rather than continued acceleration in active relocation planning — even as business optimism about US-China relations improved substantially in the 2026 survey. The consistent interpretation across multiple analyses: companies have shifted from crisis-mode reactive relocation toward a permanent, structural change in how they operate — embedding geopolitical risk explicitly into investment and operational decision-making as an ongoing discipline, rather than treating relocation as a one-time adjustment that concludes once complete.
A Framework for Middle-Power Positioning and Multinational Strategy
- Distinguish genuine relocation opportunity from transshipment risk. With U.S. Section 301 forced-labor enforcement and 40% punitive transshipment tariffs already in place, middle powers marketing themselves purely as pass-through assembly points face rising compliance and reputational risk.
- Monitor Section 301 review outcomes closely. USTR’s statutory requirement to periodically review Section 301 tariff levels means any renegotiation — even a limited phase-down on specific categories — carries significant supply chain implications for businesses that have already relocated production based on current tariff assumptions.
- Track allied-country policy coordination as a key variable. Whether U.S. partners match or diverge from Washington’s restrictions directly determines whether third-country routing options remain viable or get closed off.
- Treat critical minerals exposure as a distinct risk category from finished-goods tariffs. China’s rare earth and critical mineral leverage operates on a different timeline and mechanism than tariff policy, and requires separate hedging and sourcing-diversification strategies.
FAQ
Is the US-China trade relationship improving or worsening in 2026?
Both, depending on the category. Trade is thawing in commodities like soybeans and metals following the Trump-Xi meeting, while technology competition — particularly around AI chips, semiconductors, and export controls — continues to harden with no sign of reversal.
Which countries are benefiting most from supply chain relocation away from China? Vietnam, Singapore, Thailand, Mexico, and India have all emerged as significant relocation destinations, though research shows China is simultaneously embedding itself upstream in some of these countries’ supply chains through rising GVC participation, complicating a simple “winner” narrative.
Has the pace of companies moving supply chains out of China slowed in 2026?
Survey data suggests a possible plateau — the share of firms planning to source or assemble outside China actually declined slightly (from 21% to 19%) year-over-year, even as overall business optimism about US-China relations improved.
What is China’s most significant remaining leverage point in trade negotiations?
Export controls on rare earths and other critical minerals are explicitly identified as Beijing’s most significant leverage point, given China’s dominant position in global critical mineral processing and the difficulty of quickly diversifying these supply chains.
Discover more from The Economy
Subscribe to get the latest posts sent to your email.


While headlines in 2026 have focused on U.S.-China tariff escalation and the WTO’s institutional paralysis, the more structurally significant trend in global commerce has been quietly compounding for three decades: South-South merchandise trade has surged from about $0.5 trillion in 1995 to $6.8 trillion in 2025. Today, 57% of developing-country exports go to other developing economies, up from just 38% in 1995. For emerging market investing strategies and businesses evaluating digital services export opportunities, this reorientation — accelerating specifically because traditional U.S.- and EU-centric trade corridors have become less reliable — is arguably the single most durable growth trend in the global economy right now.
Key Takeaways
- South-South merchandise exports reached $6.8 trillion in 2025, a more than 13-fold increase since 1995, driven overwhelmingly by Asia’s regional value chains in high- and medium-tech manufacturing.
- More than half of Africa’s exports now go to other developing markets, reflecting deepening South-South integration well beyond Asia’s established regional value chains.
- Digital services exports are growing far faster than the broader global trade average: developing-country service exports grew an estimated 9% in 2025, versus a global growth estimate of just 2.6%.
- ASEAN’s Digital Economy Framework Agreement (DEFA), scheduled for signature in 2026, is projected to help push the region’s digital economy toward $2 trillion by 2030.
- Latin American digital commerce is projected to expand 12% in 2026 even as regional GDP growth sits around just 2%, with Brazilian SaaS specifically forecast to grow at a 17% annual rate from 2024–2028.
Why South-South Trade Has Become a Structural Growth Engine
The mechanics behind this shift are straightforward but consequential: as global trade tariffs and geopolitical friction make traditional North-South trade routes less predictable, businesses in developing economies are building direct commercial relationships with each other rather than routing everything through advanced-economy intermediaries. UNCTAD’s January 2026 Global Trade Update frames this explicitly — with major trading partners including the United States, China, and Europe all losing growth momentum in 2026 (global growth projected at just 2.6%, and developing economies excluding China slowing to around 4.2%), stronger regional trade and diversification have become critical to building resilience rather than optional strategic nice-to-haves.
| Metric | 1995 | 2025 |
|---|---|---|
| South-South merchandise exports | ~$0.5 trillion | ~$6.8 trillion |
| Share of developing-country exports going to other developing economies | 38% | 57% |
| Primary growth driver | — | Asia’s regional value chains (East/Southeast Asia high/medium-tech manufacturing) |
Africa’s Digital Trade Architecture Is a Genuine Case Study
Africa’s experience illustrates how South-South trade and digital services export growth reinforce each other. The African Continental Free Trade Area (AfCFTA) Digital Trade Protocol, adopted in 2025 with nine annexes and undergoing ratification across African countries in 2026, showcases digital trade as a policy priority at every level of economic development. Digitally delivered services already represent Africa’s fastest-growing export segment, projected to generate $74 billion by 2040, with business process outsourcing (BPO) and IT services identified by a joint WTO-World Bank report as the critical drivers. In Ghana specifically, business, professional, and technical services — including BPO — accounted for 77% of digitally delivered services exports in 2022, a concrete illustration of how digital services can reshape a smaller economy’s entire export profile.
ASEAN: The Region Writing the Playbook for Digital Integration
Southeast Asia’s approach to digital services export integration offers the most advanced regional model currently in operation. The ASEAN Digital Economy Framework Agreement (DEFA), concluded after two years of negotiation in October 2025 and scheduled for signature in 2026, is designed to expedite regional regulatory alignment on e-commerce, electronic payment systems, AI, privacy, and cybersecurity — areas where policy has historically been patchy across the ten-member bloc.
| ASEAN Digital Integration Milestone | Status/Timeline |
|---|---|
| Digital Economy Framework Agreement (DEFA) | Negotiations concluded Oct 2025; signature scheduled 2026 |
| Upgraded ASEAN Trade in Goods Agreement (ATIGA) | Already ratified |
| ASEAN-Australia-New Zealand FTA Upgrade | Effective April 2025 |
| ASEAN Plan of Action for Energy Cooperation (APAEC) 2026-2030 | In progress |
| Projected regional digital economy value by 2030 | ~$2 trillion |
For businesses evaluating international business banking and market-entry strategy, the DEFA’s practical significance is that it converts ten separate, inconsistent national digital-trade regimes into something closer to a single, predictable regulatory environment — precisely the kind of friction reduction that accelerates cross-border digital commerce.
Latin America: The New Priority Corridor for Asian and Global Merchants
Perhaps the clearest evidence that South-South trade dynamics are actively reshaping corporate strategy — not just macro statistics — comes from Latin America’s emergence as a priority market for Asian merchants specifically seeking growth outside uncertain developed markets. Analysis of UNCTAD and Payments and Commerce Market Intelligence (PCMI) data shows:
| Metric | 2026 Figure |
|---|---|
| Projected Latin American digital commerce growth | +12% vs. 2025 |
| Projected Latin American regional GDP growth | ~2% |
| Brazilian SaaS annual growth rate (2024–2028) | 17% |
| Global developing-country service export growth (2025) | 9% (vs. 2.6% global average) |
The gap between Latin America’s modest 2% GDP growth and its far stronger 12% digital commerce growth is itself the story: digital trade is decoupling from traditional GDP-linked growth patterns, expanding specifically because mobile usage in the region is among the highest in the world and because Asian merchants are deliberately diversifying away from developed-market dependence. This pattern is also visible across Sub-Saharan Africa, where reduced reliance on U.S.- and EU-centric trade corridors is driving increased relevance for regional and emerging-market payment and commerce platforms.
Digital Trade’s Structural Constraint: The Closing (But Still Real) Digital Divide
The single biggest risk to continued South-South trade and digital services export momentum is uneven digital infrastructure access. While digitally deliverable services drive much of the sector’s growth, this growth remains limited in least developed countries (LDCs) specifically. UNCTAD data shows the global digital services trade restrictiveness index has actually risen — from 0.168 in 2014 to 0.182 in 2024 — indicating that new regulatory barriers are emerging even as overall digital trade volumes expand. Closing this digital divide, through infrastructure investment, workforce skills development, and supportive regulation, is explicitly identified by UNCTAD as essential if LDCs are to participate meaningfully in the fastest-growing segment of global trade rather than being left further behind.
A Framework for Businesses and Investors
- Treat South-South corridors as a distinct growth thesis, not a residual category. The scale ($6.8 trillion and growing) and the structural drivers (tariff-driven diversification away from traditional partners) mean this is no longer a niche allocation for emerging market investing strategies.
- Prioritize markets with active digital-integration frameworks. ASEAN’s DEFA and AfCFTA’s Digital Trade Protocol both signal jurisdictions actively reducing regulatory friction for cross-border digital commerce — a meaningful de-risking signal for market entry decisions.
- Watch the digital services trade restrictiveness index as a leading indicator. Its steady rise despite booming digital trade volumes suggests regulatory fragmentation risk is building even within the South-South growth story, not just in traditional North-South relationships.
- Evaluate international business banking partners specifically for South-South payment rail capability. As trade reorients away from traditional corridors, payment infrastructure built for USD/EUR-centric settlement increasingly lags behind actual trade flow patterns.
FAQ
How large has South-South trade become?
South-South merchandise exports reached approximately $6.8 trillion in 2025, up from about $0.5 trillion in 1995 — a more than 13-fold increase, with 57% of developing-country exports now going to other developing economies.
Which region is leading digital trade integration in the developing world?
ASEAN is generally viewed as the most advanced model, with its Digital Economy Framework Agreement (DEFA) scheduled for signature in 2026 and projected to help push the region’s digital economy toward $2 trillion by 2030.
Why is Latin America becoming a priority market for Asian companies?
Asian merchants are deliberately diversifying growth strategies beyond uncertain developed markets, and Latin America’s high mobile usage rates are driving digital commerce growth of roughly 12% in 2026, far outpacing the region’s modest 2% GDP growth.
What is the biggest obstacle to continued digital trade growth in developing countries? Uneven digital infrastructure access remains the primary constraint, particularly for least developed countries, compounded by a rising global digital services trade restrictiveness index that signals growing regulatory fragmentation even as trade volumes expand.
Discover more from The Economy
Subscribe to get the latest posts sent to your email.

The World Trade Organization’s 14th Ministerial Conference (MC14) closed in Yaoundé, Cameroon this past March without a ministerial declaration and without consensus on its core priorities — the clearest institutional signal yet that the era of rules-based multilateral trade governance is giving way to a patchwork of global trade tariffs imposed unilaterally by major economies. For businesses managing import/export logistics in the second half of 2026, the practical consequence is not abstract: 72% of trade professionals now identify U.S. tariff volatility as the single most impactful regulatory change they face, up sharply from just 41% a year earlier. The effective U.S. tariff rate has climbed to roughly 7.2% in 2026, up from 1.5% in 2022 — the fastest peacetime trade-policy shift in decades.
Key Takeaways
- MC14 ended in impasse after 164 WTO members failed to agree on extending the e-commerce customs duty moratorium, which lapsed on March 31, 2026, allowing countries to begin imposing tariffs on digital trade for the first time in 28 years.
- New U.S. tariffs now apply to an estimated 54% of U.S. goods imports in 2026, raising the applied tariff rate to 11.8% and the effective (revenue-collected) rate to 7.2%.
- Tariffs currently imposed and scheduled are projected to raise $1.4 trillion for the U.S. government from 2026 through 2035.
- The Tax Foundation estimates the new tariffs will reduce long-run U.S. GDP by 0.4%, cut the capital stock by 0.3%, and eliminate 338,000 full-time-equivalent jobs.
- 82% of small and midsize businesses are now passing tariff costs directly to customers, up sharply from just 44% who absorbed those costs internally in 2025.
MC14’s Collapse: What It Means for the Rules-Based Trading System
The WTO’s 14th Ministerial Conference was supposed to reform an institution widely seen as struggling to remain relevant amid rising economic fragmentation. Instead, it became a symbol of that fragmentation. The headline failure — Brazil and Turkey blocking a 164-member agreement to extend the Moratorium on Customs Duties on Electronic Transmissions to December 2030 — meant the 28-year-old digital trade moratorium simply lapsed on March 31, 2026, opening the door for countries to impose tariffs on cross-border digital goods and services (streaming, software, e-books) for the first time in a generation.
| MC14 Outcome | Detail |
|---|---|
| Ministerial declaration | Failed to achieve consensus |
| E-commerce moratorium | Lapsed March 31, 2026 (previously renewed biennially since 1998) |
| Dispute settlement reform | Remains unresolved; developing countries emphasize restoring a functioning system |
| Investment Facilitation for Development (IFD) | China-led agreement opposed by India as eroding WTO’s multilateral foundations |
| U.S. position | USTR publicly stated it is “skeptical of the value of the WTO,” citing the conference outcome as confirmation |
| Attendance/engagement | Nearly 2,000 trade officials attended; only the second WTO Ministerial hosted on the African continent |
The U.S. Trade Representative’s public statement following MC14 was notably blunt, expressing frustration that so few counterparts attended despite repeated assertions that the WTO remains “at the core” of the global trading system — language that itself signals how far U.S. trade policy has already moved toward bilateral and unilateral tools rather than multilateral consensus-building.
The U.S. Tariff Architecture: A Moving Legal and Economic Target
The legal basis for U.S. tariffs shifted meaningfully in 2026. The Supreme Court’s February 20, 2026 decision in Learning Resources, Inc. v. Trump held that the International Emergency Economic Powers Act (IEEPA) does not authorize the president to impose tariffs, vacating the “reciprocal” and trafficking tariffs that had been a centerpiece of trade policy since 2025. The administration responded by shifting its tariff program to alternative statutory authorities — specifically a broad Section 301 action tied to forced-labor enforcement and a Canada-specific Section 338 proclamation.
| Tariff Metric | 2026 Figure |
|---|---|
| Share of U.S. goods imports subject to new tariffs | 54% |
| Applied tariff rate (2026) | 11.8% (up from 1.5% in 2022) |
| Effective tariff rate (revenue-collected basis) | 7.2% |
| Projected total revenue, 2026–2035 | $1.4 trillion |
| Section 301 forced-labor tariff revenue, 2026–2035 | $611.7 billion |
| Projected long-run GDP impact | -0.4% |
| Projected capital stock impact | -0.3% |
| Projected employment impact | -338,000 FTE jobs |
China: The Exception That Proves the Rule
China’s average tariff rate actually declined by 9.3 percentage points in the first four months of 2026 even as total import values also fell — a counterintuitive combination explained by China’s own export controls on critical minerals and high-performance magnet technologies shipped to the United States, which suppressed trade volume independent of tariff levels. China’s average tariff rate remained near 23% as of April 2026, still high enough to sustain strong incentives for U.S. importers to diversify sourcing away from China for both economic and geopolitical hedging reasons.
How Global Supply Chains Are Actually Responding
The “Great Reallocation” Is Real and Measurable
Harvard Business School research covering over 5,300 product categories found that U.S. imports from China have fallen to near-2001 levels — the year China entered the WTO — as companies accelerate a reallocation toward Mexico and other trading partners that predates the current tariff cycle but has sped up dramatically under it.
Transshipment Crackdowns Are Reshaping Legitimate Trade Structuring
A July 2025 Executive Order introduced a 40% punitive tariff targeting illicit transshipment — the practice of routing goods through a third country to avoid origin-based tariffs. This has forced companies engaged in entirely legitimate cross-border manufacturing (where partially completed goods move between countries for modification or packaging) to document “substantial transformation” far more rigorously than before, adding real compliance cost even to non-evasive supply chains.
Businesses Are Absorbing Less and Passing More to Consumers
| Cost Absorption Trend | 2025 | 2026 |
|---|---|---|
| SMBs passing tariff costs directly to customers | 44% absorbed internally | 82% passing directly to customers |
This is one of the most consequential shifts in the entire tariff story for supply chain management software and pricing strategy: the initial 2025 posture of absorbing costs to preserve customer relationships and market share has given way to a 2026 reality where sustained tariff volatility has made absorption financially unsustainable for most small and midsize importers.
Section 232 Critical Materials List: What’s Changing
The U.S. is actively revising its Section 232 tariff list of critical materials, with proposed changes including:
| Action | Materials |
|---|---|
| Proposed removal | Arsenic, tellurium |
| Proposed additions | Copper, lead, potash, rhenium, silicon, silver, uranium, metallurgical coal |
This revision reflects an explicit effort to align tariff policy with evolving supply-chain security priorities — particularly materials tied to defense, energy, and critical infrastructure — rather than purely trade-balance considerations.
A Supply Chain Resilience Framework for Q4 2026
- Build tariff volatility into base-case financial models, not stress-test scenarios. With 72% of trade professionals now calling tariff volatility the top regulatory risk, treating it as a tail-risk scenario rather than a planning baseline is no longer defensible.
- Audit transshipment documentation proactively. The 40% punitive tariff for illicit transshipment, combined with tightened “substantial transformation” scrutiny, means even legitimate multi-country manufacturing chains need rigorous origin documentation now.
- Reassess China-dependency exposure against the full risk picture. China’s declining average tariff rate doesn’t offset its own export controls on critical minerals — sourcing diversification remains prudent for both cost and geopolitical-hedging reasons.
- Prepare for digital trade tariffs. With the e-commerce moratorium lapsed, businesses reliant on cross-border digital goods and services delivery should model exposure to new customs duties that did not exist before March 31, 2026.
- Revisit pricing pass-through strategy. With 82% of SMBs now passing tariff costs to customers, businesses still absorbing costs internally should benchmark whether that posture remains competitively sustainable.
FAQ
What happened at the WTO’s 14th Ministerial Conference?
MC14, held in Yaoundé, Cameroon in March 2026, ended without a ministerial declaration and without consensus on core priorities, most notably failing to extend the 28-year-old e-commerce customs duty moratorium, which subsequently lapsed on March 31, 2026.
What is the current effective U.S. tariff rate?
The effective (revenue-collected) U.S. tariff rate reached approximately 7.2% in 2026, up from 1.5% in 2022, with the applied tariff rate reaching 11.8% and covering an estimated 54% of U.S. goods imports.
Are businesses absorbing tariff costs or passing them to consumers?
The trend has shifted sharply toward pass-through. In 2025, 44% of small and midsize businesses absorbed tariff costs internally; by 2026, 82% were passing those costs directly to customers.
How has the legal basis for U.S. tariffs changed in 2026?
The Supreme Court’s February 2026 ruling in Learning Resources, Inc. v. Trump held that IEEPA does not authorize presidential tariff powers, prompting the administration to shift its tariff program to Section 301 and Section 338 statutory authorities instead.
Discover more from The Economy
Subscribe to get the latest posts sent to your email.

Global trade policy debates in 2026 remain heavily focused on tariffs, container shipments, and factory reshoring — the visible, physical mechanics of international commerce. Beneath that debate, a quieter and arguably more consequential shift has already occurred: services that can be delivered remotely over computer networks — everything from IT consulting and financial services to creative and professional work — now account for 56% of all global services exports, according to UN Trade and Development (UNCTAD) data for 2024. For global business strategy, trade policy, and cross-border investment planning, this is no longer an emerging trend to monitor. It is the dominant structural fact of modern services trade.
Key Takeaways
- Digitally deliverable services accounted for 56% of all global services exports in 2024, per UNCTAD, up from a much smaller base a decade earlier — a share that has grown consistently over most of the last ten years.
- Global exports of digitally deliverable products rose 10% in 2025, continuing a similarly strong pace from the prior year, with developed economies exporting roughly $4.1 trillion and developing economies exporting an estimated $1.3 trillion.
- Developing economies’ exports of digitally deliverable services grew 12% in 2025, outpacing developed economies’ 9% growth — even as developing economies crossed the $1 trillion export threshold in this category for the first time in 2023.
- In Least Developed Countries (LDCs), digitally deliverable services represent just 16-20% of services exports — roughly a third of the global average — highlighting a widening digital trade divide even as the category grows globally.
- The WTO forecasts overall services trade growth slowing to 4.4% in 2026 (down from 6.8% in 2024), even as digitally delivered services growth remains comparatively resilient at 5.6%, reinforcing the category’s role as the more durable engine of services trade growth.
What “Digitally Deliverable” Actually Means
The 56% figure requires a precise definition to be useful for strategic planning. UNCTAD and the WTO define digitally deliverable services as those services that can be delivered remotely over information and communications technology (ICT) networks such as the internet — a category distinct from, though closely related to, the narrower measure of services actually delivered digitally in a given transaction. The digitally deliverable category encompasses ICT services themselves, along with sales and marketing services, financial services, professional and technical services, insurance services, intellectual-property-related services, and education and training services, among others.
This matters for trade strategy because it captures structural potential for remote delivery across an entire services category, not merely transactions that happened to occur digitally in a given year — making it a more forward-looking indicator of which service sectors are positioned to continue shifting toward borderless, low-marginal-cost delivery models.
The Ten-Year Trend: A Structural, Not Cyclical, Shift
The growth in digitally deliverable services’ share of total services trade has been remarkably consistent rather than a pandemic-era anomaly. While the COVID-19 pandemic did produce a temporary spike — with some measures of digitally delivered services trade briefly exceeding 60% of total services trade in 2020 — the subsequent partial normalization in 2021 and 2022 did not erase the underlying structural trend. By 2024, the 56% figure represented a continuation of growth that has been sustained over most of the past decade, with the strongest regional gains recorded in Asia (a 7.9 percentage point increase in the digitally deliverable share of total services exports over ten years) and North America (7.6 percentage points over the same period).
Global exports of digitally deliverable products continued this trajectory into 2025, rising approximately 10% year-on-year — matching the prior year’s growth rate and confirming this is a sustained trend rather than a one-time post-pandemic adjustment.
The Developed-Developing Divide: Converging, But Unevenly
The distribution of digitally deliverable services trade in 2025 illustrates both genuine progress and a persistent structural gap. Developed economies accounted for roughly three-quarters of digitally deliverable exports in 2025, worth approximately $4.1 trillion, while developing economies exported an estimated $1.3 trillion — a meaningful and growing share, but still a fraction of the developed-economy total. Developing economies’ growth rate in this category (12% in 2025) outpaced developed economies (9%), suggesting a genuine, if gradual, convergence trend.
However, this aggregate convergence masks a widening gap within the developing world. The distance between a relatively small number of highly successful developing-economy exporters and the much larger group of countries struggling to build export share in this category has widened, not narrowed, even as the overall developing-economy total has grown. Least Developed Countries illustrate this divide most starkly: digitally deliverable services represent only 16-20% of their total services exports — roughly a third of the 56% global average — and LDCs’ share of global digitally deliverable services exports has actually declined from 0.24% to 0.19% over the 2015-2023 period, despite a 43% increase in the absolute value of their exports in this category over the same window. UNCTAD’s own assessment is direct on this point: without targeted intervention, the digital economy risks entrenching existing global trade inequalities rather than alleviating them.
Sector Composition: Where the Value Concentrates
Within digitally deliverable services trade, value is heavily concentrated in a handful of sub-sectors. Computer services and financial services together represent the largest components of digitally delivered trade specifically, with other business services (encompassing diverse professional, management, and technical services) forming a substantial share of the “Other commercial services” category that dominates global services trade composition more broadly — that broader category accounted for roughly 60% of total global services trade in 2024, with Europe alone contributing about 40% of those exports.
Regional trade-flow patterns within this category also reveal distinct structural differences: European digitally deliverable service exports are heavily intra-regional, with 62% of exports remaining within the region, while North America is overwhelmingly externally oriented, exporting 82% of its digitally deliverable services outside the region — a divergence with direct implications for how trade policy shifts in one bloc ripple into the other.
Why This Matters for 2026 Trade Policy and Business Strategy
The WTO’s 2026 outlook for overall commercial services trade shows deceleration — growth is projected to slow to roughly 4.4%, down sharply from 6.8% in 2024, driven primarily by weaker transport services growth (a direct casualty of the broader merchandise trade slowdown linked to elevated 2026 tariff activity) and softer travel growth. Digitally delivered services, by contrast, are forecast to grow at a comparatively resilient 5.6% in 2026 — meaningfully outpacing the broader services trade average and reinforcing the category’s role as the more durable growth engine within global services trade during a period of broader trade policy uncertainty.
This resilience has a structural explanation directly relevant to 2026’s tariff environment: digitally deliverable services are not directly subject to tariffs in the way merchandise trade is, though they remain vulnerable to indirect spillover effects through their links to goods trade and broader economic output. For businesses and policymakers navigating an increasingly tariff-affected trade environment, this relative insulation is a meaningful strategic consideration — a services-export strategy weighted toward digitally deliverable categories carries structurally different tariff exposure than a goods-export strategy.
Strategic Implications by Stakeholder
- For exporters in developing and emerging markets: The 12% growth rate in digitally deliverable services exports from developing economies in 2025 suggests genuine, executable opportunity — but the widening gap between top-performing and struggling exporters within the developing world means market access, digital infrastructure investment, and skills development remain binding constraints rather than solved problems.
- For multinational trade and tax strategy teams: The sharp divergence in regional trade orientation (Europe’s 62% intra-regional share versus North America’s 82% extra-regional share) should directly inform where digitally deliverable service lines are structured and where cross-border service agreements are domiciled.
- For trade policymakers, including in Pakistan and similar emerging markets: The LDC data point — a declining global export share despite rising absolute export value — is a cautionary signal that digital services export growth alone does not guarantee improved relative competitive position without deliberate, targeted digital trade infrastructure investment.
- For portfolio and country-risk analysts: Given digitally deliverable services’ comparative tariff insulation and stronger 2026 growth forecast relative to transport and travel services, economies with services-export mixes weighted toward this category may exhibit somewhat greater resilience to an escalating tariff environment than goods-export-dependent economies.
Frequently Asked Questions
What percentage of global trade is digitally deliverable services?
Digitally deliverable services accounted for 56% of all global services exports in 2024, according to UNCTAD — a share that has grown consistently over the past decade and continued rising into 2025 with roughly 10% annual export growth.
Are digitally deliverable services affected by tariffs?
Not directly — digitally deliverable services are not subject to tariffs in the same way goods are, though they remain vulnerable to indirect spillover effects from broader merchandise trade slowdowns and economic uncertainty linked to tariff activity.
Is the digital services trade gap between rich and poor countries closing?
Only partially. Developing economies grew digitally deliverable services exports faster than developed economies in 2025 (12% versus 9%), but Least Developed Countries’ share of global digitally deliverable exports actually declined from 2015 to 2023, despite rising absolute export values.
Conclusion
The 56% figure represents one of the more consequential, if underdiscussed, structural facts in global trade today: more than half of all services traded internationally can now be delivered without a ship, a truck, or a border crossing in the traditional sense. For businesses and policymakers focused on 2026’s tariff-dominated trade headlines, the digitally deliverable services trend offers both a note of resilience — a growth engine comparatively insulated from tariff policy — and a note of caution, as the data makes clear that this resilience and growth are not being distributed evenly across the global economy.
Discover more from The Economy
Subscribe to get the latest posts sent to your email.

Balance of Payments (BOP)

The Falkland Islands Dispute: Sovereign Wealth, Offshore Drilling, and Market Impacts

Gross Domestic Product (GDP): Nominal vs. Real

What is Inflation and the Consumer Price Index (CPI)?

US-China Trade Competition 2026: Supply Chain Relocation Guide

Oil Prices Break $100 in 2026: Middle East Conflict & Energy Markets

South-South Trade Expansion: Digital Integration and Emerging Market Growth

$166B Tariff Refund Tapering Fast: Is Your Business Missing Out?

Stock Market Today: Dow Climbs 500 Points as Markets Shake Off Inflation Jitters

14th WTO Conference 2026: Tariffs & Global Supply Chain Impact

Swish Secures $24M Funding to Disrupt India’s $100B Food Market

Physical AI and Driverless Tech: The Next Trillion-Dollar Industrial Revolution

Enterprise AI Platforms Disrupting B2B SaaS in 2026: Full Analysis

Crypto vs. Safe Haven Assets 2026: Where Institutions Are Hedging

State Farm’s $5B Dividend 2026: Who Qualifies & Payout Dates

US-China Relations in Q3 2026: Trade Tariffs and Supply Chain Risks

Gold’s Wild 2026: From a Record $5,600 Peak to a 24% Crash and Back Toward $4,500

Oil Surges as Strait of Hormuz Traffic Collapses Again

The Rocket That Won’t Quit: Inside SpaceX’s Falcon 9 Launch Machine

Bank of England Set to Hold Rates Through Year-End, Reuters Poll Shows

SpaceX Starship Flight 14: First Orbital Attempt & Starlink V3 Launch Explained

The 2026 Crypto Regulatory Shift: What It Means for Institutional Investors

AI Chip Stocks 2026: The Best Semiconductor Investments Beyond Marvell

Retail Earnings Week: What Home Depot, Target & Walmart Reveal

AI-Powered Training: The Next Multi-Billion Dollar Ecosystem in Fitness

Russia’s Black Sea Oil Exports Fall for a Fifth Straight Week

Global Chip Selloff Deepens: What’s Driving the Aug. 19 Semiconductor Rout

Tween Back-to-School Trends 2026: What’s Driving the $85B Season
-

 Markets & Finance8 months ago
Top 15 Stocks for Investment in 2026 in PSX: Your Complete Guide to Pakistan’s Best Investment Opportunities
-

 Analysis7 months ago
Johor’s Investment Boom: The Hidden Costs Behind Malaysia’s Most Ambitious Economic Surge
-

 Analysis7 months ago
Top 10 Stocks for Investment in PSX for Quick Returns in 2026
-

 Analysis7 months ago
Brazil’s Rare Earth Race: US, EU, and China Compete for Critical Minerals as Tensions Rise
-

 Banks8 months ago
Best Investments in Pakistan 2026: Top 10 Low-Price Shares and Long-Term Picks for the PSX
-

 Investment8 months ago
Top 10 Mutual Fund Managers in Pakistan for Investment in 2026: A Comprehensive Guide for Optimal Returns
-

 Global Economy9 months ago
15 Most Lucrative Sectors for Investment in Pakistan: A 2025 Data-Driven Analysis
-

 Global Economy9 months ago
Pakistan’s Export Goldmine: 10 Game-Changing Markets Where Pakistani Businesses Are Winning Big in 2025