
Markets & Finance
Russia’s War Economy Got a Reprieve From Iran


Russia’s economy entered 2026 in genuinely fragile shape. Growth is projected at just 0.4% for the year, worse than 2025’s 1% expansion, which itself narrowly avoided recession as oil prices fell below $73 a barrel and budget revenues from oil and gas halved by January 2026 (Forbes).
The Iran-war windfall
Then came an unexpected lifeline. When the Israeli-Iran conflict effectively closed the Strait of Hormuz, the Trump administration temporarily lifted sanctions on Russian-origin oil already in transit between March and June 2026 in an effort to hold down global prices (UK Parliament Research Briefing). Brent crude surged more than 55% at the peak of the Iran war, approaching $120 a barrel, and Russia’s fossil-fuel export revenues — earning roughly €734 million a day at the low point — rebounded sharply (Forbes). The Financial Times and The Economist both characterised the episode bluntly: Putin was raking in an estimated $150 million a day in extra revenue directly attributable to the war-driven price spike (UK Parliament Research Briefing).
Russia supplied approximately 300 million barrels of oil to international markets during the sanctions-waiver window, and some observers warn the episode risked entrenching new buyer dependencies on Russian crude even after the waivers expire (Atlantic Council).
The pushback: Congress moves on the toughest bill yet
That reprieve is now colliding with the most aggressive sanctions legislation of the war. The Senate voted 86-12 on 28 July 2026 to advance the Lindsey O. Graham Sanctioning Russia and Iran Act of 2026, which would impose tariffs of up to 500% on countries importing Russian oil, gas, LNG, petroleum products or coal, ban new US investment in Russia’s energy sector, and prohibit US energy exports to Russia within 30 days of enactment (OilPrice.com). The US Treasury has already moved unilaterally, sanctioning major producers including Gazprom Neft and Surgutneftegas along with more than 180 vessels tied to Russia’s shadow fleet (US Treasury).
The EU has kept pace, agreeing its 21st sanctions package on 23 July 2026, even as several member states reportedly sought carve-outs to protect domestic corporate interests — a sign that sanctions cohesion is beginning to strain three-plus years into the conflict (UK Parliament Research Briefing).
The China and India swing factor
Whether the new measures actually damage Russia’s economy depends heavily on Beijing and New Delhi. CEPA’s analysis is direct: financial workarounds exist, and the outcome hinges on whether China and India are willing to accept secondary-sanctions risk to keep buying discounted Russian crude (CEPA). If China holds firm and continues purchasing, Moscow’s dependence on Beijing deepens further; if enforcement against third countries is applied rigorously, the ruble and Russian budget face real pressure that could push the economy into recession alongside sustained high interest rates (CEPA).
Why the 2026 budget baseline may already be wrong
Notably, Russia’s own 2026 budget baseline assumed no further meaningful sanctions would materialise — an assumption the Graham bill’s Senate momentum directly undermines (CEPA). Fossil fuel taxation still accounted for roughly 24.5% of Russian federal budget revenue through the first three quarters of 2025, meaning any serious disruption to oil exports flows directly into Moscow’s fiscal capacity to sustain the war (Brookings).
Discover more from The Economy
Subscribe to get the latest posts sent to your email.


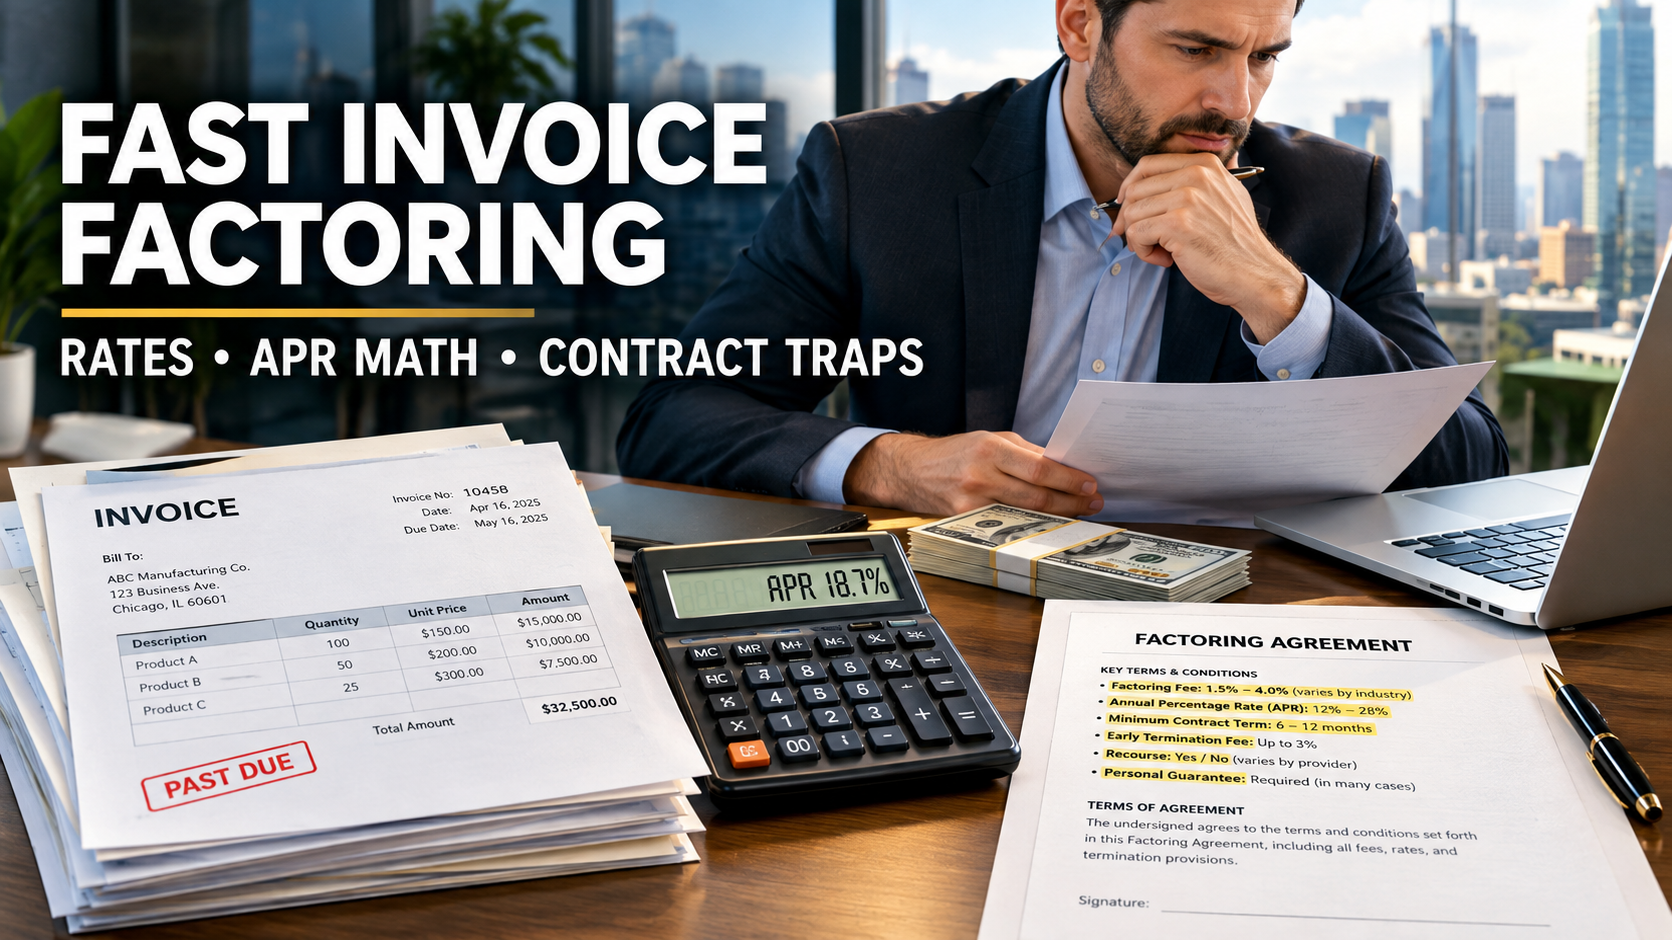
Fast invoice factoring converts unpaid B2B invoices into cash within one to two business days at a discount fee that typically runs 1% to 5% of invoice value per 30 days, with advance rates of 80% to 100% depending on the provider. On an annualized basis, that fee can equate to roughly 12% to 60% or more, which is why CFOs should compare factoring on effective APR rather than the headline rate.
Provider pricing in this guide is drawn from Forbes Advisor’s factoring rankings and NerdWallet’s factoring company guide. Legal framing references the Uniform Commercial Code as published by Cornell Law School. Ranges move with credit conditions; confirm live quotes before you sign.
Executive Summary & Core Benchmarks
Factoring is an asset sale, not a loan. You sell receivables to a factor, receive an advance, and get the reserve back after your customer pays, minus fees. Your customers’ credit quality matters more than yours.
| Metric | 2026 Benchmark | Source signal |
|---|---|---|
| Factoring fee | 1%-5% per 30 days (some tiers 2.5%-5%) | Forbes Advisor lists 2.5%-5% for one online leader |
| Advance rate | 80%-100% of invoice face value | NerdWallet lists advances up to 90% and 100% (minus fees) |
| Lowest published starting fee | ~0.8% | NerdWallet on a direct-lender factor |
| Funding speed | Next-day standard; same-day for an added fee | Forbes Advisor |
| Origination fees | $150-$500 or up to 1% of the advance | NerdWallet |
| Spot factoring | Often 3%-6% per invoice | Higher price for no commitment |
| Effective APR on a 2% / 30-day fee | Roughly 24%-27% | Calculated below |
| Target payback logic | Use only when gross margin exceeds annualized cost | See ROI section |
Key takeaway: The fee is the visible price. The reserve holdback, ancillary charges and days-to-pay determine the real price.
1: Strategic Overview & Commercial Drivers
B2B growth companies hit a structural cash gap. You pay salaries, contractors and cloud bills this month. Your customers pay on net-30, net-60 or net-90 terms. Growth widens the gap because each new contract requires working capital before revenue arrives.
Factoring closes that gap without new debt on the balance sheet. It suits companies with creditworthy commercial customers, invoices that are undisputed, and a need for speed.
Where factoring fits in the capital stack
Factoring is not a replacement for every financing product. Position it by use case.
- Bank line of credit: cheaper when you qualify, slower to arrange, and tied to your own credit and financials.
- Term loan: suits capital expenditure, not receivables timing.
- Invoice factoring: best when speed matters and your customers’ credit is stronger than yours.
- Spot factoring: best for one-off cash crunches, at a premium.
Some providers do not run a traditional credit check on the applicant. Forbes Advisor’s review notes one lender evaluating bank account and accounting software data instead, and requiring invoices to be under 90 days old.
Unit economics: when it pays
Factoring pays when the gross profit on work you can now afford to accept exceeds the factoring cost.
Factoring Net Benefit = (Incremental Gross Profit Enabled) − (Factoring Fees + Ancillary Fees)
An illustrative example: a $100,000 invoice factored at 3% total fee costs $3,000. If access to that cash lets you fulfill a second $100,000 order at 35% gross margin, you earn $35,000. The net benefit is $32,000. If the cash only prevents a late vendor payment with no growth effect, the math is much weaker.
2: Comprehensive Evaluation Matrix
Compare providers on five quantitative vectors: fee, advance rate, speed, fees beyond the discount rate, and fit. The data below is published by the outlets cited. Pricing bases differ, so read the footnotes.
Table 1: Provider comparison
| Provider (as reviewed) | Published factor fee | Advance rate | Funding speed | Additional costs and fit |
|---|---|---|---|---|
| FundThrough | 2.5%-5% (Forbes Advisor); 2.75%-8.25% on 30-day terms (NerdWallet) | Up to 100% minus fees | Next day; same-day costs extra | No credit check; invoices must be under 90 days; funding up to $10 million |
| altLINE (division of a bank) | From ~0.8% (NerdWallet) | Up to 90% | Fast; direct-lender decisions | Origination fee $150-$500 or up to 1% of advance |
| RTS Financial | Quote-based | Trucking-focused | Within 24 hours via web portal | Specialist for trucking and freight |
Why do Forbes Advisor and NerdWallet list different FundThrough ranges? They appear to reflect different pricing bases and time periods. Treat any published range as a starting point for negotiation, not a quote.
Table 2: Factoring structure comparison
| Structure | Who bears customer non-payment | Cost profile | Best for |
|---|---|---|---|
| Recourse factoring | You | Lower fees | Companies with reliable customers |
| Non-recourse factoring | Factor, within defined credit-loss limits | Higher fees; often with exclusions | Concentrated or higher-risk receivables |
| Spot factoring | Depends on contract | 3%-6% per invoice per one provider guide | One-off needs |
| Contract factoring | Depends on contract | Lower rate, volume commitments | Predictable monthly volume |
| Non-notification | Depends on contract | Customer does not see the factor | Brand-sensitive relationships |
Prime-plus pricing also exists. One provider guide describes structures tied to the prime rate plus a spread, which may suit large invoice volumes (Crestmont Capital).
3: Step-by-Step Implementation & Procurement Blueprint
Run factoring like a procurement project, not a panic button.
Implementation framework
- Audit your receivables. Age every invoice. Flag disputes, retainage, milestone billing and related-party customers. Factors reject disputed invoices.
- Rank customers by credit quality. Your best-paying enterprise customers are your most financeable.
- Calculate your cash-conversion gap. Use: Days Sales Outstanding − Days Payable Outstanding. A large positive gap is the structural need.
- Decide the structure. Recourse for low-risk books. Non-recourse when concentration risk is high. Spot for one-off events.
- Request written quotes from three factors. Ask each for the full fee schedule: discount rate, tier steps after day 30, origination, ACH or wire fees, same-day funding fees, minimums and termination fees.
- Model the effective APR for each quote at your actual average days-to-pay.
- Review the lien scope. Confirm whether the factor files a blanket lien on all assets or only on the receivables it buys.
- Negotiate the contract. Focus on term length, minimum volume, auto-renewal notice and early termination.
- Notify customers appropriately. Under UCC Section 9-406, an account debtor may pay the assignor until it receives authenticated notification of the assignment. After notification it must pay the assignee (Cornell LII: UCC 9-406).
- Pilot with one customer. Test funding speed, reporting and collections tone before you factor the whole book.
Risk checks before signing
- Customer concentration: if one customer exceeds a large share of your invoices, expect concentration caps.
- Cross-default: does factoring default trigger a default under your bank facility?
- Existing liens: a prior lender’s blanket lien may conflict with the factor’s security interest.
- Reporting burden: confirm what schedules and verification the factor requires.
Model your effective APR before you sign. Use our factoring calculator to compare three offers on the same invoice batch. Open the calculator
4: Cost Analysis, Contract Traps & ROI Mathematics
Core fee math
A factoring transaction has three moving parts: the advance, the reserve and the fee.
Advance = Invoice Face Value × Advance Rate
Reserve = Invoice Face Value − Advance
Rebate to You = Reserve − Factoring Fees
Net Proceeds = Advance + Rebate
Worked example. A $100,000 invoice, 85% advance rate, and a fee of 2% for the first 30 days plus 0.5% per additional 10-day period. The customer pays on day 50.
- Advance: $85,000
- Reserve: $15,000
- Fee: 2% + (2 × 0.5%) = 3% = $3,000
- Rebate: $15,000 − $3,000 = $12,000
- Net proceeds: $97,000
The tiered fee structure mirrors examples published by Crestmont Capital. Your contract’s tiers will differ.
Effective APR formula
Factors quote per-period fees. Lenders quote annual rates. Convert to compare.
Effective APR ≈ (Total Fee ÷ Cash Advanced) × (365 ÷ Days Outstanding)
For the example above: $3,000 ÷ $85,000 = 3.53%. Multiply by 365 ÷ 50 = 7.3. The effective APR is about 25.8%.
Notice that a simple 2% fee on a 30-day invoice with a 100% advance is about 24% annualized, and a lower advance rate raises the effective rate because the fee is charged on the full face value while you receive less cash. Always use cash advanced in the denominator.
Cost stack beyond the discount rate
| Cost line | What to ask | Typical signal |
|---|---|---|
| Discount fee | Flat or tiered? Step-up after day 30? | 1%-5% per 30 days is common |
| Origination fee | One-time or per schedule? | $150-$500, or up to 1% of the advance, on one direct lender (NerdWallet) |
| Same-day funding | Per-transaction fee? | Extra charge noted by Forbes Advisor |
| Early payment or rebate mechanics | How is the reserve released? | Varies |
| Monthly minimums | Fee if volume falls short? | Frequently negotiable |
| Termination fees | Penalty for leaving early? | Check notice periods |
| Lockbox and ACH fees | Who pays banking costs? | Small but recurring |
Contract traps
- Minimum volume clauses. You pay a fee even if you factor less than the agreed minimum.
- Auto-renewal with long notice. Negotiate notice windows down to 30 days where possible.
- Broad lien language. A lien covering all assets can block other financing.
- Notification control. Confirm the factor’s collection communications will not damage customer relationships.
- Chargeback and dilution rules. Understand how credits, discounts and disputes are treated.
- Anti-assignment clauses. Many customer contracts prohibit assignment. UCC 9-406(d) generally makes such terms ineffective against the assignment of accounts, but it has exceptions; read the text as codified in your state, for example New York’s version on FindLaw.
Ask counsel to review each of these. This guide is not legal advice.
ROI framework
Annualized Cost of Factoring = Effective APR × Average Cash Advanced Outstanding
Decision Rule: Factor when Incremental Gross Margin on Enabled Revenue exceeds Annualized Cost of Factoring plus internal administration cost.
If your gross margin is 20% and your effective factoring APR is 26%, factoring does not pay unless it prevents costlier outcomes such as missed payroll or lost contracts. If gross margin is 60%, the same APR is easily justified for growth spending.
5: Regulatory Compliance & Industry Standards
Factoring in the United States is governed mainly by state law under the Uniform Commercial Code, plus contract law and, for some structures, lending or usury statutes. Compliance points to know:
UCC Article 9
Article 9 covers sales of accounts and security interests in them. Factors typically file a UCC-1 financing statement to perfect their interest. Section 9-406 governs how an account debtor discharges its obligation and how notification of assignment works. The full text is available at Cornell LII.
Customer notification and payment redirection
After proper notification, your customer must pay the factor. If the customer pays you by mistake after notification, you hold those funds for the factor. Build a process to remit misdirected payments immediately. Failure to do so is a fast route to default.
Anti-assignment provisions
Many enterprise customer agreements contain no-assignment language. Statutory overrides exist for accounts, but customers may still resist. Check the specific state code and the customer agreement.
Lien coordination
If you already have a bank facility, seek an intercreditor or carve-out so the factor’s lien on receivables does not breach your bank covenants. Get written consent early.
Financial reporting
Whether factoring is treated as a sale or a secured borrowing on your balance sheet depends on contract terms and accounting standards. Confirm treatment with your auditor before you sign, because it affects covenant calculations.
Sanctions and KYC
Factors run know-your-customer checks on you and your customers. Expect requests for corporate documents, beneficial ownership and customer invoices.
Need a factoring contract review? Connect with commercial finance counsel who negotiate lien scope, minimums and termination terms. Find counsel
6: Enterprise Frequently Asked Questions (FAQ)
How fast can invoice factoring fund?
Many online factors fund within one business day after setup. Same-day funding is available from some providers for an added fee (Forbes Advisor). Initial onboarding, including account linking and verification, can take a few days.
What does fast invoice factoring cost?
Published ranges cluster at 1% to 5% of invoice value per 30 days, with some lenders starting near 0.8% and others quoting up to 8.25% on 30-day terms. The effective APR depends on the advance rate, tier step-ups and how long your customer takes to pay. A 2% fee over a 30-day invoice is roughly a 24%-27% annualized cost.
Is invoice factoring a loan?
Structurally, factoring is the sale of receivables, not a loan. That is why approval focuses on your customers’ creditworthiness. Accounting and legal treatment can vary by contract, so confirm with your auditor and counsel.
Recourse or non-recourse: which should a growth company choose?
Recourse factoring is typically cheaper because you keep the credit risk. Non-recourse shifts some of that risk to the factor, usually at a higher fee and with exclusions, such as disputes. Choose based on customer concentration and how reliably your customers pay.
Discover more from The Economy
Subscribe to get the latest posts sent to your email.

Hong Kong’s average wage rates recorded a 3.4% year-on-year increase in nominal terms, reflecting an enduring tight labor market across key commercial sectors. Data released by the Census and Statistics Department of Hong Kong demonstrates that after accounting for consumer price inflation, wages grew 1.8% in real terms, signaling genuine gains in employee purchasing power across the SAR economy.
The continuous upward movement in wage indices underscores a structural deficit in middle- to upper-tier manpower, further intensified by local economic restructuring and talent retention initiatives.
Key Wage Statistics at a Glance
| Economic Sector | Nominal Wage Growth (YoY) | Real Wage Growth (YoY) | Primary Industry Drivers |
| Financial & Insurance | +4.2% | +2.6% | Wealth management expansion, AI integration, regulatory compliance |
| Professional & Business Services | +3.8% | +2.2% | Legal tech, ESG reporting demand, corporate advisory |
| Transportation & Logistics | +3.5% | +1.9% | Aviation recovery, regional supply chain recalibration |
| Personal Services & Healthcare | +3.2% | +1.6% | Aging demographic demand, private healthcare expansion |
| Retail, Accommodation & Food | +2.6% | +1.0% | Local consumption adjustment, cross-border retail shifts |
Sectorial Performance: Finance and Professional Services Lead the Rally
Growth was not uniformly distributed across the economy. High-value knowledge sectors outstripped consumer-facing operational industries:
1. Financial Services & Wealth Management
The financial sector posted the strongest performance, backed by a rebound in wealth management inflows from mainland China and increased hiring within asset management and private banking. According to policy tracking by the Hong Kong Monetary Authority, institutional demand for risk management and compliance talent boosted salary floors across Tier-1 institutions.
2. Professional, Technical, and Digital Services
Consultancies, legal practices, and tech infrastructure providers recorded robust wage gains. The push toward digital transformation and mandatory sustainability reporting across listed companies created a competitive bidding environment for specialized professionals.
3. Retail, Food Services, and Consumer Travel
While hospitality and food services posted positive nominal gains, their real wage growth lagged behind the citywide average. Retail operators continue to adjust business models in response to altered consumer behavior, including weekend outbound travel by Hong Kong residents to neighboring Guangdong cities.
Real Wages vs. Inflation: Deconstructing Household Purchasing Power
While headline nominal growth stood at 3.4%, the net gain for households relies on the trajectory of the Composite Consumer Price Index (Composite CPI). Official figures from the Hong Kong Government Information Centre indicate underlying consumer inflation remained moderate at approximately 1.6% over the corresponding period.
Nominal Wage Growth (3.4%) − Inflation (1.6%) = Real Wage Growth (1.8%)
This positive differential confirms that worker compensation effectively outpaced baseline living cost increases, supporting private consumption capacity despite broader capital market volatility and elevated interest rates.
Strategic Drivers: Talent Schemes and Structural Shortages
Two major structural forces continue to dictate Hong Kong’s wage dynamic:
- Labor Supply Deficits: Demographic shifts and earlier labor force exits created persistent vacancies across both professional ranks and frontline operational roles.
- Impact of Top Talent Programs: Measures designed to import skilled workforce—such as the Top Talent Pass Scheme—are gradually replenishing senior ranks. However, as noted in economic reviews by the International Monetary Fund, the intake has primarily stabilized mid-to-senior levels while entry-to-mid operational tiers continue to face acute labor tightness, forcing employers to raise entry-level base compensation.
Macro Economic Outlook: What to Expect in Upcoming Quarters
The Hong Kong SAR Government expects further moderate wage increases through the second half of the year. Key factors influencing the trajectory include:
- Monetary Policy Easing: Global interest rate cuts are anticipated to reduce borrowing costs for small and medium-sized enterprises (SMEs), freeing up capital for workforce expansion and salary revisions.
- Cross-Border Integration: Enhanced economic alignment within the Greater Bay Area (GBA) will continue to reshape retail and service-sector wage dynamics, prompting local businesses to optimize efficiency through technology adoption.
- Corporate Cost Management: While talent retention remains a top priority, corporate profit margins are under scrutiny, leading many firms to pivot toward variable performance bonuses rather than permanent base-salary shifts.
Discover more from The Economy
Subscribe to get the latest posts sent to your email.

The Dual-Demand Trap
Silver’s 2026 surge into the $60s per ounce isn’t just a pure industrial-demand story, nor is it a pure safe-haven play. It is a potent combination of both. The unresolved AI and technology export-control dispute stemming from the late-September Xi-Trump summit in Washington is the rare market catalyst touching both sides of the equation simultaneously.
Silver Price Today: Where the Market Stands in Late September
Silver has spent the latter half of September 2026 consolidating in the low-to-mid $60s per ounce after a highly volatile summer. Following the September 16 Federal Reserve rate hike and the subsequent hawkish repricing of October rate odds, silver tested its 50-day moving average near $63.45 but demonstrated remarkable resilience.
This pricing establishes silver in a territory that analysts once treated as a distant, multi-year target. However, the wide spread between institutional bank forecasts reveals an unusually contested market, reflecting genuine disagreement on how much geopolitical risk and supply deficit is already priced in.
| Metric / Institution | Reading / Target (September 2026) |
| Spot Silver (XAG/USD) | ~$61–$67/oz trading range |
| J.P. Morgan (Q4 2026 Average) | $63.00/oz |
| Bank of America (2026 Peak) | $65.00/oz |
| HSBC (Year-End 2026 Target) | $70.00/oz |
| LBMA Analyst Panel (2026 Average) | $80.36/oz |
The AI and Export-Control Connection
Silver is a critical industrial input for electronics, solar panels, and the specialized, power-dense hardware behind AI data centers. This dual monetary-industrial identity is exactly why the ongoing technology dispute between the US and China matters so directly to silver pricing.
During the September White House summit, AI development and technology export controls were explicitly on the agenda alongside trade and Iran. However, core disagreements over AI safeguards, chip restrictions, and critical minerals remain deeply entrenched.
This combination of unresolved trade risk and tech-export tension hits silver from two directions at once:
- The Safe-Haven Squeeze: Geopolitical uncertainty pulls investment capital toward precious metals as a traditional hedge.
- The Industrial Supply Shock: Supply chains for electronics face potential disruptions if rare-earth or tech-export controls tighten, putting a premium on physical silver delivery.
Why AI Data Centers Are a Game-Changer for Silver
Most commodity coverage treats silver merely as “gold’s volatile cousin.” That framing entirely misses silver’s unique exposure to the AI buildout.
Silver is the most conductive metal on earth. As global AI infrastructure spending accelerates, the demand for silver in high-end semiconductor packaging, electrical contacts, switches, and the massive power grid upgrades required to cool and run these data centers rises structurally. Layer an unresolved US-China tech-export dispute on top of that structural AI demand, and you get a metal where bad diplomatic news and strong industrial fundamentals push the price in the exact same direction. Models built on gold’s pure monetary logic simply fail to capture this AI-driven industrial sensitivity.
The Regional Angle: Asian Demand Anchors the Floor
Asia is simultaneously the largest physical silver consumer—driven by India’s massive jewelry/investment imports and China’s undisputed dominance in solar panel manufacturing—and the region most directly affected by the trade dispute. Even with elevated energy prices, regional industrial demand for silver in electronics and solar manufacturing remains structurally firm. If the geopolitical premium eventually fades, this baseline physical demand prevents a total price collapse.
Q4 2026 Predictive Outlook
- Base Case ($62–$65/oz): Silver consolidates in this mid-$60s band through year-end. The market successfully balances physical supply tightness against the headwinds of a hawkish Federal Reserve.
- Bull Case ($70–$80/oz): A total breakdown in US-China tech negotiations or a fresh geopolitical escalation triggers a dual safe-haven and supply-chain panic, pushing silver toward HSBC’s $70 target and the LBMA panel’s $80+ average.
- Bear Case ($55–$59/oz): A durable, surprise trade resolution regarding AI chips combined with an aggressively hawkish Fed pushes speculative money out of the market, causing a retreat toward Bank of America’s lower baseline averages.
FAQ
What is driving the silver price rally in 2026?
Silver’s 2026 rally is driven by a multi-year physical supply deficit, persistent inflation hedging, and unresolved US-China tech tensions from the September summit that simultaneously boost its safe-haven appeal and threaten electronic supply chains.
Why is silver reacting to AI news?
Silver is highly conductive and essential for electronics, semiconductor packaging, and the power infrastructure required for AI data centers. Trade disputes over advanced AI chips directly threaten these hardware supply chains, spiking industrial anxiety in the physical silver market.
Will silver keep rising in Q4 2026?
Bank forecasts are heavily divided. J.P. Morgan targets $63 for Q4, while HSBC projects $70 by year-end. The ultimate trajectory depends on whether AI-driven industrial demand outpaces the downward pressure of recent Federal Reserve rate hikes.
Discover more from The Economy
Subscribe to get the latest posts sent to your email.

SpaceX Starship Achieves First Full Orbit on Historic 10-Hour Test Flight 14

Google’s $15B Finland AI Investment: Data Centers, Nuclear Power & Jobs

Fast Invoice Factoring: Rates, APR Math & Contract Traps

SOC 2 Type II Guide: Cost, Timeline & Compliance Companies

Hong Kong Wages Surge 3.4% in June: Sector Data & Analysis

Silver Price Today: Why the Xi-Trump AI Standoff Is Fueling a Safe-Haven Rally

Citibank & Dólar Estadounidense: Forex Playbook After the Xi-Trump Truce

How the Trump-Xi White House Summit Is Reshaping Mortgage Rates Today for Real Estate Investors

Indonesia Navigates Mega-Project Risks as China and Russia Eye the 2,772km Trans-Kalimantan Railway

Trump-Xi 2026 Summit Takeaways: The Trade Truce, Taiwan, and the AI Divide

Solar Panel Installation Cost in 2026: Why the Math Changed Overnight

Business Insurance: What Coverage You Actually Need and What It Costs in 2026

Auto Insurance Quotes: How to Get the Lowest Rate Without Losing Coverage

Huntington Online Banking: Full Features, Fees, and How It Compares in 2026

Top 30 Stocks for Investment in PSX for Massive ROI in 2026

SpaceX Starship Flight 14: First Orbital Attempt & Starlink V3 Launch Explained

Oil Prices Break $100 in 2026: Middle East Conflict & Energy Markets

BRICS+ Cross-Border Payments 2026: Interoperability Explained

Fidelity Investments Review 2026: SPAXX Yields & Zero-Fee Funds

Tween Back-to-School Trends 2026: What’s Driving the $85B Season

10-Year Treasury Yield Hits 4.80%: What It Means for Rates & Portfolios

Shein Clothes Quality & Safety in 2026: What Lab Tests Show

IMF & World Bank 2026 Global Economic Outlook: Growth, Inflation, Debt

China’s US$10.8 Billion Trade Shortcut: Why the Pinglu Canal Matters

High-CPM Finance Niches 2026: Publisher Monetization Blueprint

Middle East War Economics 2026: Oil Prices & Energy Markets

China Stocks Today: Are Big Economies in Asia Nearing a Market Bottom?

Social Security Trust Fund 2032: OASI Depletion Timeline Explained
-

 Markets & Finance9 months ago
Top 15 Stocks for Investment in 2026 in PSX: Your Complete Guide to Pakistan’s Best Investment Opportunities
-

 Analysis7 months ago
Johor’s Investment Boom: The Hidden Costs Behind Malaysia’s Most Ambitious Economic Surge
-

 Analysis7 months ago
Top 10 Stocks for Investment in PSX for Quick Returns in 2026
-

 Banks8 months ago
Best Investments in Pakistan 2026: Top 10 Low-Price Shares and Long-Term Picks for the PSX
-

 Analysis8 months ago
Brazil’s Rare Earth Race: US, EU, and China Compete for Critical Minerals as Tensions Rise
-

 Investment9 months ago
Top 10 Mutual Fund Managers in Pakistan for Investment in 2026: A Comprehensive Guide for Optimal Returns
-

 Global Economy9 months ago
15 Most Lucrative Sectors for Investment in Pakistan: A 2025 Data-Driven Analysis
-

 Global Economy9 months ago
Pakistan’s Export Goldmine: 10 Game-Changing Markets Where Pakistani Businesses Are Winning Big in 2025