
GDP
Singapore GDP Grew 6% in Q1 2026 — Why Forecasts Stay Cautious

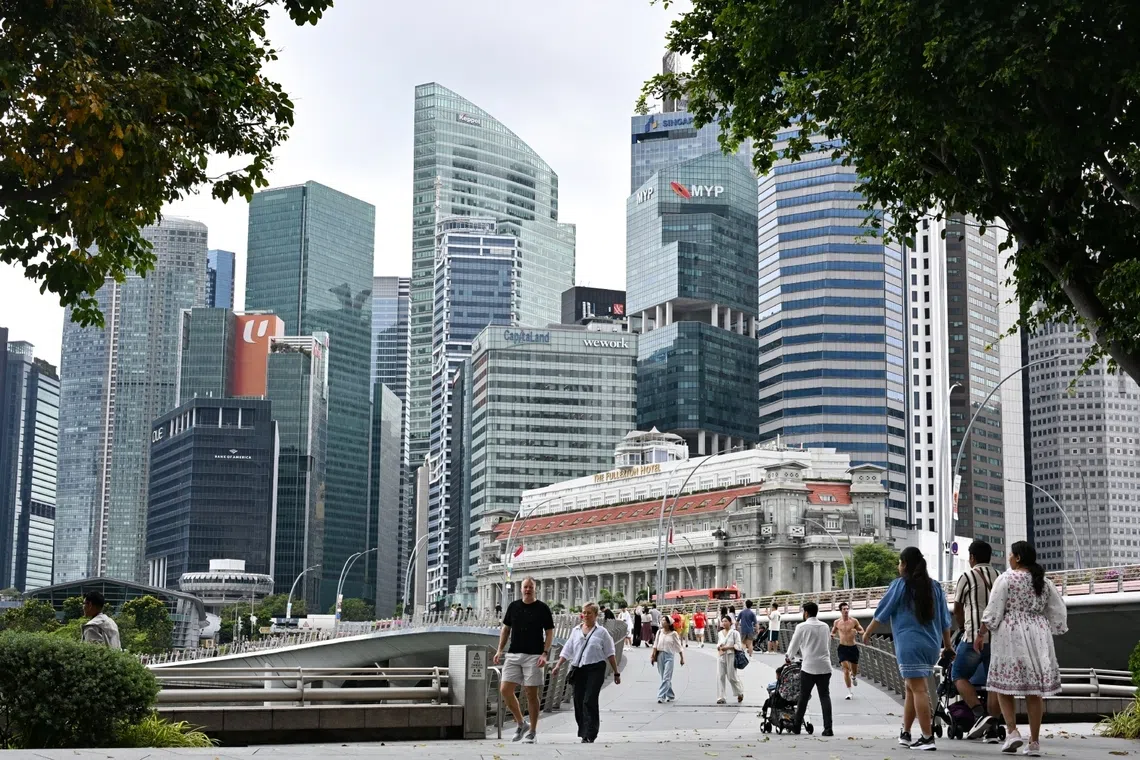
Singapore‘s economy expanded 6.0% year-on-year in the first quarter of 2026, a headline figure strong enough to suggest the city-state has largely shrugged off the disruption radiating from the US-Israel-Iran conflict. Yet the government’s own forward-looking signals tell a more cautious story: Singapore has held its full-year GDP growth forecast at a comparatively modest 2.0% to 4.0% range even after posting a 6.0% first-quarter print, according to Singapore’s Department of Statistics, while explicitly flagging that downside risks “have risen significantly” as a direct consequence of the conflict.
That gap — a strong quarterly print paired with an unchanged, cautious full-year range — is the clearest signal available that Singapore’s policymakers view the current quarter’s strength as front-loaded rather than representative of the trajectory ahead. As a small, trade-dependent economy long treated by investors as a bellwether for regional and global conditions, Singapore’s own hedging matters well beyond its borders.
Tourism Board Downgrades Spending Even as Arrivals Rise
The clearest evidence of Singapore’s cautious internal read comes from its tourism sector, historically one of the most immediate transmission channels for regional business and consumer sentiment. The Singapore Tourism Board has projected 2026 tourism receipts of between S$31 billion and S$32.5 billion — a decline from the record S$32.8 billion recorded in 2025 — even while forecasting that international visitor arrivals will rise to between 17 million and 18 million, up from 16.9 million the previous year, according to CNBC’s reporting.
That divergence — more visitors, less spending per visitor — is a meaningful signal in its own right. Amanda Ow, a senior Singapore Tourism Board official, has described current conditions as highly uncertain and volatile, and has said the board is deliberately taking a more conservative view of how the year will unfold. Melissa Neufang, an industry analyst quoted in the same CNBC report, noted that uncertainty is not a natural ally of the travel industry, even as she highlighted that meetings and conference travel has remained among the more resilient segments within the broader tourism slowdown.
Singapore’s exposure runs directly through its role as a regional aviation and business-travel hub. Tourism accounted for 6% of Singapore’s total services exports in 2024, and Changi Airport handled a record 70 million passengers in 2025 — scale that makes even a modest per-visitor spending decline a meaningful drag on services-sector revenue, independent of headline visitor arrival numbers.
Why the Headline GDP Number Overstates Underlying Momentum
Singapore’s role as a global trade and logistics hub means its GDP figures are unusually sensitive to front-loading effects — companies and traders accelerating shipments and transactions ahead of anticipated disruption, which can inflate a single quarter’s growth figure without reflecting a durable improvement in underlying demand. The Iran conflict‘s disruption of the Strait of Hormuz, and the resulting spike in global energy and shipping costs, creates precisely this kind of incentive: businesses moving inventory and completing trade flows earlier than they otherwise would, anticipating that conditions will deteriorate rather than improve through the remainder of the year.
This dynamic helps explain why Singapore’s government has resisted revising its full-year forecast upward despite the strong quarterly print. The Ministry of Trade and Industry’s decision to maintain the 2.0% to 4.0% range — rather than narrowing it toward the top end given the 6.0% first-quarter result — signals an institutional expectation that growth will decelerate meaningfully through the remainder of the year as front-loading effects fade and the underlying cost pressure from sustained higher energy prices works through the broader economy.
Singapore’s Calendar Resilience as a Partial Offset
Despite the softer spending outlook, Singapore has continued attracting marquee international events that provide some cushion against broader tourism softness. Amanda Ow noted that Singapore’s events calendar has remained notably resilient despite flight disruptions linked to Middle East tensions, pointing to South Korean boyband BTS‘s planned four-night Singapore stop in December as a concrete example of continued demand for major entertainment bookings, alongside a newly announced three-year content partnership with South Korean drama production company Mr. Romance.
Singapore is also proceeding with infrastructure investment aimed at supporting longer-term tourism capacity regardless of near-term volatility, including a new cruise and ferry terminal opening July 15, featuring a VIP lounge and automated baggage handling designed to support a cruise sector that recorded 375 ship calls and more than 2 million passengers in 2025. These investments reflect a strategic calculation that current volatility, however material to 2026’s specific numbers, should not derail Singapore’s longer-term Tourism 2040 target of reaching S$47 billion to S$50 billion in annual tourism receipts.
What Singapore’s Caution Signals for the Wider Region
Singapore’s dual signal — strong headline growth alongside a deliberately unrevised, cautious full-year outlook — offers a useful template for how policymakers across trade-dependent Asian economies are currently navigating the Middle East disruption. Rather than reacting to a single strong data point by revising growth expectations upward, Singapore’s institutions appear to be treating the first quarter’s strength as likely temporary, driven by trade front-loading and residual momentum from before the conflict’s most disruptive phase, rather than as evidence the economy has durably absorbed the shock.
Given Singapore’s long-standing role as a bellwether for regional economic conditions — a role explicitly referenced in the government’s own tourism messaging — this cautious internal posture is arguably a more informative signal for investors and policymakers tracking the broader Asian growth outlook than the headline 6.0% growth figure itself. If Singapore’s own forecasters, with access to real-time trade, shipping, and financial flow data unavailable to most external analysts, are unwilling to revise their outlook upward despite genuinely strong first-quarter data, that reluctance is itself a meaningful data point about how the region’s most trade-exposed economy expects the remainder of 2026 to unfold.
Discover more from The Economy
Subscribe to get the latest posts sent to your email.


The Ultimate Measure of Economic Health and Output
Gross Domestic Product (GDP) is the most widely recognized macroeconomic indicator in the world. It represents the total monetary or market value of all final goods and services produced within a country’s geographic borders during a specific time period (usually a quarter or a year).
For financial analysts, policymakers, and readers of Thefinance.pk, GDP acts as a comprehensive scorecard for a country’s economic health. When GDP is growing, the economy is expanding, businesses are hiring, and tax revenues are rising. When GDP contracts for two consecutive quarters, the economy is technically in a recession.
The Four Pillars of GDP
GDP is traditionally calculated using the expenditure approach, summarized by the famous macroeconomic equation: GDP = C + I + G + (X – M)
- Consumption (C): This is the largest component of GDP. It includes all private consumption expenditures by households on durable goods (cars, appliances), non-durable goods (food, clothing), and services (haircuts, medical visits).
- Investment (I): This refers to business investments in capital. It includes the construction of new factories, the purchase of software and machinery, and changes in business inventories. (Note: This does not mean buying stocks and bonds).
- Government Spending (G): This encompasses all government consumption, investment, and expenditures. It includes infrastructure projects, military spending, and public sector salaries. It excludes transfer payments like pensions or unemployment benefits, as these do not represent new production.
- Net Exports (X – M): This is the value of a country’s total exports (X) minus its total imports (M). If a country exports more than it imports, it has a trade surplus, which adds to GDP. If it imports more, it has a trade deficit, which subtracts from GDP.
The Illusion of Nominal GDP
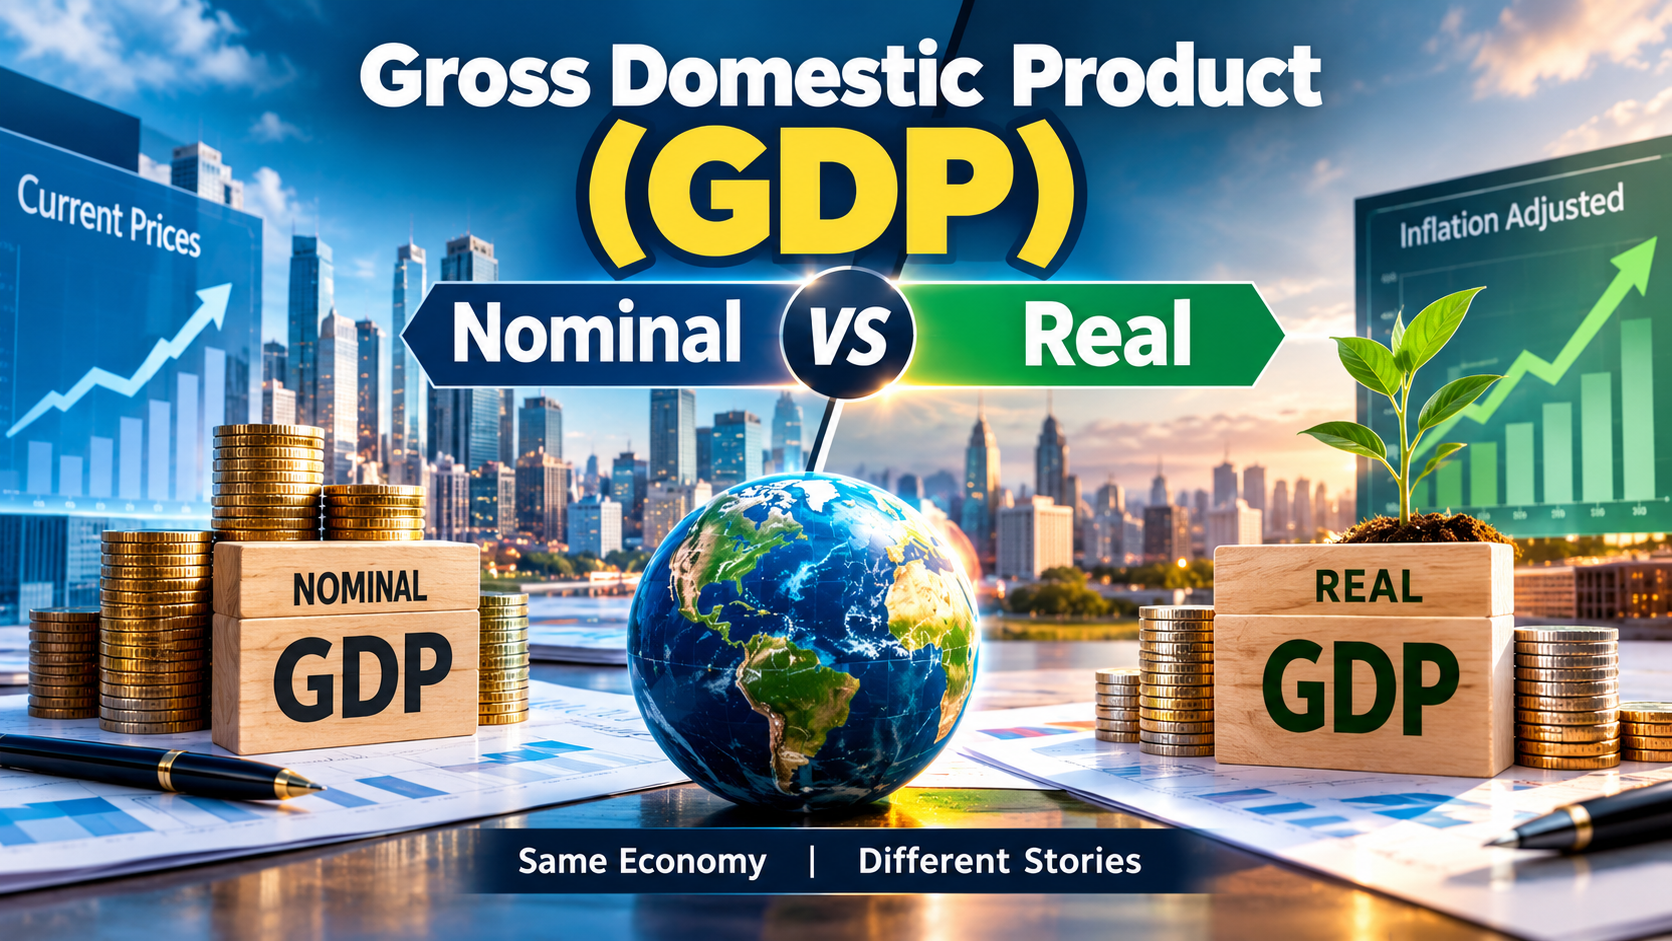
Nominal GDP is the raw measurement of economic output using current market prices. It does not strip out the effects of inflation or deflation.
This creates a significant analytical problem. Suppose a country produces 1,000 cars in Year 1 at $10,000 each. The Nominal GDP is $10,000,000. In Year 2, the country produces the exact same 1,000 cars, but due to inflation, the price of each car has risen to $12,000. The Nominal GDP in Year 2 is now $12,000,000.
Looking solely at Nominal GDP, the economy appears to have grown by 20%. However, the actual physical output—the number of cars produced—has not changed at all. The growth is entirely an illusion created by inflation.
The Truth of Real GDP
To get an accurate picture of economic growth, economists use Real GDP. Real GDP adjusts the nominal data for inflation, providing a metric that reflects the true volume of production.
To calculate Real GDP, statisticians use a tool called the GDP Deflator, which tracks the price changes of all domestically produced goods and services. By applying the GDP deflator, the output of the current year is evaluated using the constant prices of a designated “base year.”
If Real GDP goes up, it means the country is genuinely producing more goods and services, creating a higher standard of living. For sites like Economy.com.pk, emphasizing Real GDP is critical. In a high-inflation environment, nominal figures can suggest an economic boom, while Real GDP might reveal an economy that is actually stagnant or shrinking.
GDP Limitations: What It Doesn’t Measure
While GDP is the gold standard for measuring economic size, it is not a perfect indicator of societal well-being. Modern economists frequently point out its blind spots:
- The Informal Economy: GDP fails to capture off-the-books cash transactions, black markets, and undocumented labor. In developing nations, the informal economy can account for a massive percentage of actual economic activity that goes unrecorded.
- Unpaid Labor: Household chores, childcare, and volunteer work contribute immensely to society but have no market price, so they are excluded from GDP.
- Environmental Degradation: A country could achieve massive GDP growth by aggressively clear-cutting its forests and polluting its rivers. GDP counts the income from the timber but does not subtract the loss of natural capital or the future costs of environmental damage.
- Income Inequality: A rising GDP does not mean the wealth is distributed evenly. A country’s GDP can surge while the majority of its citizens experience stagnant wages and declining living standards.
Key Takeaways:
- GDP measures the total output of a country based on consumption, investment, government spending, and net exports.
- Nominal GDP uses current prices and can be artificially inflated by rising costs.
- Real GDP adjusts for inflation, providing the most accurate picture of actual economic growth.
- Despite its usefulness, GDP does not measure income distribution, environmental sustainability, or the informal economy.
Authoritative Sources & Further Reading:
- International Monetary Fund (IMF): World Economic Outlook and GDP Data
- World Bank: Gross Domestic Product Analytics
Discover more from The Economy
Subscribe to get the latest posts sent to your email.
While chip stocks tumble on Wall Street, Malaysia’s semiconductor exports and GDP are surging on the same AI boom. Here’s how the real economy and equity markets have diverged.
Key Takeaways
- Malaysia’s electrical and electronics exports are on pace to exceed RM800 billion in 2026, with GDP growing 5.8% in Q2, beating the 5.2% consensus estimate.
- JPMorgan raised Malaysia’s 2026 GDP forecast to 5.3%, putting it ahead of most regional peers.
- Between January 2024 and March 2026, Malaysia’s semiconductor sector secured about MYR92 billion ($22.5 billion) in approved investments, roughly 90% of it foreign direct investment.
- HSBC frames Malaysia’s political and supply-chain neutrality as an increasingly valuable differentiator as chipmakers reassess location risk.
- Global semiconductor sales growth accelerated to 118.4% year-on-year in 2026, far exceeding prior upcycles — a pace RHB warns is unlikely to be sustained indefinitely.
While Wall Street questions whether the AI trade is a bubble (see Article 2), Malaysia’s real economy is delivering a very different verdict. Per The Star, the country’s exports of electrical and electronic products — including semiconductors — are expected to exceed RM800 billion this year, with GDP surging 5.8% in Q2 2026, comfortably beating a 5.2% consensus estimate.
The growth is broad-based rather than confined to chip exports alone. The Star’s reporting notes construction and engineering firm Gamuda’s order book hit a record RM52 billion in June as data centre projects more than offset weakness in property and infrastructure, with the company’s engineering managing director describing Malaysia’s investment case as resting on “a skilled English-speaking workforce and lower cost.” Malaysia’s overall competitiveness has also improved markedly: the same reporting notes the country climbed eight spots to 15th among 70 economies in the 2026 IMD World Competitiveness Ranking, after an 11-rung jump the year before. JPMorgan subsequently raised its 2026 GDP forecast for Malaysia to 5.3%, putting it ahead of most regional peers — a contrast The Star draws explicitly against “precarious” growth conditions in Indonesia (see Article 11) and a Philippines weighed down by high energy costs and a graft scandal.
The scale of investment underpinning this is substantial. Per TechNode Global’s coverage of HSBC research, Malaysia’s semiconductor sector secured around MYR92 billion ($22.5 billion) in approved investments between January 2024 and March 2026, of which roughly MYR83 billion ($20.3 billion) — about 90% — was foreign direct investment. HSBC frames the country’s position within global chip geopolitics as a genuine strategic asset: by maintaining working relationships with both the US and China, and complementing land- and resource-constrained Singapore, Malaysia can keep attracting diversified investment, with its “neutral reputation” becoming more valuable as multinational chipmakers reassess location risk around more geopolitically exposed Asian hubs.
That said, the gains aren’t evenly distributed across the industry. The same HSBC research, per TechNode, describes Malaysia’s chip-sector benefits as “uneven,” with supply risks and the ongoing challenge of moving further up the value chain — beyond assembly, testing and packaging into higher-value design and fabrication — weighing on the country’s longer-term outlook.
There’s also a sustainability question hanging over the entire regional AI-export story. Research house RHB, per TNGlobal’s coverage, notes that global semiconductor sales growth accelerated to 118.4% year-on-year in 2026 — far exceeding the peaks of previous upcycles — while cautioning that such elevated growth “is unlikely to be sustained indefinitely” as AI infrastructure investment matures and inventory and capex gradually normalize. RHB’s analysis flags integrated circuits specifically as Malaysia’s primary transmission channel between global semiconductor demand and domestic export and GDP growth — meaning the country is more directly exposed to a cyclical downturn than its diversified investment base might suggest.
Why It Matters
Malaysia’s real-economy strength offers the clearest evidence yet that the AI-driven demand cycle unsettling Wall Street investors (Article 2) has genuine physical-economy underpinnings in Southeast Asia’s chip-assembly hub — even as analysts at the same research houses warn the current growth pace can’t continue indefinitely.
Data and Evidence
- 2026 E&E export forecast: RM800bn+
- Q2 2026 GDP growth: 5.8%, vs. 5.2% consensus
- JPMorgan’s revised 2026 GDP forecast: 5.3%
- Semiconductor sector approved investment, Jan 2024–Mar 2026: MYR92bn ($22.5bn), ~90% FDI
- Global semiconductor sales growth, 2026: 118.4% YoY
- Malaysia’s 2026 IMD competitiveness ranking: 15th of 70, up 8 spots
Global Impact
Malaysia’s ability to attract diversified investment by staying neutral in US-China chip tensions is a live case study for other mid-sized manufacturing economies weighing how to position themselves amid intensifying great-power competition over semiconductor supply chains.
What Happens Next
Watch whether Malaysia’s approved investments continue converting into realized capacity at the current pace, and whether the country makes visible progress moving beyond assembly-test-package work into higher-value segments of the chip value chain, as HSBC’s research flags as the key longer-term challenge.
Frequently Asked Questions
Why is Malaysia’s economy outperforming while chip stocks fall? Malaysia’s exports and investment reflect real, contracted semiconductor demand, which has remained strong even as equity investors reprice future growth expectations. How exposed is Malaysia to a chip-demand downturn? Significantly — RHB’s research identifies integrated circuits as the primary transmission channel between global semiconductor cycles and Malaysia’s exports and GDP. What makes Malaysia attractive to chipmakers specifically? A skilled, English-speaking workforce, lower costs relative to Singapore, and political neutrality between the US and China. Is Malaysia moving up the value chain? Not yet significantly — HSBC notes this remains a key challenge, with most activity still concentrated in assembly, testing and packaging. How does Malaysia compare to Singapore’s AI-export story? Complementary — HSBC frames Malaysia as benefiting partly because it can absorb investment that land-constrained Singapore cannot.
Discover more from The Economy
Subscribe to get the latest posts sent to your email.
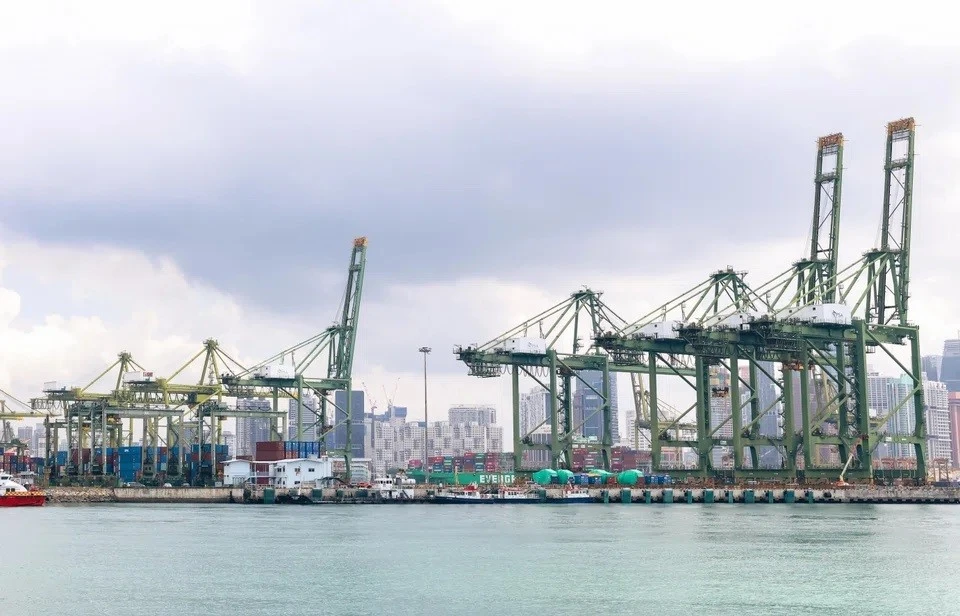
Singapore raised its 2026 GDP forecast to 4.5-5.5% for the second time this year, powered by AI-linked semiconductor exports. Here’s what’s driving the upgrade — and the risk behind it.
Singapore just told the world, in numbers, how deeply its economy has become an AI-trade barometer. Per TechRepublic, Singapore raised its 2026 growth forecast to 4.5-5.5% after stronger-than-expected global AI investment lifted semiconductor demand, exports and manufacturing output — the second upgrade this year, after the Ministry of Trade and Industry moved its outlook from 1-3% to 2-4% in February before this August revision.
Key Takeaways
- Singapore’s Ministry of Trade and Industry raised its 2026 growth forecast to 4.5-5.5%, its second upgrade of the year.
- The economy grew 5.9% year-on-year in Q2 2026, pushing first-half growth to 6.1%.
- AMRO estimates roughly half of global AI-related trade passes through ASEAN+3, with AI-linked exports generating about two-thirds of the region’s export growth in Q1.
- The same exposure that’s lifting Singapore’s growth is also its biggest downside risk if global AI capex growth slows.
- AMRO modeled a scenario where a slowdown to 2024-era AI investment growth could cut ASEAN+3 growth to 2.5% in 2027 — its weakest rate outside the pandemic.
The scale of the upgrade reflects genuinely strong underlying data, not just optimistic forecasting. The same TechRepublic reporting notes Singapore’s economy grew 5.9% year-over-year in Q2 2026, pushing first-half growth to 6.1% — with MTI attributing the strength specifically to stronger-than-expected global AI investment supporting producers and exporters of AI-related products such as semiconductors.
What makes this more than a single-country story is the regional read-through TechRepublic’s reporting highlights: the ASEAN+3 Macroeconomic Research Office (AMRO) estimates that roughly half of all global AI-related trade passes through ASEAN+3 economies, and that AI-linked exports generated around two-thirds of the region’s total export growth in Q1 2026 alone. AMRO subsequently raised its own 2026 regional growth forecast to 4.1%, citing the same AI-demand strength.
That concentration cuts both ways, and AMRO’s own modeling — cited in the same TechRepublic piece — makes the downside risk explicit: if global AI investment growth cools back to its 2024 pace, ASEAN+3 growth could slow to as little as 2.5% in 2027, which would be the region’s weakest growth rate outside the pandemic. In other words, the same exposure driving Singapore’s upgrade today is the single largest swing factor for the region’s growth trajectory over the next 12-18 months.
This dynamic isn’t new to 2026 — it has been building for months. Earlier reporting from Nikkei Asia in May 2026 already described how the AI boom had pushed Singapore and Malaysia’s electronics shipments to historic highs despite the supply-chain shock from the Middle East conflict — evidence that AI-linked demand has proven more resilient to regional geopolitical shocks than most other export categories. And the granular trade data backs the framing: per Malay Mail’s reporting on Enterprise Singapore data, non-oil domestic exports grew 9.3% in January 2026 alone, with electronics exports specifically up 56.1%, driven primarily by integrated circuits and disk media products — even as non-electronics exports actually declined 3%, underlining how narrowly concentrated the growth engine is.
Why It Matters
Singapore’s story is the clearest real-economy counterpoint to the Wall Street semiconductor selloff detailed in Article 2: even as chip stocks fall on sentiment concerns, the physical trade flows underpinning Singapore’s economy show no sign of the demand softness equity investors are pricing in — reinforcing the “fundamentals vs. sentiment” tension at the heart of the stock story.
Data and Evidence
- Singapore 2026 growth forecast: raised to 4.5-5.5% (second upgrade of the year, from 2-4% in February)
- Q2 2026 GDP growth: 5.9% YoY; H1 2026 growth: 6.1%
- ASEAN+3 AI-linked trade share: ~50% of global AI-related trade passes through the region
- ASEAN+3 Q1 2026 export growth attributable to AI-linked exports: ~two-thirds
- AMRO’s downside scenario: ASEAN+3 growth could fall to 2.5% in 2027 if AI investment growth normalizes to 2024 levels
Global Impact
Singapore’s trajectory is a leading indicator for how global AI capex decisions translate into real Southeast Asian economic outcomes — relevant not just to regional investors but to any nine-market reader tracking whether the AI investment cycle (also central to Articles 2, 7 and 10) is genuinely durable or narrowly concentrated.
What Happens Next
Watch Singapore’s Q3 2026 trade data and any signal from major hyperscalers on 2027 capex plans — both will be read as tests of whether the current AI-export windfall is sustainable or peaking, per AMRO’s own stated risk scenario.
Frequently Asked Questions
Why did Singapore raise its growth forecast again?
Stronger-than-expected global AI investment lifted semiconductor demand, exports and manufacturing output beyond what MTI had projected.
How much of Singapore’s growth is AI-related?
A large and growing share — electronics exports, driven substantially by AI-linked demand, have been the primary growth engine in 2026.
Is this growth model risky?
Yes — AMRO’s own modeling shows a slowdown in global AI investment could sharply cut regional growth as soon as 2027.
How does this compare to Malaysia?
Similar dynamic — see Article 10 — with both countries benefiting from the same AI-hardware supply chain.
Did the Middle East conflict affect Singapore’s exports?
Less than expected — AI-linked export demand has proven more resilient to the conflict than most other trade categories.
Discover more from The Economy
Subscribe to get the latest posts sent to your email.

Anthropic Bans Sustained Abuse of Claude AI Under New Usage Policy Effective November 12, 2026

Jeff Bezos Three-Day Workweek View: What He Really Said

Celeste Frozen Pizza Discontinued: What Conagra Confirmed

US–China Critical Minerals Competition: Why a Trade Deal Cannot Fix Every Supply Risk

Oil Price Outlook 2026: How Supply Risks Reach Fuel Bills, Inflation and Business Costs

AI in Business 2026: Why Faster Employees Do Not Automatically Mean Higher Profits

Mortgage Rates in 2026: Why They Remain High and How to Compare the True Cost

Gold Price Outlook 2026: The Forces Behind the Forecasts—and What Could Reverse Them

Global Economic Outlook 2026: Growth, Inflation and Risks

Trump–Putin Diesel Deal: Why Zelensky Is Angry and What It Means for Fuel Prices

Anthropic Draws the Line: Why Claude’s New Usage Policy Explicitly Bans ‘Cruel Behavior’ Toward AI

Ynon Kreiz & Mattel’s Digital Transformation: Franchise Strategy and Financial Growth

Crude Oil & Petroleum Market Analysis: OPEC+ Decisions and Price Forecasts

Top US Convenience Store Chains: Store Counts, EV Charging, and Sales Trends

Oil Prices Break $100 in 2026: Middle East Conflict & Energy Markets

Middle East War Economics 2026: Oil Prices & Energy Markets

China Stocks Today: Are Big Economies in Asia Nearing a Market Bottom?

PSX Forecast 2026: KSE-100, IMF Reviews & Geopolitics

Crypto Daily Outlook: Bitcoin, Altcoins, and the Future of Decentralized Finance

Global Pension Systems Ranked: The World’s Best and Worst Retirement Frameworks

Enterprise AI Platforms Disrupting B2B SaaS in 2026: Full Analysis

World’s Largest Economies: Ranking the Top Global Powers

Elon Musk’s Next Moves: Disrupting the 2026 Global Economy

Pakistan Economy 2026: Inside the SBP’s Balancing Act

GasBuddy Market Insights: How Crude Price Shifts Impact Local Fuel Cost Averages

World Bank & IMF Reports 2026: Why the “3% Growth” Consensus Is Actually a Debate

Global Equity Market Divergence: US Tech vs. European Dividend Stocks vs. Asian Growth

Stock Market Today: Dow Climbs 500 Points as Markets Shake Off Inflation Jitters
-

 Markets & Finance9 months ago
Top 15 Stocks for Investment in 2026 in PSX: Your Complete Guide to Pakistan’s Best Investment Opportunities
-

 Analysis8 months ago
Johor’s Investment Boom: The Hidden Costs Behind Malaysia’s Most Ambitious Economic Surge
-

 Analysis8 months ago
Top 10 Stocks for Investment in PSX for Quick Returns in 2026
-

 Banks9 months ago
Best Investments in Pakistan 2026: Top 10 Low-Price Shares and Long-Term Picks for the PSX
-

 Analysis8 months ago
Brazil’s Rare Earth Race: US, EU, and China Compete for Critical Minerals as Tensions Rise
-

 Investment9 months ago
Top 10 Mutual Fund Managers in Pakistan for Investment in 2026: A Comprehensive Guide for Optimal Returns
-

 Global Economy10 months ago
15 Most Lucrative Sectors for Investment in Pakistan: A 2025 Data-Driven Analysis
-

 Global Economy10 months ago
Pakistan’s Export Goldmine: 10 Game-Changing Markets Where Pakistani Businesses Are Winning Big in 2025