
Analysis
Turkey’s Gold Sales Deepen Bullion Slump

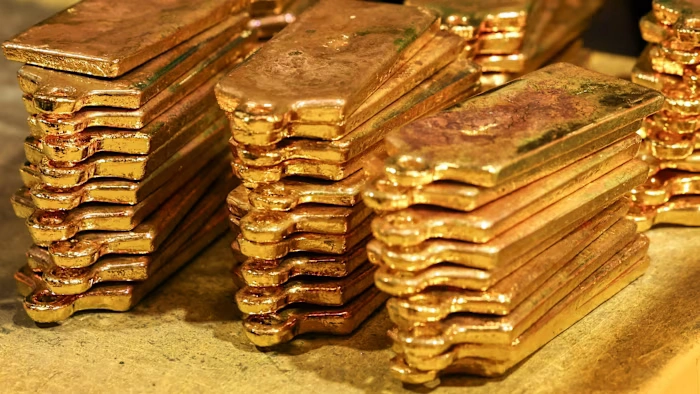
When the Biggest Buyer Becomes the Biggest Seller
There is a particular kind of irony that only central bankers and historians fully appreciate. For the better part of a decade, Turkey’s central bank was the gold market’s most enthusiastic convert—a tireless accumulator that helped write the de-dollarization gospel and gave emerging-market peers the confidence to stack bullion with almost evangelical zeal. Today, the Türkiye Cumhuriyet Merkez Bankası (TCMB) is the global market’s most consequential forced seller. And the price of gold is paying dearly for the conversion.
In the two weeks following the eruption of the Iran conflict on March 13, 2026, Turkey sold or swapped approximately 58 to 70 tonnes of gold—worth roughly $8 billion at prevailing prices—in what Metals Focus and central-bank data now confirm as the largest weekly drawdown of Turkish gold reserves in seven years. The March total, according to filings cross-referenced against TCMB balance-sheet data and reporting by Bloomberg and Reuters, is closing in on $20 billion. The Financial Times, which broke the story this week, described the scale of Turkey’s gold liquidation as a decisive new pressure point on a bullion market already reeling from a 15–19% retreat from January 2026 peaks.
The phrase “Turkey’s gold sales deepen bullion slump” has moved from analyst shorthand to screaming headline in a matter of days. Understanding why it happened—and what it portends—requires looking past the lira and into the architecture of a global monetary order that is cracking in places nobody expected.
The Anatomy of Turkey’s Gold Sales and Lira Defense
The Turkish lira’s structural vulnerability is no secret. Years of unorthodox monetary policy, persistently elevated inflation, and a current-account deficit that never quite closes have left the currency perpetually exposed. When the Iran conflict ignited energy markets in March, Turkey—a net energy importer with a coastline on the world’s most geopolitically volatile shipping lanes—absorbed a supply shock that was brutal in both speed and severity.
The arithmetic of the crisis was straightforward, even if the politics were not. A surging energy import bill widened the current-account deficit almost overnight. Investors, already anxious, began trimming lira exposure. The exchange rate wobbled toward levels that Ankara has historically treated as a red line. The TCMB’s response—selling gold to buy lira, defending the currency through the foreign-exchange mechanism that sits inside its reserve portfolio—was, in isolation, technically rational.
What made it extraordinary was the volume. Turkey’s central bank gold sales in 2026 have already exceeded anything seen since the 2018 currency crisis, when then-President Erdoğan’s heterodox interest-rate theories brought the lira to its knees. The World Gold Council, which tracks official-sector flows with granular precision, had flagged Turkey’s accumulation record as one of the defining demand stories of the post-2022 gold supercycle. In the span of a single month, that narrative has inverted completely.
The mechanism matters. Some of the gold was sold outright on the London Bullion Market—adding physical supply to a market that was already nervous about demand destruction from slowing Chinese purchases and ETF outflows. Some was executed through swap arrangements, where Turkey effectively borrowed dollars against its gold, a short-term liquidity tool that carries its own roll-over risks. The distinction matters for how long these pressures persist: outright sales are a one-time supply shock; swaps are a deferred reckoning.
How Turkey’s Gold Reserve Decline Is Hitting Global Bullion Prices
The impact of Turkey’s gold sales on bullion prices has been amplified by timing and psychology as much as by raw tonnage. Gold markets operate on sentiment as much as supply and demand fundamentals. When the world’s fifth-largest official-sector gold holder starts liquidating at scale, it sends a signal that no algorithm or analyst can easily contain.
Consider what the market was already processing before Ankara’s crisis: a 15–19% retreat in spot gold from its January highs, driven by a combination of Federal Reserve hawkishness, dollar resilience, and a partial unwind of the geopolitical risk premium that had lifted bullion through 2024 and most of 2025. The gold-as-safe-haven thesis was already under interrogation. Turkey’s emergency selling has handed its critics their most powerful argument yet.
The Bank for International Settlements data on cross-border gold flows will eventually quantify what the LBMA daily statistics already hint at: the London market absorbed a meaningful supply surge in mid-to-late March that found insufficient offsetting demand at prevailing prices. Spot gold, which had briefly reclaimed $2,600 per ounce in early Q1, has since struggled to hold levels that would have seemed a floor just months ago.
Here, crucially, is what most coverage has missed: Turkey is not alone. Kazakhstan and Uzbekistan—two other former Soviet republics that aggressively built gold reserves through the 2010s—have also been net sellers in recent months, according to IMF International Financial Statistics. The pattern is not coincidental. It reflects a structural reality about emerging-market central banks that built gold positions when commodity revenues were strong and reserve cushions were generous. When the tide turns—when energy shocks bite, currencies slide, and import bills balloon—gold is often the only liquid, internationally accepted asset they can mobilize quickly. The de-dollarization playbook has a chapter nobody wanted to write.
Turkey Sells Gold Amid Iran War: The Geopolitical Context
The Iran conflict’s role in this story deserves more careful treatment than it has received. The war has not simply raised energy prices; it has altered the risk calculus for every central bank sitting between Europe and the Persian Gulf. Turkey’s geographic position—straddling NATO obligations, energy transit routes, and fragile diplomatic relationships with neighbors on multiple sides—makes it uniquely exposed to any escalation along the Iran-Iraq-Gulf corridor.
The energy shock is real, immediate, and deeply asymmetric in its impact. Western economies, with diversified supply chains and substantial strategic reserves, can absorb it. Turkey, which imports the majority of its energy and runs a current account that is structurally sensitive to oil prices, cannot. The TCMB’s gold sales are, in this light, less a monetary policy choice than an emergency fiscal tool—the sovereign equivalent of breaking glass in case of fire.
What the Financial Times and Bloomberg have correctly identified is the scale. What they have not yet fully reckoned with is the precedent. If Turkey—which spent years building its gold position precisely to create a geopolitically neutral reserve buffer—is forced to liquidate under exactly the kind of crisis that gold reserves are meant to absorb, the entire strategic rationale for EM gold accumulation requires reassessment.
The De-Dollarization Myth Meets the Turkish Moment
This brings us to the uncomfortable thesis that sits at the heart of the bullion slump Turkey central bank story. The de-dollarization narrative of the last decade rested on a seductive logic: gold was the asset of monetary sovereignty, immune to American sanctions, uncorrelated with US Treasuries, and universally accepted. Central banks from Beijing to Ankara to Pretoria bought it not merely as a reserve asset but as a statement of intent—a declaration that the dollar-centric monetary system was losing its claim on the future.
Turkey’s March 2026 liquidation does not disprove that thesis entirely. But it reveals its most significant blind spot: gold’s value as a reserve asset is only realised if you can hold it through a crisis. And holding it through a crisis requires a domestic economy resilient enough to weather the storm without emergency liquidation. Turkey, for all its accumulation over the past decade, did not have that resilience. The lira’s structural fragility consumed the safety margin that the gold position was meant to provide.
This is a warning worth internalizing. The IMF’s latest Article IV consultations with several large EM gold accumulators have noted, with diplomatic understatement, that reserve composition matters less than reserve adequacy and domestic financial stability. Turkey illustrates the point with painful clarity: you cannot de-dollarize your balance sheet while remaining dollarized in your liabilities, your energy imports, and your external financing needs.
For the broader gold market, this has concrete implications. The World Gold Council’s central-bank demand data—which showed official-sector buying at record or near-record levels for three consecutive years through 2025—may be about to enter a period of structural revision. The buyers of the supercycle were largely the same countries that now face the greatest currency and energy pressure. When they become sellers, the bid that sustained gold through multiple Western rate hikes evaporates.
Opportunities in the Slump: What Western Buyers Should Know
Every crisis creates a market. The current bullion slump presents a genuinely complex set of conditions for Western investors—pension funds, family offices, sovereign wealth funds, and retail buyers who have watched gold’s retreat with a mixture of frustration and calculation.
The case for gold has not disappeared. It has been recalibrated. The metal’s role as a hedge against systemic risk—dollar debasement, banking fragility, geopolitical tail events—remains structurally intact. What has changed is the short-term supply dynamic: emergency EM selling has created an overhang that may persist for weeks or months, depending on how quickly the Iran situation stabilises and how effectively Turkey and its peers can restore reserve buffers without further liquidation.
For long-term institutional buyers, the current dislocation offers an entry point at prices that were unimaginable eighteen months ago. The LBMA forward curve suggests the market expects a stabilisation rather than a structural bear market in gold—and there is solid fundamental support for that view. Western central bank demand remains constructive. The structural case for portfolio diversification into gold has not been undermined by Turkey’s crisis; if anything, it has been reinforced by the demonstration that geopolitical risk can materialize with very little warning.
The more interesting question, and the one that deserves serious attention from asset allocators, is whether the next phase of the gold supercycle will be driven by Western institutional demand filling the vacuum left by EM official-sector retreat. If so, the market’s structure—the participants, the pricing dynamics, the geographic distribution of physical demand—will look considerably different in 2027 than it did in 2024.
What Comes Next for the Gold Supercycle
The phrase “supercycle” carries its own risks of hubris, and gold analysts who used it freely in 2024 and 2025 are now quietly adjusting their models. The post-2022 gold supercycle was built on several pillars: EM central-bank accumulation, geopolitical risk premia, dollar debasement concerns, and retail demand in China and India. Turkey’s crisis has weakened the first pillar. The question is whether the others can hold the structure.
In the short to medium term, the outlook depends heavily on three variables: the trajectory of the Iran conflict and its effect on energy prices and EM current accounts; the Federal Reserve’s willingness to pivot away from restrictive policy as global growth slows; and the pace at which Chinese institutional and retail gold demand recovers from its 2025 softness.
None of these are impossible scenarios. All of them are uncertain. What is not uncertain is that the Istanbul Grand Bazaar—where gold traders have watched the market gyrations of 2026 with the particular intensity of people whose livelihoods track the spot price—has seen a shift in sentiment that veteran traders describe as the most significant in a decade. The buyers who once crowded the jewellery shops during lira panics, converting currency into gold as a private act of monetary sovereignty, are now watching their government do the reverse, at scale, with consequences that extend far beyond Turkey’s borders.
That is the real story behind Turkey’s gold sales deepening the bullion slump. It is not merely about tonnes and dollars and reserve ratios. It is about the limits of financial sovereignty in a world where geopolitical shocks move faster than monetary policy can respond—and where even the boldest accumulation strategy can unravel in a matter of weeks when the wrong crisis arrives at the wrong moment.
Discover more from The Economy
Subscribe to get the latest posts sent to your email.



Key Takeaways
- Rolex’s secondary market rose approximately 7.9% year-over-year as of 2026 (per WatchCharts data) — trailing Patek Philippe (+16.2%) and Tudor (+11.4%) but still outperforming Audemars Piguet (+3.4%).
- Rolex raised U.S. retail prices 4–9% in January 2026 (steel models ~5.6%, gold models ~8.7%), narrowing the historical gap between retail and pre-owned pricing.
- Not every model appreciates: steel sports references (Submariner, GMT-Master II, Daytona) have held value far better than two-tone or widely available dress references like the standard Datejust.
- The Lady-Datejust posted the sharpest 2026 gain among tracked collections — up 22.73%, from roughly $9,269 to $11,376 — driven by demand for smaller, “everyday luxury” watches.
- Gold’s rise past $2,400/oz has directly lifted the investment case for Rolex’s precious-metal references (Day-Date, Sky-Dweller, Yacht-Master).
The Model-by-Model Picture
| Category | 2026 Trend |
|---|---|
| Lady-Datejust | +22.73% (strongest performer among tracked collections) |
| Steel sports models (Submariner, GMT-Master II) | Held value well; corrected from 2022 peak but stabilized above retail |
| Daytona | Corrected from highs above $50,000 to the mid-$30,000s; still among the most sought-after references |
| Two-tone/widely available Datejust | Flat to negative — “holds value” is an overstatement for this category |
| Gold references (Day-Date, Sky-Dweller) | Lifted by gold’s rise above $2,400/oz |
Why the “Rolex Always Appreciates” Myth Is Fading
The pandemic-era boom pushed some references — the Daytona above all — to speculative highs disconnected from historical norms. Since the March 2022 peak, steel sports models have compressed meaningfully, and dealers who bought inventory near the top have in some cases faced 20–40% markdowns on liquidation. The lesson for 2026 buyers: Rolex as a category is not a monolith. Value retention depends heavily on specific reference, condition, and whether the piece comes with box and papers (“full set”).
What’s Actually Driving 2026 Strength
- Retail price increases raise the floor. When a new Submariner retails at $10,050 (up from $9,500), a pre-owned example at $11,000–$12,000 suddenly represents a smaller premium — narrowing the gap without secondary prices actually moving.
- Supply discipline remains Rolex’s core lever. The brand has never confirmed production numbers, and secondary-market premiums remain entirely a function of Rolex’s own manufacturing decisions — a risk factor as much as a support.
- Certified Pre-Owned rollout. Rolex’s now fully rolled-out CPO program has changed how buyers transact in the used market, adding a layer of brand-verified legitimacy that supports pricing.
The Case for Rolex as a Portfolio Diversifier
Financial advisors increasingly frame luxury watches not as a replacement for equities or bonds, but as a tangible, historically low-correlation diversifier — one that carries its own risks (illiquidity, condition-dependent pricing, no yield) but has demonstrated multi-decade resilience for specific references.
Is Rolex a good investment in 2026?
It depends heavily on the specific reference. Steel sports models like the Submariner and Daytona have held or grown in value; two-tone and widely available dress models generally have not. Overall, Rolex’s secondary market rose about 7.9% year-over-year in 2026, trailing Patek Philippe but ahead of Audemars Piguet.
Discover more from The Economy
Subscribe to get the latest posts sent to your email.

Navigating Mortgage and Loan Refinancing in a High-Yield Environment
Global public debt crossing critical thresholds has kept central bank policies volatile, resulting in fluctuating US Treasury yields throughout 2026. For homeowners and commercial property holders burdened by previous high-interest borrowing cycles, finding optimal refinance windows has become a high-stakes financial puzzle. Stalled disinflation and stubborn employment numbers mean rate cuts are incremental, requiring borrowers to act with precision.
Timing your mortgage or commercial loan refinance in this environment requires a deep understanding of yield curve movements and lender risk appetites.
Decoding 2026 Refinance Dynamics
The 10-Year Treasury Yield Benchmark
Mortgage rates continue to track closely with the 10-year US Treasury yield. When macroeconomic anxiety spikes debt issuance, yields rise, tightening consumer borrowing capacity. Savvy borrowers monitor weekly Treasury auctions to lock in rates during brief dip windows.
Hybrid ARMs and Alternative Structures
With fixed rates remaining elevated, 7/1 and 10/1 adjustable-rate mortgages (ARMs) have surged in popularity. These products offer lower initial monthly payments, giving borrowers breathing room until central bank easing cycles fully materialize.
| Loan Product | Current Rate Range | Best For | Key Risk Factor |
| 30-Year Fixed Mortgage | 6.2% – 6.8% | Long-term predictability | Higher initial monthly outlay |
| 7/1 Hybrid ARM | 5.5% – 5.9% | Short-term ownership / flipping | Rate reset risk after year 7 |
| Commercial Refinance | 7.0% – 8.2% | Corporate asset restructuring | Strict DSCR lender covenants |
Actionable Steps for Successful Refinancing
To maximize your chances of securing favorable refinance terms in a volatile market, follow a disciplined preparation strategy.
Boost Your Credit Score Immediately: Lenders in 2026 are applying stringent credit tiering; a 20-point increase can drop your APR by a crucial quarter-point.
Shop Regional Credit Unions: Smaller financial institutions often offer portfolio loans with more flexible underwriting than major national banks.
Calculate the Break-Even Point: Ensure your total closing costs are recouped through monthly savings within 24 months of closing.
“Market Strategist View: Refinancing in 2026 is an exercise in opportunistic timing. Borrowers must maintain immaculate financial profiles ready to strike the moment Treasury yields dip.”
Mastering the complexities of today’s debt environment ensures you can successfully lower your debt service costs and protect your long-term financial stability.
Discover more from The Economy
Subscribe to get the latest posts sent to your email.

The days of pulling generic auto insurance quotes based purely on your zip code and age are officially over. In 2026, insurance comparison engines are powered entirely by generative AI and real-time telematics. These platforms digest thousands of live data points—ranging from your driving smoothness via connected vehicle sensors to real-time traffic congestion patterns—to generate hyper-personalized premiums instantly.
For consumers, this evolution represents both a massive opportunity for savings and a hidden trap for penalty pricing. Understanding how AI algorithms evaluate risk is essential for anyone looking to lower their monthly auto insurance premiums.
How AI Comparison Engines Evaluate Your Risk Profile
Behavioral Telematics and Connected Cars
Modern cars stream performance data directly to insurance aggregators. Generative AI models analyze braking sharpness, acceleration curves, cornering G-forces, and phone distraction metrics. Drivers who maintain smooth, defensive habits are rewarded with dynamic rate cuts of up to 40% compared to traditional rating tiers.
Predictive Traffic and Weather Modeling
AI tools now cross-reference your daily commute route with predictive weather and accident probability models. If your standard parking location or driving corridor has a statistically higher incidence of uninsured motorist claims, your quotes will reflect that hyper-local risk assessment.
| Comparison Factor | Traditional Rating Model | 2026 Generative AI Model | Impact on Premium |
| Mileage & Usage | Annual estimated odometer reading | GPS tracking & live trip duration | High (up to 35% savings) |
| Driving Behavior | MVR driving record & accidents | Real-time braking, speed, & G-force | Critical (determines tier) |
| Vehicle Tech | Make, model, and safety rating | ADAS calibration & repair cost data | Moderate |
Strategies to Lower Your AI-Driven Insurance Quote
To outsmart the algorithm and secure the lowest possible premium in 2026, drivers must proactively manage their digital footprint on insurance platforms.
Opt-In for Telematics Trial Periods: Many insurers offer immediate 15% discounts just for installing their driving app; let it track safe habits for 30 days to lock in permanent savings.
Scrub Unverified Public Records: Ensure your motor vehicle report is free of clerical errors that AI risk models misinterpret as reckless behavior.
Compare AI Aggregators: Use platforms that integrate multi-carrier API feeds rather than single-brand comparison sites to find the best risk-adjusted rate.
“Industry Note: AI-driven pricing rewards transparency and precision. Drivers who actively manage their telematics data consistently out-save those relying on legacy quote calculators.”
Embracing AI comparison tools allows savvy policyholders to customize coverage limits precisely to their driving habits, eliminating wasted premium spend while ensuring robust protection.
Discover more from The Economy
Subscribe to get the latest posts sent to your email.

Stock Market Crash in 2026? Warning Signs, Scenarios and a Calm Investor Checklist

Peso Mexicano vs Dólar Estadounidense: A Practical USD/MXN Guide for October 2026

Is the Stock Market Open on Columbus Day 2026? NYSE, Nasdaq and Bonds Explained

Concert Ticket Prices in 2026: Dynamic Pricing, Fees and How to Buy Safely

High-Yield Savings Accounts in 2026: How to Compare APY Without Chasing a Headline

EU-China Trade Deal 2026: How Beijing and Brussels Avoided a Trade War—and Who Wins

Social Security 2027 COLA Announcement: Date, Formula and What Retirees Should Check

China’s AI Microdrama Boom: How Beijing Is Reshaping Global Media

Q3 2026 Earnings Preview: Can Record Profit Expectations Keep Wall Street’s Rally Alive?

Russia Diesel Deal 2026: Oil Prices and Inflation Risks

Fed Rates 2026: Treasury Yields, Bonds and SGOV Explained

S&P 500 Market Breadth 2026: Weak Rally or Rotation?

The AI Capex Boom: Data Centers Reshaping Growth

Palantir Stock in 2026: Extraordinary AI Growth

PSX Forecast 2026: KSE-100, IMF Reviews & Geopolitics

Middle East War Economics 2026: Oil Prices & Energy Markets

China Stocks Today: Are Big Economies in Asia Nearing a Market Bottom?

Crypto Daily Outlook: Bitcoin, Altcoins, and the Future of Decentralized Finance

Global Pension Systems Ranked: The World’s Best and Worst Retirement Frameworks

World’s Largest Economies: Ranking the Top Global Powers

Elon Musk’s Next Moves: Disrupting the 2026 Global Economy

Pakistan Economy 2026: Inside the SBP’s Balancing Act

GasBuddy Market Insights: How Crude Price Shifts Impact Local Fuel Cost Averages

World Bank & IMF Reports 2026: Why the “3% Growth” Consensus Is Actually a Debate

Global Equity Market Divergence: US Tech vs. European Dividend Stocks vs. Asian Growth

Crude Oil & Petroleum Market Analysis: OPEC+ Decisions and Price Forecasts

IMF & World Bank Global Economic Outlook: Growth Forecasts Across Europe and Asia

Silver Price Today: Why the Xi-Trump AI Standoff Is Fueling a Safe-Haven Rally
-

 Markets & Finance9 months ago
Top 15 Stocks for Investment in 2026 in PSX: Your Complete Guide to Pakistan’s Best Investment Opportunities
-

 Analysis8 months ago
Johor’s Investment Boom: The Hidden Costs Behind Malaysia’s Most Ambitious Economic Surge
-

 Analysis8 months ago
Top 10 Stocks for Investment in PSX for Quick Returns in 2026
-

 Banks9 months ago
Best Investments in Pakistan 2026: Top 10 Low-Price Shares and Long-Term Picks for the PSX
-

 Analysis8 months ago
Brazil’s Rare Earth Race: US, EU, and China Compete for Critical Minerals as Tensions Rise
-

 Investment9 months ago
Top 10 Mutual Fund Managers in Pakistan for Investment in 2026: A Comprehensive Guide for Optimal Returns
-

 Global Economy10 months ago
15 Most Lucrative Sectors for Investment in Pakistan: A 2025 Data-Driven Analysis
-

 Global Economy10 months ago
Pakistan’s Export Goldmine: 10 Game-Changing Markets Where Pakistani Businesses Are Winning Big in 2025